Báo cáo khoa học: Training of yeast cell dynamics ppt
Bạn đang xem bản rút gọn của tài liệu. Xem và tải ngay bản đầy đủ của tài liệu tại đây (205.66 KB, 9 trang )
Training of yeast cell dynamics
Karin A. Reijenga
1,
*, Barbara M. Bakker
1
, Coen C. van der Weijden
1
and Hans V. Westerhoff
1,2,3
1 Department of Molecular Cell Physiology, CRbCS, BioCentrum Amsterdam, Faculty of Earth and Life Sciences, Vrije Universiteit,
Amsterdam, the Netherlands
2 Department of Mathematical Biochemistry, BioCentrum Amsterdam, Swammerdam Institute for Life Sciences, the Netherlands
3 Stellenbosch Institute for Advanced Study, University of Stellenbosch, South Africa
Physiological and biochemical experiments are usually
designed in a way that conditions are ideal and homo-
geneous. For example, cell densities are low, substrate
concentrations are well defined and constant, and
product concentrations are kept low to reduce product
inhibition. However, in their natural environment cells
often encounter less ideal conditions. For example, in
industrial fermenters the discontinuous feeding of sub-
strate and the high cell density can cause mixing prob-
lems and inhomogeneous cultures [1]. The organism in
the fermenter experiences a fluctuating extracellular
environment, e.g. in terms of concentrations of sub-
strates [2] and products as well as with respect to pH
and oxygen tension. Glucose fluctuations encountered
by microorganisms in an industrial bioreactor were
found to be in the subminute to minute timescale [3].
In this paper we set out to mimic one aspect of these
nonideal conditions and studied whether the temporal
dynamics of the extracellular glucose concentration
could induce a dynamic response inside the yeast cells.
This issue of whether extracellular dynamics can
cause intracellular dynamics should not be confused
with the issue of whether static extracellular or intracel-
lular conditions can influence autonomous intracellular
dynamics. The latter issue was addressed by Reijenga
et al. [4], for so-called ‘autonomous’ glycolytic oscilla-
tions arising under static extracellular conditions, i.e.
limit-cycle oscillations. The glucose transporter and
therewith the effective concentrations of extracellular
glucose and of inhibitors of glucose transport had sub-
stantial control on the frequency of the oscillations.
Subsequently, it was shown that the glucose transporter
Keywords
dynamics; glycolysis; oscillations; training;
yeast
Correspondence
H. V. Westerhoff, Department of Molecular
Cell Physiology, CRbCS, BioCentrum
Amsterdam, Faculty of Earth and Life
Sciences, Vrije Universiteit, Amsterdam,
the Netherlands
Fax: +31 20 444 7229
Tel: +31 20 444 7230
E-mail:
*Present address
DSM Anti-Infectives, PO 425, NL-2600 MA,
Delft, the Netherlands
(Received 28 September 2004, revised 18
January 2005, accepted 24 January 2005)
doi:10.1111/j.1742-4658.2005.04582.x
In both industrial fermenters and in their natural habitats, microorganisms
often experience an inhomogeneous and fluctuating environment. In this
paper we mimicked one aspect of this nonideal behaviour by imposing a
low and oscillating extracellular glucose concentration on nonoscillating
suspensions of yeast cells. The extracellular dynamics changed the intracel-
lular dynamics – which was monitored through NADH fluorescence – from
steady to equally dynamic; the latter followed the extracellular dynamics at
the frequency of glucose pulsing. Interestingly, the amplitude of the oscilla-
tion of the NADH fluorescence increased with time. This increase in ampli-
tude was sensitive to inhibition of protein synthesis, and was due to a
change in the cells rather than in the medium; the cell population was
‘trained’ to respond to the extracellular dynamics. To examine the mechan-
ism behind this ‘training’, we subjected the cells to a low and constant
extracellular glucose concentration. Seventy-five minutes of adaptation to a
low and constant glucose concentration induced the same increase of the
amplitude of the forced NADH oscillations as did the train of glucose pul-
ses. Furthermore, 75 min of adaptation to a low (oscillating or continuous)
glucose concentration decreased the K
M
of the glucose transporter from
26 mm to 3.5 mm. When subsequently the apparent K
M
was increased by
addition of maltose, the amplitude of the forced oscillations dropped to
its original value. This demonstrated that the increased affinity of glucose
transport was essential for the training of the cells’ dynamics.
1616 FEBS Journal 272 (2005) 1616–1624 ª 2005 FEBS
and several of the glycolytic enzymes exerted substan-
tial control over the eigenvalues of the glycolytic path-
way, thereby codetermining whether yeast glycolysis
oscillates or is steady [5]. These findings confirmed that
static intra- and extracellular conditions can affect
intracellular dynamics. Here we shall address how
dynamic extracellular conditions affect otherwise steady
intracellular processes.
In previous studies on glycolytic oscillations there was
an aspect of adaptation. Alterations in the make-up of
the yeast cells made them prone to limit cycle oscilla-
tions [6,7]. For the cells to engage in sustained rather
than transient oscillations, they had to be harvested at
the diauxic shift (i.e. the shift from using glucose to
using ethanol as a carbon source), and subsequently
starved for 2 h. The essential nature of the pretreatment
has remained unclear, but it is known that the growth
conditions affect the affinity of the glucose transporters
over a wide range [8]. Moreover, starvation induces the
(partial) degradation of glucose transporters [9–11]
possibly bringing yeast glycolysis into the ‘oscillatory
window’ [5]. Indeed, glucose transport offers a wealth
of possibilities for Saccharomyces cerevisiae to exhibit
adaptation. The organism has a large family of hexose
transporters, six of which confer growth on glucose.
These are HXT1–4 and HXT6–7 [12]. An hxt1–7 dele-
tion mutant does not grow on glucose anymore [12].
HXT1 and HXT3 are transporters with low affinity kin-
etics, whereas HXT4 has a moderate affinity for extra-
cellular glucose and HXT6 and HXT7 display a high
affinity [13]. HXT2 exhibits different affinities depend-
ing on the growth conditions [13,14].
The effects of external periodic events on oscillations,
and their possible advantages, have been studied previ-
ously, however, mostly by means of mathematical mod-
els [15–17,18]. Here we perform in vivo experiments to
study these effects. In this study we address cells that
should themselves settle for a steady-state, were it not
for an entrainment by extracellular dynamics. We har-
vested the cells during exponential growth on glucose
and immediately put them on ice, without starvation [6].
Subsequently the cells were subjected to the repetitive
addition of aliquots (‘pulses’) of glucose. As the cells
consumed (part of) the glucose during the intervals, this
led to an oscillating extracellular glucose concentration.
Previously [19], we combined modelling and experiments
to demonstrate resonance of the intracellular dynamics
with an extracellular glucose oscillation under these con-
ditions. It was shown that the amplitude of the intra-
cellular oscillation was considerably higher when the
frequency of the extracellular oscillations was close to
the eigenfrequency of the cells, than at other frequencies
(the eigenfrequency of the cells was taken to be the
frequency of the autonomous oscillations they engaged
in under slightly different conditions). Here, the same
experimental system is used, but the focus is not on
resonance, but on the question of whether the cellular
make-up can change such that their dynamic response
increases. We report that the cells’ response to the
dynamic extracellular glucose increased with prolonged
exposure to the extracellular glucose oscillations, and
identify a possible mechanism that may be responsible
for this increase.
Results
Response of intracellular dynamics to the pulsing
of glucose
S. cerevisiae X2180 was grown on glucose and harves-
ted during exponential phase. After washing, the cells
were resuspended to a protein concentration of
approximately 13 gÆl
)1
. The cell suspension was incu-
bated in a thermostated cuvette (25 °C), and aliquots
of 0.8 mm glucose were administered at a frequency of
1.5 min
)1
. This frequency is in the range that is
observed in industrial fermenters due to incomplete
mixing [3]. As the cells consumed the glucose, this
should lead to an oscillating extracellular glucose con-
centration. It was observed, using glucose indicators
that the extracellular glucose concentration at the end
of the experiment was below 2.8 mm (results not
shown). This indicated that glucose did not accumulate
during the experiment. Intracellular NADH fluores-
cence was measured continuously in the suspension.
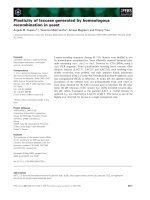
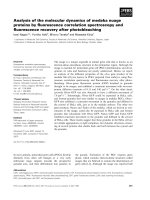
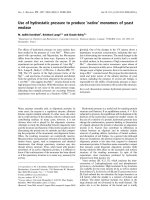
The cell suspension responded to the glucose pulses by
an increase in NADH fluorescence, followed by a
decrease (Fig. 1). The insert to Fig. 1 focuses on a part
of the experiment and indicates the time points where
the glucose pulses were given. The cells were forced
into an oscillation with a frequency that was equal to
the frequency of pulsing. Glucose was given in series
of eight pulses, with 3 min and 20 s without glucose
addition between the series. For the later pulses the
NADH fluorescence increased before the glucose was
added (c.f. the insert to Fig. 1). When the pulsing was
stopped, the oscillations continued for a few periods.
These trailing oscillations were damped and had a
slightly higher frequency than the forced oscillations
(c.f. the insert to Fig. 1). Clearly, extracellular dynam-
ics induced intracellular dynamics.
Training
Interestingly, the number of trailing oscillations
increased with the time of exposure to the glucose
K. A. Reijenga et al. Training of yeast dynamics
FEBS Journal 272 (2005) 1616–1624 ª 2005 FEBS 1617
pulsing regime. At first, no damped oscillations were
observed, whereas later on, two or three periods were
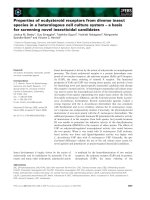
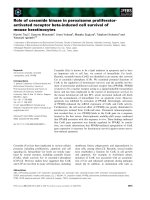
observed (Fig. 1). Moreover, the amplitude of the
enforced oscillations increased strongly in time, ulti-
mately by a factor of four (Figs 1 and 2, Table 1).
During the first two series of pulses the NADH oscilla-
tions had a low amplitude. From the third series
onward its amplitude started to increase until it
reached a plateau after eight series at t ¼ 60 min
(Figs 1 and 2). We will refer to this increase in ampli-
tude as ‘training’, and to the cells that have reached
the maximum amplitude as ‘trained’ cells. When a
trained cell suspension was mixed with a fresh cell sus-
pension, the amplitude was close to the average ampli-
tude of the two independent cultures (minimum 0.04,
maximum 0.14, average 0.09, after mixing 0.10), indi-
cating that the fresh cells were not entrained by the
trained cells (Table 1). To distinguish between the
increase of the amplitude of the NADH oscillation
being due to a change of the cells or to a change in
their environment, the cell suspension was centrifuged
and the cells were separated from the supernatant.
First, trained cells were resuspended in fresh medium
and pulses of glucose were given to the suspension as
described before. In this case the amplitude was similar
to the maximum amplitude of trained cells (0.145).
Subsequently, fresh cells were resuspended in the
supernatant of trained cells. In the latter case the
amplitude was similar to the minimum amplitude at
t ¼ 6 min (0.021) (Table 1). These results indicated
that the increase in amplitude as seen in Figs 1 and 2
0
0.2
0.4
0.6
0.8
1
0 102030405060708090100
Time (min)
Relative NADH fluorescence
(a.u.)
0.4
0.6
0.8
36 38 40 42 44 46
Time (min)
Relatvie NADH fluorescence (a.u.)
A
B
Fig. 1. Intracellular response of yeast cells
to extracellular dynamics. The NADH fluor-
escence (solid line) was measured in a sus-
pension of intact yeast cells. Cells were
grown on glucose, harvested during expo-
nential phase, washed and resuspended to
a protein concentration of 13 gÆL
)1
.At
t ¼ 1 min, glucose was added to a final
concentration of 3.2 m
M. From t ¼ 6 min,
glucose was added in a pulsatile manner in
the following regime: eight times 0.8 m
M at
40-s intervals, followed by a pause of 200 s,
then again eight times 0.8 m
M at 40-s inter-
vals, etc. (Inset) one series of eight pulses.
The solid line represents the NADH fluores-
cence. The triangles indicate when the
glucose pulses were given. Each glucose
pulse amounted to a glucose concentration
of 0.8 m
M and the period of pulsing was
40 s. The bold line represents the six
periods that were used to calculate the
average amplitude of the series.
0
0.05
0.1
0.15
0.2
0 20 40 60 80 100 120
Time (min)
Amplitude (a.u.)
Fig. 2. Amplitude of the intracellular NADH oscillation. The amplitude
was determined from experiments like the one shown in Fig. 1. The
average amplitude of NADH fluorescence during one series was
determined by averaging the amplitudes of all the individual periods
of that series. The first two periods of each series were not taken
into account, as, especially towards the end of the experiment, the
frequency and amplitude of these periods were substantially differ-
ent from the six subsequent periods. The damped oscillations that
were observed after the periodic glucose addition had been stopped
were not taken into account either. Average amplitudes were deter-
mined for all 12 subsequent series of pulses. Here, the average val-
ues of the amplitudes are plotted in time, for five independent
experiments, carried out with cells from independent cultures.
Training of yeast dynamics K. A. Reijenga et al.
1618 FEBS Journal 272 (2005) 1616–1624 ª 2005 FEBS
was due to a change in the make-up of the cells rather
than to some extracellular product in the supernatant;
the cells appeared to have been trained.
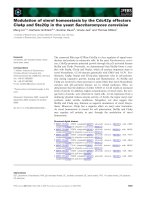
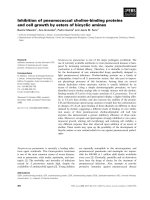
Inhibition of protein synthesis
To test whether the synthesis of new proteins was
required for the increase in amplitude, protein synthe-
sis was blocked by cycloheximide. Inhibiting eukaryo-
tic peptidyl transferase, this compound prevents the
formation of new peptide bonds. No increase in ampli-
tude was observed when cycloheximide had been
added to the cell suspension before glucose (average
amplitude 0.032) (Fig. 3). Two different concentrations
were used (5 lgÆmL
)1
,50lgÆmL
)1
) and the results
were similar. This indicated that protein synthesis
was essential for the training of the cells and that the
proteins involved have a net positive control on the
amplitude.
Continuous low glucose concentration
The increase in amplitude could be caused by two dif-
ferent properties of the extracellular glucose signal:
either (a) its pulsatile character, or (b) its low concen-
tration. The former hypothesis should require that the
cells have a memory for dynamics. The second hypo-
thesis would involve regulation of protein synthesis
and breakdown, after the shift of the cells from a high
glucose concentration during exponential growth to a
low concentration in the cuvette. To distinguish
between these possibilities, cells were subjected to a
continuous glucose feed for 75 min. On average, the
rate of glucose addition was the same as in the pulse
experiments described above. After the incubation,
cells were subjected to pulses of glucose in the cuvette,
as described before, and NADH fluorescence was
measured. The amplitude of the NADH oscillations
after a continuous and low glucose feed (0.17 of our
arbitrary units) was similar to the maximum amplitude
cells that were trained by a pulsatile and low glucose
feed (0.15) (Fig. 4). This indicated that the low glucose
concentration, rather than its pulsatile addition, led to
the expression of proteins that have a pronounced
effect on the amplitude of the intracellular NADH
oscillation.
Glucose transport
The above-described results raised the question of
which proteins were expressed that caused the increase
of the amplitude of the NADH oscillations during
incubation at low glucose concentration. High affinity
Table 1. Amplitude training of yeast cells. Summary of the results of the different experiments described. The second and third column
reflect the average amplitude at t ¼ 10 min and t ¼ 90 min, respectively. The fourth column reflects the average amplitude after different
treatments of the cell suspension. The first experiment (no additions) corresponds to Figs 1 and 2.
Amplitude (a.u.)
Average amplitude after
different treatments
t ¼ 10 min t ¼ 90 min
X2180 0.039 ± 0.002 0.144 ± 0.014
Fresh cells mixed with trained cells (1 ⁄ 1) 0.10
a
Trained cells resuspended in fresh buffer 0.15
a
Fresh cells resuspended in supernatant + 0.021
a
cycloheximide (5 lgÆmL
)1
) 0.029 ± 0.005 0.026 ± 0.009
Continuous low glucose 0.149 ± 0.018
b
a
Amplitude after mixing or resuspending of cells.
b
Amplitude after 75 min of continuous feeding of glucose to the yeast cells. a.u., Arbitrary
units of NADH fluorescence.
0
0.05
0.1
0.15
0.2
0 20406080100
Time (min)
Amplitude (a.u.)
Fig. 3. Effect of inhibition of protein synthesis on the amplitude of
the intracellular NADH oscillation. The amplitude of the intracellular
NADH oscillation was determined in the presence of 0 (d), 5 (–)
and 50 (·)mgÆL
)1
cycloheximide. The stock solution of cyclohexi-
mide (1 gÆL
)1
) had been dissolved in phosphate buffer (100 mM,
pH 6.8). The average values of the amplitudes were determined as
described in the legend to Fig. 2. Cycloheximide was added 10 min
before the first addition of glucose. A duplicate experiment gave
essentially the same result.
K. A. Reijenga et al. Training of yeast dynamics
FEBS Journal 272 (2005) 1616–1624 ª 2005 FEBS 1619
glucose transporters were obvious candidates for two
reasons. First, it is known that after a shift from high
to low glucose concentration, as was the case in these
experiments, high affinity glucose transporters are
induced [8]. It had to be investigated, however, whe-
ther this occurred even over the short time scale of
these experiments. Secondly, glucose transport exerts
a substantial control on the frequency of autonomous
oscillations [4]. We wondered if it also controlled the
amplitude of these forced oscillations. To test the
hypothesis that high affinity transporters were respon-
sible for the training of the cells, we first investigated
whether the affinity of glucose transport did change
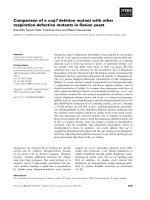
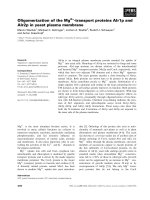
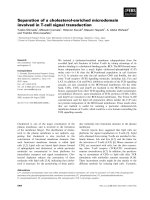
during the pulsing of glucose. Glucose transport kinet-
ics were measured both in cells harvested during expo-
nential phase, and in cells that had been subjected to
a pulsatile glucose concentration for 75 min. From
Fig. 5 it becomes clear that during the experiment the
kinetics of the glucose transporter changed substan-
tially. For cells harvested during exponential phase,
the V
max
and the K
M
of the transporter were
496 ± 23 nmolÆmin
)1
per mg protein and 26.2 ±
0.3 mm, respectively. For the cells after pulsatile addi-
tion of glucose, the V
max
and the K
M
of the transpor-
ter were 518 ± 11 nmolÆmin
)1
per mg protein and
3.5 ± 0.1 mm, respectively. We concluded that the
V
max
of the transport system hardly changed, whereas
the affinity of transport for glucose changed from low
to high.
Subsequently, we asked the question whether the
observed decrease of the K
M
of glucose transport was
required for the increase of the amplitude of the
NADH oscillation. To this end we increased the K
M
of
glucose transport in trained cells artificially to approxi-
mately its value in fresh cells, by addition of maltose,
a competitive inhibitor [20]. As the K
i
of glucose trans-
port for maltose varies with strains and conditions [20]
(presumably depending on which transporters are
expressed), we determined its value in the trained cells.
The K
i
was then 32 mm (results not shown). It was cal-
culated that a final concentration of 210 mm of malt-
ose was needed to increase the apparent K
M
for
glucose transport from 3.5 mm (trained cells) back to
26 mm (exponentially grown cells). At t ¼ 100 min
maltose was added to various final concentrations.
Fig. 6 shows a substantial decrease in the amplitude of
the forced oscillations, after the addition of maltose.
The drop in amplitude increased with the final concen-
tration of maltose as can be seen in Fig. 7. The minor
increase in amplitude upon addition of phosphate buf-
fer may reflect an effect on the fluorescence signal due
to dilution. The values for the amplitude after addition
of maltose were corrected for this dilution. From inter-
polation, it was concluded that a final concentration of
210 mm of maltose, which should increase the K
M
of
the transporter back to its original value, was sufficient
to abolish the increase of the amplitude due to training
by 90% (Fig. 7). These results indicated that, within
experimental error, the difference in K
M
of glucose
0
0.05
0.1
0.15
0.2
0 20 40 60 80 100 120
Time (min)
Amplitude (a.u.)
Fig. 4. Effect of low continuous and low pulsatile glucose concen-
trations on the intracellular dynamics of yeast. The amplitude of the
intracellular NADH oscillation was determined for cells that were
subjected to a pulsatile glucose concentration (s) and for cells that
were first subjected to a low continuous glucose concentration for
75 min and subsequently subjected to a pulsatile glucose concen-
tration (d). The average values of the amplitudes were determined
as described in the legend to Fig. 2. A duplicate experiment gave
essentially the same result.
0
200
400
600
800
0 20 40 60 80 100 120 140 160
V/S (nmol.min
–1
.mg protein
–1
.mM
–1
)
V (nmol.min
–1
.mg protein
–1
)
Fig. 5. Glucose transport kinetics. Eadie–Hofstee plot of zero-trans
influx kinetics of glucose transport in exponentially grown cells (d),
and in exponentially grown cells subjected to a pulsatile glucose
concentration for 75 min (s). The glucose uptake experiments
were performed twice on independent cultures. The average values
of V
max
and K
M
are given here with their standard deviations. For
cells harvested during exponential phase, the V
max
and the K
M
of
the transporter were 496 ± 23 nmolÆmin
)1
per mg protein and
26.2 ± 0.3 m
M, respectively. For the cells subjected to a pulsatile
glucose concentration, the V
max
and the K
M
of the transporter
were 518 ± 11 nmolÆmin
)1
per mg protein and 3.5 ± 0.1 mM,
respectively.
Training of yeast dynamics K. A. Reijenga et al.
1620 FEBS Journal 272 (2005) 1616–1624 ª 2005 FEBS
transport was sufficient to explain the difference in
amplitudes of the forced oscillation between trained
and untrained cells.
Discussion
In this paper we studied the dynamic response of other-
wise steady yeast glycolysis to an oscillating extra-
cellular substrate concentration. Cells were harvested
during exponential growth phase, as these cells do not
engage in limit cycle oscillations, when subjected to
glucose [6]. Indeed, when given steady extracellular
glucose (data not shown), or after the first single addi-
tion of 3.2 mm glucose (Fig. 1) the cell populations in
our experiments exhibited a fairly steady, nonoscillatory
level of NADH fluorescence, but when glucose was
added in a pulsatile fashion, the NADH fluorescence
followed dynamically. This showed either that extracel-
lular dynamics can induce dynamics of intracellular
NADH, hence presumably of intracellular glycolysis,
or that the pulsatile addition of glucose synchronized
pre-existing oscillations of the individual cells.
The latter explanation assumes that the individual
cells oscillated anyway but out of phase. We consider
this explanation unlikely for the following reasons: (a)
it has been demonstrated that the exponentially grown
cells used here could not be synchronized by partly
trapping acetaldehyde, the synchronizing agent [6]; (b)
mixing trained with nontrained cells led to oscillations
of average amplitude, whereas synchronization should
have led rapidly to the full amplitude (compare with
[21]); (c) cycloheximide prevented the training, suggest-
ing that at least the amplitude increase due to training
was not due to synchronization; (d) added maltose
reduced the amplitude immediately of cells that should
already have been synchronized, suggesting again that
at least the amplitude increase due to training is not
an effect of synchronization.
The dynamics of the intracellular response was
quasi-sinusoidal at the same frequency as the extracel-
lular perturbation. It was not chaotic, as it might have
been if the cells engaged in limit cycle oscillations
themselves (compare with [22,23]). There was an active
aspect to the cellular response, i.e. after a few glucose
pulses, the response seemed to run slightly ahead of
the extracellular pulsing and the intracellular oscilla-
tions persisted for some time after the extracellular
pulsing had been stopped, and at this somewhat higher
frequency. This behaviour suggests that the cells were
not in a stable node but in a stable focus, and had a
dominant eigenfrequency that was slightly higher than
the frequency of extracellular pulsing. This was the
fastest response of the cells.
There were two slower responses. The first of these
was the increase in average NADH fluorescence
observed during the first three series of pulses (Fig. 1).
From the data on the presumed extracellular glucose
concentration and the measured K
M
and V
max
values
of glucose transport, we estimated the glucose trans-
port rate at the beginning and at the end of the experi-
ment. At the beginning of the experiment the glucose
transport activity should have been too low to com-
pletely consume the extracellular glucose within 40 s,
Fig. 6. Effect of inhibition of glucose transport on the amplitude of
the intracellular NADH oscillation. The amplitude of the intracellular
NADH oscillation was determined before and after the addition of
maltose, a competitive inhibitor of glucose transport, to the cell
suspension. At t ¼ 100 min, maltose [to final concentrations of
22 m
M (s), 111 mM (·)or223mM (–)] or phosphate buffer
[100 m
M, pH 6.8 (d)] was added to the cell suspension. The aver-
age values of the amplitudes were determined as described in the
legend to Fig. 2.
0%
20%
40%
60%
80%
100%
120%
0 0.05 0.1 0.15 0.2 0.25 0.3 0.35
[Maltose] (M)
Decrease in amplitude (%)
Fig. 7. Effect of addition of maltose on decrease in amplitude of
the intracellular NADH oscillation. After addition of maltose to
trained cells, a decrease in amplitude was seen. The amplitudes
after addition of maltose were corrected for dilution of the cell sus-
pension, as the addition of phosphate buffer caused the measured
amplitude to increase. The decrease in amplitude was calculated,
relative to the maximum amplitude.
K. A. Reijenga et al. Training of yeast dynamics
FEBS Journal 272 (2005) 1616–1624 ª 2005 FEBS 1621
and therefore extracellular glucose may have accumu-
lated. Two effects will cause the glucose transport rate
to increase during the experiment: (a) the presumed
accumulation of extracellular glucose; and (b) the
decrease of the K
M
of the transporter. These two
effects should have led to an increased glucose trans-
port activity and therefore they should eventually have
stabilized the glucose concentration averaged over a
pulse and therewith the NADH fluorescence averaged
over a pulse. This may explain the initial increase in
average NADH fluorescence.
The cellular response at the slowest time scale was
the gradual and more than fourfold increase of the
amplitude of intracellular NADH oscillations, a phe-
nomenon we attributed to ‘training’. We observed a
decrease of the K
M
of glucose transport from 26 to
3.5 mm during the training period and proved that
increasing the K
M
back to its original value abolished
the effect of the training on the amplitude. Strictly
speaking we cannot conclude from this result that the
change in K
M
of glucose transport is sufficient to
achieve the training effect and that no other change in
the cellular make-up is involved. This conclusion
would require the opposite experiment of decreasing
the K
M
of untrained cells, without changing anything
else in the cells, which is a more complicated if not
impossible task. Considering, however, that increasing
the K
M
of untrained cells decreased the amplitude
back to its original value, we may conclude that the
K
M
change is necessary. And although we have not
proven it definitively, we find it at least likely that the
K
M
change is the major if not the only change
required to achieve the training effect. Which of the
Hxt proteins are involved, remains open for further
investigation.
Previously, we have determined the control of glu-
cose transport on the frequency of autonomous oscilla-
tions [4]. Glucose transport had substantial control
over the frequency of these oscillations, i.e. on this
dynamic behaviour. Additionally, we have studied
forced oscillations in terms of resonance phenomena in
the same, exponentially grown yeast cells that were
used in this study [19]. As resonance occurs only in
systems around a stable focus, we can conclude that
these yeast cell populations are stable but do have a
dynamic component. We might hypothesize that
through the change in the kinetics of the glucose
transporter the training has an effect on the dynamic
component of the stable cells, i.e. on their eigenfre-
quency. The required change of eigenfrequency would
be very small, since a sharp resonance peak was
observed in the untrained cells at approximately
1.7 min
)1
, indicating that the untrained cells have an
eigenfrequency of 1.7 min
)1
[19] (as compared to a
glucose pulsing frequency of 1.5 min
)1
in this study).
However, the decrease of the K
M
of the transporter in
time should lead to an increase of the rate of the trans-
porter and according to the positive control of the
transporter on the frequency [4] this should increase
the eigenfrequency of the system and thereby move the
eigenfrequency even further away from the extracellu-
lar frequency. Moreover, the previously observed reso-
nance increased the amplitude by less than a factor of
two, while we observe an increase of a factor of four
in this study. Therefore we consider it more likely that
the mechanism of training merely reflects the positive
control exerted by glucose transport on the amplitude
of enforced oscillations. After all, enhanced influx of
glucose should be expected to enhance the reduction of
NAD(P)H.
This study effectively also explored consequences of
fluctuating extracellular conditions in industrial fer-
menters. What do the results mean then for yeast
cells in an industrial environment? During industrial
production of yeast, the average sugar concentration
in the fermenter is low, the cell density is high and
high affinity glucose transporters are expected to be
expressed, as is the case in glucose-limited chemostat
experiments [8]. This situation resembles the condi-
tions described in this paper, particularly as the time
scale of sugar fluctuations in an industrial reactor
may be similar to the frequency of pulsing applied
here [3]. Consequently, we might speculate that the
intracellular metabolism of yeast cells in industrial
fermenters also reacts to extracellular dynamics by
engaging itself in those dynamics. And, it is conceiv-
able that the response itself is subject to training. Of
course the regular glucose pulses that were applied in
the present study are a only a first approximation of
the more complex glucose profile that the cells
encounter in a bioreactor when they pass the medium
inlet repeatedly. Due to the complex time dependence
of extracellular glucose concentration for individual
cells in such a bioreactor, the time scales involved
might have subtle or drastic implications for the
metabolic performance of those cells and for their
gene expression pattern.
This paper illustrates that metabolism can only be
understood by including gene expression and protein
synthesis, as these processes partly determine the
activity of the enzymes involved. As described earlier
[24], the different levels of regulation and control can-
not be treated separately and therefore a hierarchical
approach should be taken to explain the overall cellu-
lar behaviour. Furthermore, the ability of cells to
adapt to their environment and to anticipate to certain
Training of yeast dynamics K. A. Reijenga et al.
1622 FEBS Journal 272 (2005) 1616–1624 ª 2005 FEBS
changes therein may enhance their chances of survival,
by tightly regulating the use of their available free
energy.
Experimental procedures
Chemicals
Yeast nitrogen base without amino acids was from BD
(Franklin Lakes, NJ, USA). Glucose was from Boom
(Meppel, the Netherlands) (when used as carbon and
energy source in the medium) or from Sigma (St. Louis,
MO, USA) (when used in the glucose transport assay).
d-[U-
14
C]glucose was from GE Healthcare (St. Giles, UK),
glass microfibre filters (GF ⁄ C) from Whatman (Brentford,
Middlesex, UK) and liquid scintillation fluid from Perkin-
Elmer (Boston, MA, USA). All other reagents were
obtained from Merck (Whitehouse Station, NJ, USA),
Sigma or Fluka (St. Louis, MO, USA), and were of ana-
lytical grade or higher.
Strain, growth conditions and preparation
of the cell suspensions
The yeast strain S. cerevisiae X2180 was used in all experi-
ments (grown in-house). Cells were grown semiaerobically
on yeast nitrogen base, containing 1% glucose and 100 mm
phthalic acid (pH 5.0, KOH) at 30 ° C and harvested at an
D
600
of 1.0. Cells were washed twice with 100 mm phos-
phate buffer (pH 6.8, KOH) and resuspended in the same
phosphate buffer to an D
600
of 80, corresponding to a pro-
tein concentration of 13 gÆL
)1
. Protein concentrations were
determined according to Lowry [25]. When large amounts
were needed, cells were grown in a 2-L batch fermenter at a
working volume of 1.5 L, a stirrer speed of 800 r.p.m., an
air flow of 45 LÆh
)1
, and at 30 °C and pH 5.0. The medium
was yeast nitrogen base containing 1% glucose and 100 mm
phthalic acid, set to an initial pH of 5.0 by addition of
KOH, but not pH controlled.
Forced oscillations
Cells were incubated in a thermostated cuvette (25 °C, 300–
600 lL) and NADH fluorescence was measured on-line
(excitation 338 nm, emission 456 nm). Fluorescence inten-
sity is given in arbitrary units (a.u.), as the value depends on
instrument settings and cell density. The latter parameters
were standardized, in order to be able to compare experi-
ments between each other. The D
600
of the suspension was
80 (13 gÆL
)1
protein) and conditions in the cuvette were
semianaerobic, i.e. the dense suspension was stirred in the
absence of an additional air supply. Glucose was added
to the suspension either manually or by means of an
automated pump. This computer controlled pump (KD
Scientific 200 two-syringe pump, Holliston, MA, USA) was
operated with a 100-lL Hamilton syringe (#1710 with Tef-
lon luer lock; Ø ¼ 1.46 mm). The syringe was connected to
the cuvette through Teflon tubing ( 40 cm, Ø ¼1 mm)
using two needles (one with a luer lock for the Hamilton
syringe). It was checked that both methods gave similar
results (results not shown). At t ¼ 1.0 min, glucose was
added to a final concentration of 3.2 mm. Starting at t ¼
6.0 min, eight aliquots (‘pulses’) of glucose were given, each
corresponding to an increase in concentration of 0.80 mm,
at a frequency of 1.5 min
)1
(T ¼ 40 s). Pulsing was stopped
for 200 s and at t ¼ 14 min the pulsing was repeated. Dur-
ing a typical experiment, a total of 12 series of eight pulses
were given (Fig. 1). The average amplitude of NADH fluor-
escence during one series was determined by calculating the
amplitudes of all the individual periods, and averaging them
over that series. The first two periods of each series were not
taken into account, as, especially at the end of the experi-
ment, the frequency and amplitude of these periods were
substantially different from the six following periods. The
damped oscillations that were observed after the pulsing
was stopped were not taken into account either. Average
amplitudes were determined for all 12 subsequent series of
pulses.
Continuous glucose feed
For a continuous feed of glucose, a thermostated (25 °C)
and stirred 15-mL vessel was used. Ten millilitres of cells
with an D
600
of 95 were incubated, and glucose was added
continuously using a masterflex pump (microprocessor
pump drive; Cole-Palmer Instrument Company (Vernon
Hills, IL, USA); flow 43.5 lLÆmin
)1
; glucose stock 0.22 m).
In terms of its time average, the rate of glucose addition
was the same as in the pulse experiments. After 75 min,
cells were taken out of the vessel and incubated in a
cuvette, under the same conditions. Subsequently, glucose
pulses were given, as described above, and the cellular
response was again read in terms of NADH fluorescence.
Glucose transport
Before and after 75 min of pulsing of glucose, as described
above, the kinetic characteristics of glucose transport were
measured according to Walsh et al. [26]. Cells that had
been subjected to a pulsatile glucose concentration were
washed and resuspended in phosphate buffer (100 mm,
pH 6.8). The transport assay was performed at 25 °C.
Acknowledgements
This work was supported financially by the Nether-
lands Organization of Scientific Research (NWO) and
the Technology Foundation (STW).
K. A. Reijenga et al. Training of yeast dynamics
FEBS Journal 272 (2005) 1616–1624 ª 2005 FEBS 1623
References
1 Schmalzriedt S, Jenne M, Mauch K & Reuss M (2003)
Integration of physiology and fluid dynamics. Adv Bio-
chem Eng Biotechnol 80, 19–86.
2 Larsson G, Tornkvist M, Stahl Wernersson E, Tragardh
C, Noorman H & Enfors S-O (1996) Substrate gradients
in bioreactors: origin and consequences. Bioprocess
Engineering 14, 281–289.
3 Enfors SO, Jahic M, Rozkov A, Xu B, Hecker M,
Jurgen B, Kruger E, Schweder T, Hamer G, O’Beirne D
et al. (2001) Physiological responses to mixing in large
scale bioreactors. J Biotechnol 85, 175–185.
4 Reijenga KA, Snoep JL, Diderich JA, van Verseveld
HW, Westerhoff HV & Teusink B (2001) Control of
glycolytic dynamics by hexose transport in Saccharo-
myces cerevisiae. Biophys J 80, 626–634.
5 Reijenga KA, Van Megen YMGA, Kooi BW, Bakker
BM, Snoep JL, Van Verseveld HW & Westerhoff HV
(2005) Yeast glycolytic oscillations that are not con-
trolled by a single oscillophore: a new definition of
oscillophore strength. J. Theor. Biol. 232, 385–398.
6 Richard P, Teusink B, Westerhoff HV & van Dam K
(1993) Around the growth phase transition S. cerevi-
siae’s make-up favours sustained oscillations in intracel-
lular metabolites. FEBS Lett 318, 80–82.
7 Richard P, Diderich JA, Bakker BM, Teusink B, van
Dam K & Westerhoff HV (1994) Yeast cells with a
specific cellular make-up and an environment that
removes acetaldehyde are prone to sustained glycolytic
oscillations. FEBS Lett 341, 223–226.
8 Diderich JA, Schepper M, Van Hoek P, Luttik MA,
Van Dijken JP, Pronk JT, Klaassen P, Boelens HF,
Teixeira de Mattos MJ, Van Dam K & Kruckeberg AL
(1999) Glucose uptake kinetics and transcription of
HXT genes in chemostat cultures of Saccharomyces
cerevisiae. J Biol Chem 274, 15350–15359.
9 Rossell S, Van der Weijden CC, Kruckeberg A, Bakker
BM & Westerhoff HV (2002) Loss of fermentative
capacity in baker’s yeast can partly be explained by
reduced glucose uptake capacity. Mol Biol Report 29,
255–257.
10 Buziol S, Becker J, Baumeister A, Jung S, Mauch K,
Reuss M & Boles E (2002) Determination of in vivo
kinetics of the starvation-induced Hxt5 glucose trans-
porter of Saccharomyces cerevisiae. FEMS Yeast Res 2,
283–291.
11 Krampe S & Boles E (2002) Starvation-induced degra-
dation of yeast hexose transporter Hxt7p is dependent
on endocytosis, autophagy and the terminal sequences
of the permease. FEBS Lett 513, 193–196.
12 Reifenberger E, Freidel K & Ciriacy M (1995) Identifi-
cation of novel HXT genes in Saccharomyces cerevisiae
reveals the impact of individual hexose transporters on
glycolytic flux. Mol Microbiol 16, 157–167.
13 Reifenberger E, Boles E & Ciriacy M (1997) Kinetic
characterization of individual hexose transporters of
Saccharomyces cerevisiae and their relation to the
triggering mechanisms of glucose repression. Eur J Bio-
chem 245, 324–333.
14 Kruckeberg AL, Ye L, Berden JA & van Dam K (1999)
Functional expression, quantification and cellular
localization of the Hxt2 hexose transporter of Saccharo-
myces cerevisiae tagged with the green fluorescent
protein. Biochem J 339, 299–307.
15 Hervagault JF, Lazar JG & Ross J (1989) Predictions
of thermodynamic efficiency in a pumped biochemical
reaction. Proc Natl Acad Sci USA 86, 9258–9262.
16 Schell M, Kundu K & Ross J (1987) Dependence of
thermodynamic efficiency of proton pumps on fre-
quency of oscillatory concentration of ATP. Proc Natl
Acad Sci USA 84, 424–428.
17 Tsuchiya M & Ross J (2003) Advantages of external
periodic events to the evolution of biochemical oscilla-
tory reactions. Proc Natl Acad Sci USA 100, 9691–9695.
18 Swanson CA, Arkin AP & Ross J (1997) An endogen-
ous calcium oscillator may control early embryonic
division. Proc Natl Acad Sci USA 94, 1194–1199.
19 Reijenga KA (2002) Control analysis for forced oscilla-
tions: dynamic effects of extracellular glucose. In
Dynamic Control of Yeast Glycolysis, pp. 109–132, PhD
Thesis, Vrije Universiteit, Amsterdam.
20 Diderich JA, Teusink B, Valkier J, Anjos J, Martins IS,
Dam KV & Walsh MC (1999) Strategies to determine
the extent of control exerted by glucose transport on
glycolytic flux in the yeast Saccharomyces bayanus.
Microbiology 145, 3447–3454.
21 Richard P, Bakker BM, Teusink B, Dam KV &
Westerhoff HV (1996) Acetaldehyde mediates the
synchronization of sustained glycolytic oscillations in
populations of yeast cells. Eur J Biochem 235, 238–241.
22 Markus M, Kuschmitz D & Hess B (1984) Chaotic
dynamics in yeast glycolysis under periodic substrate
input flux. FEBS Lett 172, 235–238.
23 Boiteux A, Goldbeter A & Hess B (1975) Control of
oscillating glycolysis of yeast by stochastic, periodic,
and steady source of substrate: a model and experimen-
tal study. Proc Natl Acad Sci USA 72 , 3829–3833.
24 Jensen PR, Van der Weijden CC, Jensen LB, Westerhoff
HV & Snoep JL (1999) Extensive regulation compro-
mises the extent to which DNA gyrase controls DNA
supercoiling and growth rate of Escherichia coli. Eur J
Biochem 266, 865–877.
25 Lowry OH, Roseborough NJ, Farr AL & Randall RJ
(1951) Protein measurement with the Folin phenol
reagent. J Biol Chem 193, 265–275.
26 Walsh MC, Smits HP, Scholte M & Van Dam K (1994)
Affinity of glucose transport in Saccharomyces cerevisiae
is modulated during growth on glucose. J Bact 176,
953–958.
Training of yeast dynamics K. A. Reijenga et al.
1624 FEBS Journal 272 (2005) 1616–1624 ª 2005 FEBS