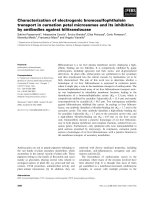
Báo cáo khoa học: Characterization of depolarization and repolarization phases of mitochondrial membrane potential fluctuations induced by tetramethylrhodamine methyl ester photoactivation pdf
Bạn đang xem bản rút gọn của tài liệu. Xem và tải ngay bản đầy đủ của tài liệu tại đây (447.14 KB, 11 trang )
Characterization of depolarization and repolarization
phases of mitochondrial membrane potential fluctuations
induced by tetramethylrhodamine methyl ester
photoactivation
Angela M. Falchi, Raffaella Isola, Andrea Diana, Martina Putzolu and Giacomo Diaz
Department of Cytomorphology, University of Cagliari, Monserrato, Italy
Fluctuations of the mitochondrial membrane potential
(MMPFs) have been investigated in mitochondria
of intact cells [1–7] and in isolated mitochondria
[2,8,9] stained with tetramethylrhodamine derivatives
(TMRM, TMRE and related compounds, hereafter
indicated as TMRM). It has been postulated that
mitochondrial depolarization is due to singlet oxygen
generated by the photoactivation of TMRM [10]. Depo-
larization is followed by the efflux of the fluorescent
probe, which stops the production of singlet oxygen.
This allows the mitochondrial potential to be recovered,
followed by a new influx of TMRM from the
cytosol. Thus, the continuous illumination of TMRM-
stained mitochondria triggers cyclic depolarization and
repolarization phases, at least as long as mitochondria
are able to counterbalance the oxidative and dissipative
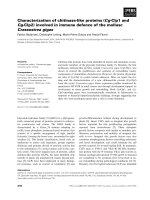
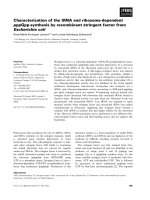
effects. A hypothetical model of MMPFs induced by
TMRM photoactivation is shown in Fig. 1.
If the role of TMRM is evident, on the other hand,
the mechanism directly responsible for the mitochond-
rial depolarization is not clear. The existence of a link
between NAD(P)H, reactive oxygen species (ROS) and
the permeability transition pore (PTP) has been dem-
onstrated in numerous studies. However, the complex-
ity of the interactions between ROS, NAD(P)H,
PTP and mitochondrial potential does not allow the
majority of phenomena to be represented by a simple
cause–effect relationship. For example, ROS cause
Keywords
fluorescent probes; mitochondria;
photoactivation; potential fluctuations;
tetramethylrhodamine methyl ester (TMRM)
Correspondence
G. Diaz, Department of Cytomorphology,
University of Cagliari, I-40492 Monserrato,
Italy
Fax: +39 70 6754003
Tel: +39 70 6754081
E-mail:
(Received 5 October 2004, revised 21
January 2005, accepted 26 January 2005)
doi:10.1111/j.1742-4658.2005.04586.x
Depolarization and repolarization phases (D and R phases, respectively) of
mitochondrial potential fluctuations induced by photoactivation of the
fluorescent probe tetramethylrhodamine methyl ester (TMRM) were ana-
lyzed separately and investigated using specific inhibitors and substrates.
The frequency of R phases was significantly inhibited by oligomycin and
aurovertin (mitochondrial ATP synthase inhibitors), rotenone (mitochond-
rial complex I inhibitor) and iodoacetic acid (inhibitor of the glycolytic
enzyme glyceraldehyde-3-phosphate dehydrogenase). Succinic acid (mito-
chondrial complex II substrate, given in the permeable form of dimethyl
ester) abolished the rotenone-induced inhibition of R phases. Taken
together, these findings indicate that the activity of both respiratory chain
and ATP synthase were required for the recovery of the mitochondrial
potential. The frequency of D phases prevailed over that of R phases in all
experimental conditions, resulting in a progressive depolarization of mito-
chondria accompanied by NAD(P)H oxidation and Ca
2+
influx. D phases
were not blocked by cyclosporin A (inhibitor of the permeability transition
pore) or o-phenyl-EGTA (a Ca
2+
chelator), suggesting that the permeabil-
ity transition pore was not involved in mitochondrial potential fluctuations.
Abbreviations
CsA, cyclosporin A; DCDHF, 6-carboxy-2¢,7¢-dichlorodihydrofluorescein diacetate diacetomethyl ester; D phase, depolarization phase; IAA,
iodoacetic acid; MMPF, mitochondrial membrane potential fluctuation; NP-EGTA, o-nitrophenyl EGTA; PTP, permeability transition pore; R
phase, repolarization phase; ROS, reactive oxygen species; SAD, succinic acid dimethyl ester; TMRM, tetramethylrhodamine methyl ester.
FEBS Journal 272 (2005) 1649–1659 ª 2005 FEBS 1649
depolarization, but they are themselves produced by
the respiratory chain at a rate that varies with the
membrane potential [11,12]; NAD(P)H energizes the
mitochondrion, but NAD(P)H is also an essential sub-
strate of glutathione and a direct scavenger of singlet
oxygen [10]; PTP opening causes depolarization, but
PTP may also be activated by depolarization [13];
PTP-induced depolarization may be inhibited by oxy-
gen radical scavengers, catalase and glutathione
[2,4,5,14].
Likewise, it is not clear how the mitochondrial
potential is restored after the TMRM efflux. Elimin-
ation of ROS, if present, and switching of PTP to the
close configuration, if previously made to open, are
essential but not sufficient conditions for recovery of
the mitochondrial potential. Mitochondrial repolariza-
tion requires the active support of the respiratory
chain and ⁄ or the energetic contribution of ATP hydro-
lysis. The latter mechanism has been found to occur in
response to depolarization induced by protonophores
or Ca
2+
overloading [15,16]. Moreover, ATP hydro-
lysis is the sole mechanism capable of energizing
DNA-depleted, metabolically inert mitochondria [17,18],
as well as mitochondria of blood eosinophils, which
have a functional role in apoptosis but not in respir-
ation [19].
The aim of this work was to investigate the mecha-
nisms underlying MMPFs induced by TMRM photo-
activation, by testing the effects of specific inhibitors
on mitochondrial depolarization and repolarization
phases, analyzed separately.
Results
The effect of TMRM photoactivation on the mitoch-
ondrial potential can be evaluated by comparing the
average curves of mitochondrial depolarization under
conditions of continuous and discontinuous illumin-
ation (Fig. 2A). However, MMPFs were visible only
on plotting data of single mitochondria, and some rep-
resentative traces are shown in Figs 2B and 6. The
exact identification of depolarization phases (D phases)
and repolarization phases (R phases) of MMPFs was
obtained by derivative analysis, as illustrated in
Fig. 2C–D and Fig. 3 (details are given in Experimen-
tal Procedures).
Generation of ROS by mitochondria exposed to
TMRM illumination was detected by 6-carboxy-2¢,7¢-
dichlorodihydrofluorescein diacetate diacetomethyl
ester (DCDHF) (Fig. 4). ROS were not observed in
mitochondria exposed to light in the absence of
TMRM, nor in mitochondria filled with TMRM but
not exposed to light [20]. The intensity of ROS, as
detected by DCDHF, was roughly proportional to the
TMRM fluorescence. This confirmed the necessity of
selecting a homogeneous baseline fluorescence intensity
in order to avoid experimental data being confounded
by the effect of the initial amount of TMRM accumu-
lated in mitochondria [21].
In all experimental groups, the frequency of D
phases prevailed over that of R phases, resulting in a
net depolarization at the end of the illumination per-
iod. In untreated cells, the ratio between D and R
phases was about 3 : 1. The frequency of R phases
was significantly reduced by rotenone, oligomycin, auro-
vertin, and iodoacetic acid (IAA) (Fig. 5A). The effect
of azide (P ¼ 0.07) was not significant but close to the
critical threshold. R phases were almost completely
abolished by the combination of aurovertin plus olygo-
mycin, and rotenone plus olygomycin. The effect of
rotenone was removed by combination with succinic
acid dimethyl ester (SAD). These findings suggest that
the activity of both respiratory chain and ATP syn-
thase is required to activate the R phase. On the other
hand, the frequency of D phases was substantially
stable. The frequency of D phases was not affected by
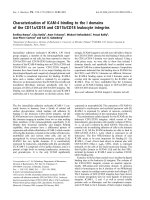
Fig. 1. Schematic model of MMPFs induced by TMRM photoactiva-
tion under continuous illumination conditions. TMRM photoactiva-
tion results in the generation of singlet oxygen and NAD(P)H
oxidation. Possible intermediary effectors of depolarization (super-
oxide, Ca
2+
, permeability transition pore, inner membrane anionic
channels, etc.) are indicated by the ‘?’ symbol. Depolarization is fol-
lowed by the efflux of TMRM, which interrupts the generation of
singlet oxygen and allows the mitochondrial potential to be recov-
ered by the respiratory chain. Repolarized mitochondria accumulate
new TMRM which starts a new cycle.
Mitochondrial membrane potential fluctuations A. M. Falchi et al.
1650 FEBS Journal 272 (2005) 1649–1659 ª 2005 FEBS
o-nitrophenyl EGTA (NP-EGTA) and vitamin E,
whereas a significant increase was found with cyclospo-
rin A (CsA) (Fig. 5B). The Ca
2+
-binding ability of
NP-EGTA was verified by the release of Ca
2+
found
after NP-EGTA photolysis (data not shown). These
findings seem to exclude an involvement of the PTP in
the D phase. Accurate analysis of images also excluded
the occurrence of mitochondrial swelling, a marker of
permeability transition.
The duration of D and R phases was 1.05 and
0.77 s, respectively. The rate of fluorescence changes
in D and R phases was 15 and 12 gray valuesÆs
)1
,
respectively (Fig. 5C–D). Interestingly, the rate of R
phases was not significantly altered, even when the fre-
quency of R phases was extremely low.
The sum of all D and R phase changes accounted
for 78.4% of the total fluorescence change found at
the end of the illumination period (Fig. 2A, curve a).
This discrepancy was probably due to the presence of
small MMPFs, not distinguishable from noise, which
were eliminated by the filtering method. The effect of
probe bleaching was negligible (Fig. 2A, curve c).
MMPFs were simultaneously detected in all sub-
regions of single mitochondrial filaments (Fig. 6). No
evidence of longitudinal propagation of MMPFs was
ever detected, despite the remarkable length of some
mitochondria. However, it cannot be excluded that
propagation of MMPFs may actually occur at a speed
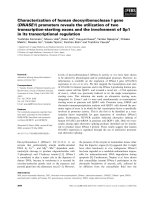
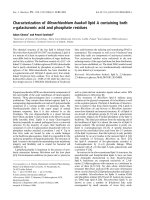
Fig. 2. TMRM florescence measurements. (A) Effect of continuous
(curve a) and discontinuous (curve b) illumination on the mitochond-
rial TMRM fluorescence, sampled at time intervals of 1 s. Discon-
tinuous illumination consisted of light cycles of 20 ms, sufficient to
acquire the image, followed by dark periods of 980 ms. Data repre-
sent averages of several cells, so that MMPFs are not visible.
Curve c shows the fluorescence decay of TMRM due to photo-
bleaching, under continuous illumination. Photobleaching measure-
ments were made on dried stains of TMRM to avoid fluorescence
recovery after photobleaching. For all measurements, baseline val-
ues of fluorescence intensity were in the same range of gray val-
ues (70–130). (B) Representative trace of TMRM fluorescence
intensity changes occurring in a single mitochondrion, exposed to
continuous illumination and sampled at the rate of one image every
60 ms. Typical MMPFs are evident, but the separation of D and R
phases is imprecise. (C) Derivative curve of the TMRM trace. R
and D phases are readily identified by negative and positive peaks,
respectively. (D) Derivative curve after removal of noise (small
peaks) and other irregular (asymmetric) fluctuations. The features
of noise fluctuations were preliminarily analyzed from the autofluo-
rescence of plastic film, using the same optical settings and meth-
ods applied to mitochondria. The max height and max width of
derivative peaks of noise fluctuations were set as cut-off values for
mitochondrial data. The asymmetry of peaks was also considered
to exclude irregular fluctuations with nonlinear slopes. Details are
given in Experimental Procedures.
A. M. Falchi et al. Mitochondrial membrane potential fluctuations
FEBS Journal 272 (2005) 1649–1659 ª 2005 FEBS 1651
faster than 0.17 lmÆms
)1
, which is the detection limit
of our system, based on the ratio between the longest
mitochondria analyzed (10 lm) and the time interval
between consecutive images (60 ms).
In contrast with the simultaneous appearance of
fluorescence changes, the fluorescence intensity was not
uniformly distributed throughout all subregions of
single mitochondrial filaments. This fact was initially
ascribed to the alternation of in-focus and out-of-focus
subregions due to the sinuosity of the mitochondrial
filament. This hypothesis was tested by taking images
at different focus levels, with the expectation of obser-
ving a progressive shift of fluorescence maxima along
the filament. Surprisingly, the longitudinal distribution
of fluorescence levels was not modified by focus chan-
ges, suggesting that longitudinal differences of fluores-
cence intensity were not optical artifacts, but reflected
intrinsic properties of mitochondria or of the sur-
rounding cytoplasmic environment.
TMRM photoactivation resulted in a 34% decrease
in the mitochondrial NAD(P)H autofluorescence, in
close agreement with other investigations [10,22]. The
NAD(P)H decrease after exposure of cells to illumin-
ation, in the absence of TMRM, was only 4%. This
indicated that TMRM photoactivation was the pri-
mary cause of NAD(P)H oxidation. The correlation
between TMRM and NAD(P)H changes was detected
at the level of single mitochondria (Fig. 7). Unfortu-
nately, the relatively long exposure required for
NAD(P)H autofluorescence did not allow the occur-
rence of NAD(P)H fluctuations in parallel with the
acquisition of MMPFs to be verified.
Experiments with TMRM and Calcium Green-1
showed a net accumulation of Ca
2+
into mitochondria
at the end of the period of TMRM illumination
(Fig. 8). The fluorescence change was not attributable
to Calcium Green-1 dequenching, consequent on the
TMRM efflux, because (a) no quenching of Calcium
Green-1 fluorescence was found in TMRM-filled mito-
chondria before depolarization, and (b) no dequench-
ing was found in TMRM-depleted mitochondria after
depolarization induced by fluorocarbonyl cyanide phe-
nylhydrazone.
No transients of the mitochondrial potential were
found after Ca
2+
release induced by ATP stimula-
tion of the IP
3
pathway, despite a prominent
increase in nuclear and cytoplasmic Ca
2+
followed
by synchronous oscillations in both compartments.
Ca
2+
oscillations exhibited a constant duration of
about 12.5 s, independent of their intensity which
was gradually decreasing (see Supplementary mater-
ial). In agreement with the inhibition of R phases
induced by NP-EGTA, Ca
2+
release resulted in a
significant increase in the mitochondrial potential
and NAD(P)H content, presumably because of the
activation of Ca
2+
-dependent mitochondrial dehydro-
genases [23–25].
Discussion
MMPFs induced by TMRM photoactivation have
been extensively investigated to assess the functional
continuity of the mitochondrial network [3–7,26,27]. A
less explored aspect of MMPFs concerns the mecha-
nisms involved in the cyclic loss and recovery of the
mitochondrial potential. In fact, the double role of the
fluorescent probe as inducer and detector of MMPFs
represents a limitation of experimental studies, as any
treatment influencing the baseline TMRM concentra-
tion will also modify the generation of MMPFs, thus
making it difficult to distinguish effects of different
nature. This aspect has not been adequately considered
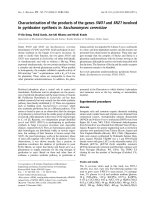
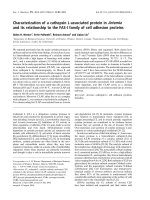
Fig. 3. MMPF recognition. Mitochondrial D and R phases (upper
panel) were numerically recognized by derivative analysis as posit-
ive and negative peaks (lower panel). For each peak, the features
of height, width and symmetry were calculated. The peak height
was calculated as the peak amplitude (segment a). The peak width
was calculated as the interval between the zero-derivative time
points t1 and t2. The peak symmetry was calculated as the lowest
of the reciprocal ratios between the t2-p and p-t1 segments. Cut-
off values for peak height, width and symmetry were set to filter
noise and irregular fluctuations (see Experimental procedures). The
change in the original fluorescence intensity scale was obtained as
the difference between f1 and f2 values observed at the t1 and t2
time points, respectively.
Mitochondrial membrane potential fluctuations A. M. Falchi et al.
1652 FEBS Journal 272 (2005) 1649–1659 ª 2005 FEBS
in previous studies which examined MMPFs in differ-
ent experimental conditions.
The effect of singlet oxygen on PTP, and the
involvement of PTP in MMPFs induced by photo-
dynamic action are still questions open to debate.
Contrasting data obtained by the same group of inves-
tigators have suggested that PTP may be activated or
inhibited by singlet oxygen, in accordance with the
nature and localization of the photosensitizer [28,29].
The issue is complicated by the fact that superoxide, a
proven PTP inducer, is generated at higher rates by
the respiratory chain under oxidative stress conditions,
and singlet oxygen may be a substrate for superoxide
production at the level of complex III of the respir-
atory chain or reacting with NAD(P)H [10]. Further-
more, it is not clear whether PTP is actually involved
in MMPFs. In some investigations, mitochondrial
depolarization induced by TMRM or TMRE photo-
activation was inhibited or decreased by CsA [30,31].
In others [2,6,10], the involvement of PTP was exclu-
ded. Our data indicate that, at least in HeLa cells,
CsA not only does not prevent, but rather increases,
the frequency of D phases. In addition, mitochondrial
swelling, a classical marker of permeability transition,
was never observed during our experiments, even after
mitochondria reached a condition of permanent depo-
larization. Recently, propagation of MMPFs induced
by photo-oxidation has been correlated with the acti-
vation of inner membrane anion channels [22,31].
All the above data were obtained in mitochondria of
intact cells. An apparent contrast in the behavior of
intact cells and isolated mitochondria has been
observed by Huser & Blatter [2] who found that depo-
larization induced by TMRM photoactivation was pre-
vented by CsA in isolated mitochondria but not in
mitochondria of intact cells. To explain this discrep-
ancy, it was hypothesized that mitochondria of intact
cells are less sensitive to CsA because of the abundance
of CsA-binding proteins in the cytoplasm. On the
other hand, depolarization due to calcium-induced cal-
cium release was found by Ichas et al. [32] to be lar-
gely prevented by CsA in mitochondria of intact cells.
Taken together, these findings indicate that CsA is an
effective inhibitor of PTP even in intact cells, but PTP
activation in intact cells is more sensitive to calcium
stimulation than photoactivation of fluorescent probes.
A further difference between these experimental mod-
els is the self-propagation of the depolarization that
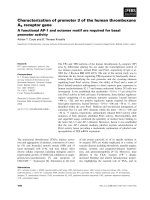
Fig. 4. Generation of ROS by TMRM illumination. Cells were loaded with TMRM and the ROS-sensitive probe DCDHF, with or without pre-
incubation with vitamin E. TMRM images (left) were taken at time zero. DCDHF images (right) were taken at the end of the period of
TMRM excitation (13.8 s). On comparison of images, a close correspondence is revealed between ROS and mitochondrial traces. However,
rather than being confined to the mitochondrial matrix, ROS appear to be spread in the surrounding cytoplasm, thereby suggesting a mech-
anism of ROS release. ROS are also present in the nucleus, which is entirely surrounded by the mitochondrial network. Note that the blurred
appearance of DCDHF is not an effect of poor focus, and that DCDHF does not accumulate in mitochondria, but is rather uniformly distri-
buted throughout the cell [20]. ROS were inhibited by vitamin E. Production of ROS was not elicited by illumination alone in the absence of
TMRM, nor, vice versa, by the sole TMRM in the absence of illumination (data not shown). Bar is 10 lm.
A. M. Falchi et al. Mitochondrial membrane potential fluctuations
FEBS Journal 272 (2005) 1649–1659 ª 2005 FEBS 1653
accompanies calcium-induced calcium release [32],
whereas depolarization induced by photo-oxidation, at
least in the majority of cell types investigated, affects
only the irradiated region but does not propagate to
adjacent mitochondria [26]. Only in cardiomyocytes,
which possess specialized intermitochondrial junctions
[26], has a local laser irradiation been found to activate
a cell-wide, slow traveling wave of depolarization
associated with ROS-induced ROS release [22,31].
However, MMPFs of cardiomyocytes were not preven-
ted by intracellular Ca
2+
buffering with EGTA or
1,2-bis-(aminophen oxy)eth ane- N,N,N¢,N¢-tetra-acetic acid
(BAPTA), in line with our data on HeLa cells. The
increase in mitochondrial Ca
2+
found in our experi-
ments after the induction of MMPFs may be explained
by local exchanges between mitochondria and neigh-
boring Ca
2+
domains of the endoplasmic reticulum
[33–36], which may be responsible for the specific
behavior of mitochondria of intact cells, as compared
with isolated mitochondria.
The higher susceptibility of isolated mitochondria to
PTP [37] may also be considered in relation to the level
of ROS, as isolated mitochondria are generally suppor-
ted by succinate ⁄ rotenone, and the rate of ROS gen-
eration is much higher in mitochondria respiring using
complex II substrates (plus rotenone) than complex I
substrates [38]. In addition, MMPFs of isolated mito-
chondria supported by NAD(P)H-linked substrates
(malate and glutamate) have been found to be insensit-
ive to CsA and negative to the calcein assay for PTP
opening [9,39].
NAD(P)H is important not only as an energetic sub-
strate but also as an antioxidant substrate of glutathi-
one and as a singlet oxygen scavenger [10]. However,
our data suggest that NAD(P)H has a primary role in
respiration, rather than as antioxidant, as R phases,
which are more closely correlated to the energetic util-
ization of NAD(P)H, were strongly inhibited by rote-
none, whereas D phases, which are more closely
Fig. 5. Effects of treatments on MMPFs. The four panels show the
changes of R and
D phase frequencies (number per mitochondrion
per minute) and fluorescence change rates (intensity change per
second) after treatment with 10 l
M NP-EGTA, 50 lM (+)a-toco-
pherol acetate (Vit E), 2 l
M CsA, 5 lM rotenone plus 7.7 mM SAD
(rot + SAD), 6 m
M NaN
3
(azide), 50 lM IAA, 5 lM rotenone (rot),
5 l
M rotenone plus 10 lM oligomycin (rot + oligo), 10 lM oligomy-
cin (oligo), 30 l
M aurovertin (auro) and 30 lM aurovertin plus 10 lM
oligomycin (auro + oligo). Bars represent the median and interquar-
tile range (25th)75th centile). The asymmetry of interquartile
ranges is due to the skewness of data distributions. Significant
(P<0.05) deviations from controls, calculated by the Student–
Newman–Keuls test for multiple comparisons, are indicated by
asterisks.
Mitochondrial membrane potential fluctuations A. M. Falchi et al.
1654 FEBS Journal 272 (2005) 1649–1659 ª 2005 FEBS
correlated to oxidative phenomena, were substantially
unchanged, in spite of the higher NAD(P)H availabil-
ity after complex I inhibition.
DCDHF traces were significantly decreased by vita-
min E. However, vitamin E failed to inhibit MMPFs.
The discrepancy between ROS inhibition and mito-
chondrial depolarization may tentatively be explained
by the observation that vitamin E is able to reduce
ROS present in the cytosol surrounding mitochondria
rather than ROS present in the mitochondrial matrix
[20]. Contrasting effects of vitamin E have also been
found in the inhibition of mitochondrial depolarization
of rat and rabbit cardiomyocytes [31]. However, data
obtained with specific superoxide scavengers [22] and
spin traps [30] have provided consistent evidence that
ROS represent a key factor in triggering MMPFs.
The average duration of MMPFs (1–2 s) was in
close agreement with data obtained in previous studies
using relatively fast acquisition methods [2,4,5,8,30,33].
MMPFs of apparently longer duration in literature
result from data acquired at lower sampling rates [6,9].
R phases were strongly reduced by IAA, rotenone and
ATP synthase inhibitors. Whereas the effect of IAA
and rotenone seems to be obvious, that of ATP syn-
thase inhibitors is open to different interpretations.
One is that ATP synthesis may sustain repolarization
by increasing respiration and ⁄ or by regulating the H
+
influx. A possible alternative is that ATP hydrolysis
contributes to respiration to reach a critical H
+
threshold for the import from the cytosol of energetic
substrates. Further investigation of these issues is
required.
Experimental procedures
Cell treatments
HeLa cells (ATCC) were grown in Dulbecco’s modified
Eagle’s medium with high glucose. Cells were supravitally
stained with 100 nm TMRM for 30 min; 18 lm DCDHF
Fig. 6. Simultaneous vs. independent
MMPFs. Simultaneous MMPFs were found
in all subregions of continuous mitochondrial
filaments (A). On the other hand, adjacent
mitochondria exhibited completely independ-
ent MMPFs (B).
A. M. Falchi et al. Mitochondrial membrane potential fluctuations
FEBS Journal 272 (2005) 1649–1659 ª 2005 FEBS 1655
for 60 min; 5 lm Calcium Green-1 AM for 120 min. Cells
were treated with 10 lm oligomycin (inhibitor of ATP syn-
thase) for 10 min; 30 lm aurovertin (inhibitor of ATP syn-
thase) for 30 min; 5 lm rotenone (inhibitor of complex I)
for 30 min; 6 mm NaN
3
(inhibitor of complex IV and V)
for 30 min; 50 lm IAA (inhibitor of the glycolytic enzyme
glyceraldehyde-3-phosphate dehydrogenase) for 30 min;
7.7 mm SAD (substrate of complex II) for 10 min; 2 lm
CsA (inhibitor of the PTP) for 30 min; 50 lm (+)a-toco-
pherol acetate (vitamin E) for 60 min or overnight; 10 lm
NP-EGTA (a cell permeant probe that binds Ca
2+
with
high affinity until photolysed by UV light) for 30 min;
20 lm ATP (activator of purinergic receptors and the IP
3
pathway) given at the time of acquisition of images. Drug
combinations (aurovertin and oligomycin, rotenone and
olygomycin, rotenone and SAD) were used at concentra-
tions applied for single treatments. Drug vehicles were:
Me
2
SO for TMRM, Calcium Green-1, oligomycin and rote-
none; chloroform for aurovertin; ethanol for CsA; water
for azide, IAA, vitamin E, NP-EGTA and ATP. Stock
solutions were prepared to obtain a 1 : 1000 (0.1%) dilu-
tion of vehicles in the medium. TMRM, DCDHF, Calcium
Green-1 and NP-EGTA were from Molecular Probes
A
B
Fig. 7. Correlation between TMRM changes and NAD(P)H oxida-
tion. (A) NAD(P)H and TMRM images captured at the start and end
of the illumination period. Bar is 10 lm. (B) NAD(P)H and TMRM
fluorescence of 15 mitochondrial regions of the same cell. Each bar
represents the change between the initial (upper edge) and final
(lower edge) value. Mitochondrial regions are conventionally
ordered according to the final TMRM fluorescence intensity.
Fig. 8. Ca
2+
accumulation in mitochondria after MMPFs. Calcium
Green-1 and TMRM images captured at the start and end of the
illumination period. Bar is 10 lm. The plot shows the Calcium
Green-1 fluorescence along a line (indicated in the image) crossing
two mitochondrial filaments, before and after illumination. The hori-
zontal width of mitochondrial profiles shown in the plot indicates
that Ca
2+
influx is not accompanied by matrix swelling.
Mitochondrial membrane potential fluctuations A. M. Falchi et al.
1656 FEBS Journal 272 (2005) 1649–1659 ª 2005 FEBS
(Eugene, OR, USA). All other compounds were from
Sigma (St Louis, MO, USA).
Imaging
Cells were observed with a 100·⁄1.0 water immersion
objective, using a Zeiss Axioskop microscope (Oberkoken,
Germany) with a HBO 50 W L)2 mercury lamp (Osram,
Berlin, Germany) attenuated with a 0.3% transmittance
neutral filter. Fluorescence filters were 528–552 ex, 580 sp.,
590-LP em for TMRM; 460–500 ex, 505 sp., 510–560 em
for DCDHF; 435–485 ex, 500 sp., 515–555 em for Calcium
Green-1; 340–380 ex, 400 sp., 435–485 em for NAD(P)H.
Images were acquired with a 12-bit cooled CCD camera
(Sensicam; PCO Computer Optics, Kelheim, Germany)
with a 1280 · 1024 pixel chip and 2 · 2 pixel binning. Opti-
cal settings provided a nominal over-resolution of 0.1 lmÆ
pixel
)1
. TMRM images were acquired every 60 ms, in series
of 230 images during 13.8 s of continuous illumination
(16.67 frames per s). The series was truncated at the 230th
image, as no MMPFs were observed after this time.
TMRM images were preprocessed with a 3 · 3 average fil-
ter to reduce random noise and unweighted time average
(n ¼ 8) to reduce pixel replication noise. Calcium Green-1
images were acquired with an exposure of 1 s. Because of
the relatively long period (12.5 s) of Ca
2+
oscillations
induced by ATP, in these experiments the acquisition of
images was prolonged to 1 min, at the rate of 1 frameÆs
)1
.
Induction of MMPFs
Preliminary experiments showed that MMPFs depended on
the intensity and duration of illumination and fluorescence
intensity of mitochondria. Illumination conditions were eas-
ily controlled, using the same optical settings in all experi-
ments. On the other hand, the mitochondrial fluorescence
was more difficult to control, because of conspicuous differ-
ences in the amount of TMRM loaded by single cells [21].
Under a condition of continuous illumination required for
fast image acquisition, MMPFs were optimally detected in
mitochondria exhibiting a specific range of fluorescence
intensity, represented by the gray value range 70–130. No
MMPFs were found in mitochondria with a lower fluores-
cence (gray value < 70). On the other hand, mitochondria
with higher fluorescence (gray value > 130) displayed a
very fast depolarization. In this case, the detection of
MMPFs was hindered by a massive release of TMRM in
the cytosol. These data were obtained under a condition of
continuous illumination (20 ms exposure and 40 ms readout
for each image). Mitochondrial depolarization and MMPFs
were reduced when illumination was discontinuous, and
completely abolished when the 20 ms illumination of a sin-
gle image was followed by a dark period of 980 ms (one
frameÆper second). The effect of probe bleaching under con-
tinuous illumination was measured from the fluorescence
decay of TMRM stains obtained by spraying microdroplets
of 100 lm TMRM on a coverslip. TMRM stains were dried
to avoid fluorescence recovery after photobleaching, and
subsequently only those with a fluorescence intensity in the
range of mitochondria (gray values 70–130) were selected
for measurement. The effect of continuous and discontinu-
ous illumination and bleaching are shown in Fig. 2A.
Sampling
Morphological criteria for the selection of mitochondria
were the (a) perfect focus, (b) homogeneous thickness (no
swelling or stretching), (c) separation from each other (no
crossing), (d) sufficient extension to allow the measurement
of three to five points along the filament, and (e) absence of
movements. The occurrence of movements in the x–y plane
and in the z-axis was carefully checked comparing the pixel
positions and focus drift of mitochondria through the stack
of images. However, owing to the relatively short duration
of sessions and linear extension of mitochondrial filaments,
the number of cases of exclusion was very small.
Analysis of fluctuations
D and R phases were identified by numerical differentiation
obtained, for each time point, as the difference between the
three preceding and the three following time points:
FI
0
n
¼ðFI
nÀ3
þ FI
nÀ2
þ FI
nÀ1
ÞÀðFI
nþ1
þ FI
nþ2
þ FI
nþ3
Þ
where FI is fluorescence intensity. This operation trans-
formed D and R phases into peaks of different sign (posit-
ive and negative, respectively), duration and intensity
(Figs 2B,C and 3). The fluorescence change rate (ratio
between fluorescence intensity change and duration) and
frequency (number of events per mitochondrion per minute)
were also calculated from the primary parameters. The
overall noise (inclusive of random and stationary noise, due
to current interference, instability of the arc lamp, occa-
sional vibrations, etc.) was evaluated from the autofluores-
cence of an inert plastic film, using the same optical
settings (fluorescence filters, microscope magnification, iris
opening, CCD gain, exposure, frame rate, etc.) and proce-
dures (image processing, numerical methods) applied to
cells. The fluorescence intensity of the plastic film was made
physically equivalent to the average fluorescence intensity
of TMRM by means of neutral density filters interposed
between the lamp and the microscope. The max height
(¼ 3) and max width (¼ 9) of derivative peaks of the plas-
tic material were set as cut-off values to remove all noise
fluctuations from TMRM data. However, it is possible that
small MMPFs, not distinguishable from noise, may have
been eliminated by the filtering method. The symmetry of
derivative peaks was also taken into account to remove
irregular fluctuations characterized by nonlinear slopes.
Symmetry was calculated as the lowest of the reciprocal
A. M. Falchi et al. Mitochondrial membrane potential fluctuations
FEBS Journal 272 (2005) 1649–1659 ª 2005 FEBS 1657
ratios between the t1-p and p-t2 segments (Fig. 3). Sym-
metry was 1 for perfectly centered peaks and less than 1,
tending to zero, for increasingly irregular peaks, irrespective
of the tail direction. The value of 0.333 was set as cut-off
for symmetry. The relative frequency of rejections because
of height, width and symmetry was 78%, 16% and 6%,
respectively (Fig. 2D). Data were processed with specific
routines developed for Microsoft Excel (Seattle, WA, USA)
and Statistica (StatSoft, Tulsa, OK, USA). Owing to the
considerable skewness of distributions, data were summar-
ized by the median and the 25th)75th centile (interquartile)
range. Differences were tested by analysis of variance
followed by the Student–Newman–Keuls test for multiple
comparisons.
Acknowledgements
We thank Professor Vincenzo Fiorentini (Physics
Department, University of Cagliari) for helpful sugges-
tions concerning numerical methods. The research was
supported by grants from MIUR-FIRB (RBAU01C-
CAJ_003), Istituto Zooprofilattico Sperimentale della
Sardegna (IZS SA ⁄ 001 ⁄ 2001) and Regione Autonoma
della Sardegna, Assessorato dell’Igiene e Sanita
`
e
dell’Assistenza Sociale.
References
1 Loew ML, Tuft RA, Carrington W & Fay FS (1993)
Imaging in five dimensions: time-dependent membrane
potentials in individual mitochondria. Biophys J 65,
2396–2407.
2 Huser J & Blatter LA (1999) Fluctuations in mitochon-
drial membrane potential caused by repetitive gating of
the permeability transition pore. Biochem J 343, 311–
317.
3 Diaz G, Falchi AM, Gremo F, Isola R & Diana A
(2000) Homogeneous longitudinal profiles and synchro-
nous fluctuations of mitochondrial transmembrane
potential. FEBS Lett 475, 218–224.
4 De Giorgi F, Lartigue L & Ichas F (2000) Electrical
coupling and plasticity of the mitochondrial network.
Cell Calcium 28, 365–370.
5 Zorov DB, Filburn CR, Klotz LO, Zweier JL & Sollott
SJ (2000) Reactive oxygen species (ROS)-induced ROS
release: a new phenomenon accompanying induction of
the mitochondrial permeability transition in cardiac
myocytes. J Exp Med 192, 1001–1014.
6 Buckman JF & Reynolds IJ (2001) Spontaneous
changes in mitochondrial membrane potential in cul-
tured neurons. J Neurosci 21, 5054–5065.
7 Collins TJ, Berridge MJ, Lipp P & Sollott SJ (2002)
Mitochondria are morphologically and functionally het-
erogeneous within cells. EMBO J 21, 1916–1627.
8 Huser J, Rechenmacher CE & Blatter LA (1998) Ima-
ging the permeability pore transition in single mitochon-
dria. Biophys J 74, 2129–2137.
9 Vergun O, Votyakova TV & Reynolds IJ (2003) Sponta-
neous changes in mitochondrial membrane potential in
single isolated brain mitochondria. Biophys J 85, 3358–
3366.
10 Petrat F, Pindiur S, Kirsch M & de Groot H (2003)
NAD(P)H, a primary target of
1
O
2
in mitochondria of
intact cells. J Biol Chem 278, 3298–3307.
11 Liu SS & Huang JP (1996) Coexistence of a ‘reactive
oxygen cycle’ with the Q cycle in the respiratory chain.
A hypothesys for generating, partitioning, targeting
and functioning of superoxide in mitochondria.
Proceedings of the International Symposium Natural
Antioxidant Molecular Mechanism and Health Effects
(Parker L, Traber MG & Xin WJ, eds), pp. 513–529.
AOCS Press, Champaign, IL.
12 Korshunov SS, Skulachev VP & Starkov AA (1997)
High protonic potential actuates a mechanism of pro-
duction of reactive oxygen species in mitochondria.
FEBS Lett 416, 15–18.
13 Scorrano L, Petronilli V & Bernardi P (1997) On the
voltage dependence of the mitochondrial permeability
transition pore. A critical appraisal. J Biol Chem 272,
12295–12299.
14 Kowaltowski AJ, Castilho RF & Vercesi AE (1996)
Opening of the mitochondrial permeability transition
pore by uncoupling or inorganic phosphate in the
presence of Ca
2+
is dependent on mitochondrial-
generated reactive oxygen species. FEBS Lett 378,
150–152.
15 Budd SL & Nicholls DG (1996) A reevaluation of the
role of mitochondria in neuronal Ca
2+
homeostasis.
J Neurochem 66, 403–411.
16 Nicholls DG & Ward MW (2000) Mitochondrial
membrane potential and neuronal glutamate excito-
toxicity: mortality and millivolts. Trends Neurosci 23,
166–174.
17 Buchet K & Godinot C (1998) Functional F1-ATPase is
essential in maintaining growth and membrane potential
of human mitochondrial DNA-depleted q
o
cells. J Biol
Chem 273, 22983–22989.
18 Skowronek P, Haferkamp O & Rodel G (1992) A fluor-
escence-microscopic and flow-cytometric study of HeLa
cells with an experimentally induced respiratory defi-
ciency. Biochem Biophys Res Commun 187, 991–998.
19 Peachman KK, Lyles DS & Bass DA (2001) Mitochon-
dria in eosinophils: functional role in apoptosis but not
respiration. Proc Natl Acad Sci USA 98, 1717–1722.
20 Diaz G, Liu S, Isola R, Diana A & Falchi AM (2003)
Mitochondrial localization of reactive oxygen species by
dihydrofluorescein probes. Histochem Cell Biol 120,
319–325.
Mitochondrial membrane potential fluctuations A. M. Falchi et al.
1658 FEBS Journal 272 (2005) 1649–1659 ª 2005 FEBS
21 Diaz G, Diana A, Falchi AM, Gremo F, Pani A, Batet-
ta B, Dessi S & Isola R (2001) Intra- and intercellular
distribution of mitochondrial probes and changes after
treatment with MDR modulators. IUBMB Life 51,
121–126.
22 Aon MG, Cortassa S, Marba
´
n E & O’Rourke B (2003)
Synchronized whole cell oscillations in mitochondrial
metabolism triggered by a local release of reactive oxy-
gen species in cardiac myocytes. J Biol Chem 278,
44735–44744.
23 Duchen MR (1992) Ca
2+
-dependent changes in the
mitochondrial energetics in single dissociated mouse
sensory neurons. Biochem J 283, 41–50.
24 Rizzuto R, Bastianutto C, Brini M, Murgia M & Poz-
zan T (1994) Mitochondrial Ca
2+
homeostasis in intact
cells. J Cell Biol 126, 1183–1194.
25 Hajnoczky G, Robb-Gaspers LD, Seitz MB & Thomas
AP (1995) Decoding of cytosolic calcium oscillations in
the mitochondria. Cell 82, 415–424.
26 Amchenkova AA, Bakeeva LE, Chentson YS, Skula-
chev VP & Zorov DB (1998) Coupling membranes as
energy-transmitting cables. I. Filamentous mitochondria
in fibroblasts and mitochondrial clusters in cardiomyo-
cytes. J Cell Biol 107, 481–495.
27 Skulachev VP (2001) Mitochondrial filaments and clus-
ters as intracellular power-transmitting cables. Trends
Biochem Sci 26, 23–29.
28 Salet C, Moreno G, Ricchelli F & Bernardi P (1997)
Singlet oxygen produced by photodynamic action causes
inactivation of the mitochondrial permeability transition
pore. J Biol Chem 272, 21938–21943.
29 Moreno G, Poussin K, Ricchelli F & Salet C (2001)
The effects of singlet oxygen produced by photodynamic
action on the mitochondrial permeability transition dif-
fer in accordance with the localization of the sensitizer.
Arch Biochem Biophys 386, 243–250.
30 Jacobson J & Duchen MR (2002) Mitochondrial oxida-
tive stress and cell death in astrocytes: requirement for
stored Ca
2+
and sustained opening of permeability
transition pore. J Cell Sci 115, 1175–1188.
31 Brady NR, Elmore SP, van Beek JJHGM, Krab K,
Courtoy PJ, Hue L & Westerhoff HV (2004) Coordi-
nated behavior of mitochondria in both space and time:
a reactive oxygen species-activated wave of mitochon-
drial depolarization. Biophys J 87, 2022–2034.
32 Ichas F, Jouaville LS & Mazat JP (1997) Mitochondria
are excitable organelles capable of generating and con-
veying electrical and calcium signals. Cell 89, 1145–
1153.
33 Duchen MR, Leyssens A & Crompton M (1998)
Transient mitochondrial depolarizations reflect focal
sarcoplasmic reticular calcium release in single rat
cardiomyocytes. J Cell Biol 142, 975–988.
34 Ichas F & Mazat JP (1998) From calcium signaling to
cell death: two conformations for the mitochondrial per-
meability transition pore. Switching from low- to high-
conductance state. Biochim Biophys Acta 1366, 33–50.
35 Duchen MR (2000) Mitochondria and calcium: from
cell signalling to cell death. J Physiol 529 Part 1, 57–68.
36 Rizzuto R, Bernardi P & Pozzan T (2000) Mitochondria
as all-round players of the calcium game. J Physiol 529
Part 1, 37–47.
37 Bernardi P, Scorrano L, Colonna R, Petronilli V & Di
Lisa F (1999) Mitochondria and cell death. Mechanistic
aspects and methodological issues. Eur J Biochem 264,
687–701.
38 Votyakova TV & Reynolds IJ (2001) Dw
m
-Dependent
and -independent production of reactive oxygen species
by rat brain mitochondria. J Neurochem 79, 266–277.
39 Cha
´
vez E, Zazueta C, Correa F, Garcı
´
a N, Avile
´
sC,
Robles SG & Rodrı
´
guez CD (2002) Modulation by sub-
strates of the protective effect of cyclosporin A on mito-
chondrial damage. Life Sci 70, 2413–2420.
Supplementary material
The following material is available from http://www.
blackwellpublishing.com/products/journals/suppmat/EJB/
EJB4586/EJB4586sm.htm
Fig. S1. Ca
2+
changes induced by ATP stimulation.
Calcium Green-1 showed cyclic and simultaneous
Ca
2+
oscillations in the nucleus and cytoplasm of
HeLa cells stimulated with 20 lm ATP. The top panel
shows a group of five cells observed at different times.
Bar is 10 lm. The plot shows data of a representative
cell, sampled at the rate of 1 frameÆs
)1
.Ca
2+
oscilla-
tions exhibit a period of 12.5 s (indicated by vertical
lines), which is independent of the amplitude. The time
of ATP treatment is indicated by the arrow.
FEBS Journal 272 (2005) 1649–1659 ª 2005 FEBS 1659
A. M. Falchi et al. Mitochondrial membrane potential fluctuations