Báo cáo khoa học: On the mechanisms of glycolytic oscillations in yeast potx
Bạn đang xem bản rút gọn của tài liệu. Xem và tải ngay bản đầy đủ của tài liệu tại đây (346.66 KB, 13 trang )
On the mechanisms of glycolytic oscillations in yeast
Mads F. Madsen
1
, Sune Danø
2
and Preben G. Sørensen
1
1 Functional Dynamics Group, Department of Chemistry, University of Copenhagen, Denmark
2 Department of Medical Biochemistry and Genetics, University of Copenhagen, Denmark
Autonomous oscillations in the concentrations of gly-
colytic intermediates reflect the dynamics of control
and regulation of this major catabolic pathway, and
the phenomenon has been reported in a broad range
of cell types [1–6]. Understanding glycolytic oscilla-
tions might therefore prove crucial for our general
understanding of the regulation of metabolism and the
interplay among different parts of metabolism as illus-
trated by the hypothesis that glycolytic oscillations
play a role in complex pulsatile insulin secretion [7].
The key question in this context is the mechanism(s) of
the oscillations, but despite much work over the last
40 years it remains unsettled.
Here we address this question for the particular case
of yeast. We focus on the yeast systems as these are
particularly well studied; as such they can be seen as
prototypes of glycolytic oscillations (recently reviewed
in [8,9]). Our approach emphasizes the general
dynamic properties of the oscillations. This leads us to
analyse the cases of extracts and intact cells separately.
With this starting point we can utilize our recently
developed theoretical tools in the analyses [10]. The
advantages are that more experimental data can be
included in the analyses, and that these are carried out
on a rigorous mathematical basis. In short, we answer
two related questions in this work: ‘what is the mech-
anism of glycolytic oscillations in yeast extracts?’ and
‘what is the mechanism of glycolytic oscillations in
intact yeast cells?’
Dynamic properties of glycolytic
oscillations
Glycolytic oscillations are recorded as time traces of
NADH fluorescence [11]. Yeast extracts readily exhibit
oscillations, either upon administration of trehalose,
Keywords
glycolysis; Hopf bifurcation; metabolic
control analysis; oscillations; oscillophore
Correspondence
S. Danø, Department of Medical
Biochemistry and Genetics, University of
Copenhagen, Blegdamsvej 3b,
2200 Copenhagen N, Denmark
Fax: +45 35 35 63 10
Tel: +45 35 32 77 53
E-mail:
(Received 6 October 2004, revised 28
February 2005, accepted 2 March 2005)
doi:10.1111/j.1742-4658.2005.04639.x
This work concerns the cause of glycolytic oscillations in yeast. We analyse
experimental data as well as models in two distinct cases: the relaxation-
like oscillations seen in yeast extracts, and the sinusoidal Hopf oscillations
seen in intact yeast cells. In the case of yeast extracts, we use flux-change
plots and model analyses to establish that the oscillations are driven by
on ⁄ off switching of phosphofructokinase. In the case of intact yeast cells,
we find that the instability leading to the appearance of oscillations is
caused by the stoichiometry of the ATP-ADP-AMP system and the
allosteric regulation of phosphofructokinase, whereas frequency control is
distributed over the reaction network. Notably, the NAD
+
⁄ NADH ratio
modulates the frequency of the oscillations without affecting the instability.
This is important for understanding the mutual synchronization of oscilla-
tions in the individual yeast cells, as synchronization is believed to occur
via acetaldehyde, which in turn affects the frequency of oscillations by
changing this ratio.
Abbreviations
ACA, acetaldehyde; ADH, alcohol dehydrogenase; AK, adenylate kinase; ALD, aldolase; CSTR, continuous-flow stirred tank reactor; DHAP,
dihydroxyacetone phosphate; F6P, fructose 6-phosphate; FBP, fructose 1,6-bisphosphate; G6P, glucose 6-phosphate; GAP, glyceraldehyde
3-phosphate; GAPDH, glyceraldehyde-3-phosphate dehydrogenase; HK, hexokinase; PFK, phosphofructokinase-1; PGI, phospho-
glucoisomerase; PK, pyruvate kinase; Pyr, pyruvate; TIM, triosephosphate isomerase.
2648 FEBS Journal 272 (2005) 2648–2660 ª 2005 FEBS
which is slowly degraded to glucose, or when fed with
a constant inflow of glucose or fructose. The generic
type of oscillations in yeast extracts is relaxation oscil-
lations, i.e. the cycle is composed of short time inter-
vals where the NADH level changes fast, and long
time intervals with slow changes (Fig. 2, [12]) for a
typical example. Other types of oscillations have also
been observed, e.g. sinusoidal, period-doubled or cha-
otic oscillations [13,14], but these are rare special cases.
Therefore, we focus on relaxation-like oscillations for
the case of yeast extracts. From the point of view of
nonlinear dynamics, such oscillations indicate that the
system is composed of processes taking place on dis-
tinct fast and slow time-scales. It is sometimes – but
not always – possible to identify these separate proces-
ses in mechanistic terms: in the case of a dripping
water tap, the slow time-scale corresponds to the grow-
ing droplet, and the fast time-scale corresponds to the
actual drip of the drop. In the case of yeast extracts,
we will show below that the slow time-scale corres-
ponds to removal of the allosteric phosphofructo-
kinase-1 (PFK) inhibitor ATP and ⁄ or build-up of its
allosteric activator AMP and its substrate fructose
6-phosphate (F6P), whereas the fast time-scale corres-
ponds to bursts of PFK activity.
The oscillations seen in suspensions of intact yeast
cells have smaller relative amplitude than those seen in
extracts, and the shape is almost sinusoidal. This holds
for oscillations in single yeast cells as well [15]. Relaxa-
tion-like oscillations have never been observed. (The
spiked oscillations reported in [16] is an artefact [17].)
In previous experimental work, we have character-
ized the oscillatory dynamics of yeast cell suspensions,
and we found that the yeast cells behave according to
the universal dynamics of systems close to a supercriti-
cal Hopf bifurcation [18]. In this context, universality
means that the laws governing the time-evolution of
any system in the neighbourhood of such a bifurcation
are the same; system specificity is reflected by differ-
ences in parameters.
The physical basis for this universality is the separ-
ation of time-scales in the neighbourhood of bifurca-
tions. For the supercritical Hopf bifurcation, these
laws dictate that the unperturbed system moves on a
small-amplitude limit cycle, which, essentially, is con-
fined to a two-dimensional plane. Accordingly, the per-
sistent behaviour of the system can be described by
just two variables, which can be viewed as an activa-
ting and an inhibiting mode. We have shown experi-
mentally that yeast cell suspensions behave according
to these laws (Fig. 10 of [19]).
The two-dimensional plane of the limit cycle is
embedded in the high-dimensional concentration space
describing the state of the cell in terms of all relevant
metabolite concentrations. Despite the high dimension
of concentration space, we show below that, in the
specific case of glycolytic oscillations in intact yeast
cells, it is possible to identify these two Hopf modes
with two small sets of metabolites.
Proposed mechanisms of glycolytic
oscillations
The emergence and properties of glycolytic oscillations
have been discussed previously along four major lines:
(a) allosteric control of PFK; (b) distributed control of
oscillations; (c) hexose transport kinetics and (d) ATP
autocatalysis due to the stoichiometry of glycolysis.
PFK kinetics
In early analyses, PFK with its allosteric regulation [in
particular substrate inhibition by ATP and product
activation by AMP and fructose 1,6-bisphosphate
(FBP)] was pointed out as the source of the oscilla-
tions and termed ‘the oscillophore’ [1,20]. The analysis
of these early observations, as well as a substantial
amount of additional experimental evidence supporting
the conclusion, is summarized in section 2.1 of [21]
(see also [22–25]). The basis for this conclusion is a
special application of the crossover theorem [26],
where enzymatic control points of oscillatory glycolysis
are identified as being those enzymes with the largest
phase-shift between substrates and products. From a
contemporary point of view, the theoretical motivation
for the application of the crossover theorem in the
analysis of glycolytic oscillations is weak [27].
Another argument in favour of the PFK hypothesis
is the fact that yeast extracts fed with the PFK sub-
strate F6P can show oscillations, whereas oscillations
have not been observed when extracts are fed with the
PFK product FBP. While this shows that PFK is
indeed important for glycolytic dynamics, it is not in
itself a proof that PFK is the primary cause of the
oscillations. It should be emphasized, though, that the
well-known allosteric regulations of PFK do provide a
mechanism by which its postulated role as oscillophore
can be explained [20,28,29].
Distributed control
One could expect that oscillations, fluxes and concen-
trations are systemic properties determined by the
interplay between the constituents of the biochemical
system. Hence, PFK is probably not the only part of
the network exerting control on its dynamic properties.
M. F. Madsen et al. Mechanisms of glycolytic oscillations
FEBS Journal 272 (2005) 2648–2660 ª 2005 FEBS 2649
Based on the phase angles of the glycolytic inter-
mediates in yeast extracts, Boiteux and Hess point to
pyruvate kinase (PK) and the enzyme pair phospho-
glycerate kinase and glyceraldehyde-3-phosphate dehy-
drogenase (GAPDH) as additional control points
conveying the adenine nucleotide signal from PFK to
other parts of the network [24]. As discussed below,
hexose transport kinetics and the glycolytic ATP stoi-
chiometry are also thought to be important in this
context. More recently, the redox feedback loop con-
stituted by the conserved sum of NAD
+
and NADH
has received some attention as it plays a key role in
the acetaldehyde (ACA) based mechanism believed to
be responsible for the active synchronization of the
oscillations among the individual yeast cells; ACA dif-
fuses freely in and out of the cells. Here it acts as
substrate for the alcohol dehydrogenase (ADH),
producing ethanol and oxidizing NADH to NAD
+
.
The altered NAD
+
⁄ NADH ratio then modulates the
phase of the oscillations via the GAPDH reaction
[30,31].
In an effort to quantify such considerations, West-
erhoff and coworkers have applied metabolic control
analysis (a form of sensitivity analysis) on a number of
mathematical models of glycolytic oscillations. They
conclude that the control of the oscillations is distri-
buted throughout the network [32–34]. The implication
is that the oscillations are a property of the entire net-
work, and that one cannot dissect the network and
identify the mechanism responsible for the oscillations.
Note, however, that all but one of the models investi-
gated in these studies are core models, which aim at
describing the ‘essential’ parts of the glycolytic oscilla-
tor. Hence, it may not be that surprising that all
components of these models are important for the
dynamics.
Hexose transport
Becker and Betz point to the hexose transport step as
an important control point of the oscillatory dynam-
ics, but still suggest PFK as the primary source of
the oscillations [35]. According to Reijenga et al.,
hexose transport has ‘most but not all’ control of the
dynamics [36]. The control coefficients determined in
that study can, however, be positive as well as negat-
ive (e.g. Fig. 3b), so one cannot judge the importance
of a single step from its control coefficient and a
summation theorem. Still, their experiments emphasize
and quantify the importance of hexose transport kin-
etics in the context of glycolytic oscillations.
The main role of hexose transport kinetics would be
to set the rate of substrate inflow for glycolysis.
Indeed, glucose transport is saturated in the experi-
ment by Reijenga et al., and the substrate inflow rate
is known to be an important effector of the dynamics
in yeast extracts [37].
Autocatalytic stoichiometry of ATP
The stoichiometry of glycolysis makes the pathway
autocatalytic in ATP, as two moles of ATP per mole
of glucose are consumed in the upper part of glyco-
lysis, yielding four moles of ATP in the lower part.
Indeed, Sel’kov and Aon et al. have proposed mod-
els for glycolytic oscillations based entirely on this
mechanism [38,39]. This is, however, not generally
considered the primary cause of glycolytic oscilla-
tions.
Results
Intact yeast cells: Hopf dynamics
Phase plane analysis of experimental data
Two complete experimental data sets on phases and
amplitudes of glycolytic metabolite oscillations in
intact yeast cells exist in the literature. When analysed
by means of polar phase plane plots, such data can
provide a biochemical interpretation of the underlying
dynamical structures. The analysis is briefly described
in Materials and methods.
In the study of Betz and Chance samples were
removed with a 5–6 s interval from a suspension of
glucose consuming Saccharomyces carlsbergensis which
showed damped oscillations upon the transition from
aerobic to anaerobic conditions [40]. The fluorescence
signal reflecting the NADH concentration was meas-
ured simultaneously. Data is available on the ampli-
tudes and phases of ATP, ADP, AMP, glucose
6-phosphate (G6P), F6P, FBP, dihydroxyacetone phos-
phate (DHAP), glyceraldehyde 3-phosphate (GAP)
and pyruvate (Pyr). The sampling covers the very first
one and a half cycles of oscillations emerging after the
transition to anaerobic conditions.
In the data set from Saccharomyces cerevisiae
reported by Richard et al., sampling was performed in
such a way that the initial transients following first
glucose addition (t ¼ 0 min) and subsequently cyanide
addition (t ¼ 4 min) had died out and the yeast cells
exhibited stable oscillations [41]. (Typically, sampling
was performed from t ¼ 9 min to t ¼ 11 min with a
sampling interval of 5 s.) Amplitudes and relative
phases were determined for G6P, F6P, FBP, ATP,
ADP, AMP, NADH, NAD
+
, extracellular ACA and
inorganic phosphate. The phosphate measurements,
Mechanisms of glycolytic oscillations M. F. Madsen et al.
2650 FEBS Journal 272 (2005) 2648–2660 ª 2005 FEBS
however, have not been included in our analysis as
they were made at 20 °C, whereas all other experiments
were performed at 25 °C. Measurements of fructose
2,6-bisphosphate, DHAP, GAP, 1,3-bisphosphoglycer-
ate, 3-phosphoglycerate, 2-phosphoglycerate, phospho-
enolpyruvate and Pyr were also performed, but these
metabolites did not show clear oscillations.
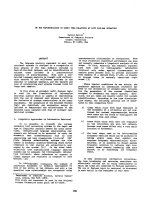
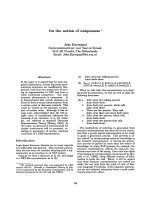
The polar phase plane plots of these two data sets
are shown in Fig. 1. Panels A–C are taken from [41]
and the remaining three panels show the data from
[40]. The data points are annotated in A and D, and
the two panel pairs B,E and C,F show two different
representations of the same data. In B, an % 90° struc-
ture is evident. As explained in Materials and methods,
this structure indicates that the system can be des-
cribed in terms of two interacting modes. The first
mode activates the second, and the second inhibits the
first. The activating mode is the abundance of AMP
and ADP, and scarcity of ATP (i.e. the minimum of
the ATP oscillation instead of the maximum), and the
inhibitory mode is abundance of FBP and scarcity of
G6P and F6P.
Biochemically, the activating mode corresponds to
low energy charge, and the inhibitory mode is high lev-
els of substrate for the lower part of glycolysis and
low levels for the upper part. The activation of this
mode by low energy charge can be explained as activa-
tion of PFK and inhibition of hexokinase (HK). The
inhibitory feedback is a consequence of the glycolytic
stoichiometry, where ATP is consumed in the upper
part of glycolysis and produced in the lower part.
Accordingly, the energy charge is increased when the
flux is increased in the lower part of glycolysis and
decreased in the upper.
The same phase plane structure is found in the data
set from Betz and Chance (panel E) [40], but an addi-
tional system involving DHAP and Pyr is seen as well,
and the ATP amplitude is markedly larger. Thus, the
oscillations seen in this experiment cannot be explained
solely in terms of PFK kinetics and the ATP-ADP-
AMP system. A possible explanation for this discrep-
ancy is the fact that the data from [40] were collected
immediately after the transition from aerobic to anaer-
obic metabolism. This is a large perturbation of the
cellular redox state, and DHAP and Pyr are located
at branch points in the reaction network where the
flux through the branches depend on the availability of
NADH (for the glycerol 3-phosphate dehydrogenase
reaction in the case of DHAP and for the ADH reac-
tion in the case of Pyr).
C and F show another possible interpretation of the
data; in this case the activating mode is abundance of
FBP and scarcity of G6P and F6P, and the inhibiting
mode is high energy charge. The activating and inhibit-
ing feedback can be explained by the same reasoning
as given for the interpretation in panels B and E; the
G6P
FBP
ATP
ADP
AMP
F6P
G6P
FBP
ATP
ADP
AMP
F6P
DHAP
GAP
Pyr
ABC
FED
Fig. 1. Experimental polar phase plane plots. (A–C) Data from [41]. (D–F) Data from [40]. A and D are the relative phases and amplitudes
plotted with annotations showing the major components. Apart from these, A also contains data on NAD
+
, NADH and extracellular ACA,
which all have very low amplitudes. In the remaining four panels, some metabolite phases have been flipped 180°, now indicating the relat-
ive phases of the minima instead of the maxima of their oscillations. This is shown by a s in the plots. (G6P, F6P and ATP have been
flipped in B and E, and in C and F, AMP, ADP, G6P and F6P have been flipped.) The rotation of the plots are the same in panels A, B, D,
and E, whereas panels C and F have been rotated 90° clockwise. All amplitudes are relative to the FBP amplitude. See text for discussion
and interpretation.
M. F. Madsen et al. Mechanisms of glycolytic oscillations
FEBS Journal 272 (2005) 2648–2660 ª 2005 FEBS 2651
comments regarding DHAP and Pyr in the dataset
from [40] apply equally well. This holds for other poss-
ible interpretations as well.
To conclude, we note that the 90° structure of the uni-
versal Hopf dynamics is reflected in the biochemical
phase plane plot with a limited number of components
in each of the two modes. In particular, this holds for
the data set from yeast cells showing stable oscillations
where initial transients have died out [41]. The biochemi-
cal interactions among these modes can be explained in
terms of the known allosteric regulation of PFK, and the
ATP-ADP-AMP stoichiometry of the glycolytic system.
Analysis of a model describing oscillations in intact cells
Our full-scale model of glycolysis was developed with
the intention of reproducing as many experimental find-
ings as possible [19]. In particular, the model shows
oscillations and possesses a supercritical Hopf bifurca-
tion. The model is analysed in the form described in [19].
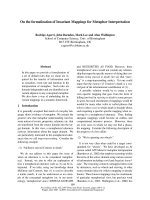
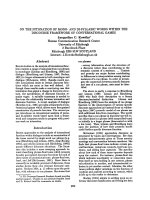
Figure 2 shows a polar phase plane plot of this
model at the supercritical Hopf bifurcation found at a
mixed flow glucose concentration of 18.5 mm [19]. The
G6P phase is not entirely correct in the model but the
phase plane plot is similar to the experimental phase
plane plots; in particular that obtained from yeast cells
showing stable oscillations [41]. Figure 2B shows the
same interpretation as in Fig. 1B,E, and the conclusion
is the same: the oscillations can be understood largely
in terms of two modes composed of a well-defined
subset of metabolites, and the inhibition or activation
among these two modes can be explained in terms of
(a) PFK kinetics modelled by:
t ¼
V
max
½F6P
2
K 1 þj
½ATP
2
½AMP
2
þ½F6P
2
;
and (b) the ATP-ADP-AMP system and the network
structure.
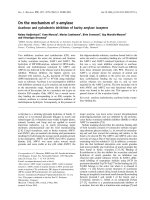
The results of the sensitivity analysis (Materials and
methods) at super-critical Hopf bifurcations, i.e. calcu-
lations of C
x
lc
p
(Eqn 3) and r
0
p
(Eqn 4) in the same
bifurcation point, is shown in Fig. 3.
Figure 3A shows that the stability of the stationary
state is controlled by PFK and by the ATP-ADP-
AMP system through its interactions with HK, glyco-
gen formation and unspecific ATP consumption. PFK
tends to make the system more unstable, whereas ATP
consuming processes stabilize the system.
In contrast to this rather simple picture, Fig. 3B
shows that several control systems affect the frequency
G6P
FBP
ATP
ADP
AMP
DHAP
Pyr
AB
Fig. 2. Polar phase plane plots of the model by Hynne et al.[19].
(A) Annotations of the major components. (B) Interpretation of the
data discussed in the text. In this panel, the phases of ATP and
G6P have been flipped 180°, indicating the relative phases of the
minima of their oscillations. This is shown by a s in the plot. The
rotation of the plots are the same in the two panels, and ampli-
tudes have been scaled such that FBP has full amplitude. Calcula-
tions are performed at the Hopf bifurcation described in [19]. See
text for discussion.
σ’ / min
−1
p
| |
C
p
ω
lc
| |
2
a
| |
Γ
p
/ mM
2
0
2
4
6
8
10
12
14
16
GlcTrans
HK
glycogen
PGI
PFK
ALD
TIM
glycerol
GAPDH
lpPEP
PK
PDC
ADH
difGlyc
difACA
difEtOH
AK
ATPase
lacto
k0
0
10
20
30
40
50
0
0.2
0.4
0.6
0.8
1
1.2
GlcTrans
HK
glycogen
PGI
PFK
ALD
TIM
glycerol
GAPDH
lpPEP
PK
PDC
ADH
difGlyc
difACA
difEtOH
AK
ATPase
lacto
k0
A
B
Fig. 3. Sensitivity analysis at the Hopf bifurcation of the model by
Hynne et al. [19]. (A) Relative change of stability with V
max
or
mass-action rate constants for all reactions (Eqn 4). (B) Frequency
control coefficients on the emerging limit cycle (Eqn 3). For reversi-
ble reactions, the coefficients for the forward and the reverse reac-
tions are added in order to reflect the effect of increasing the
enzyme concentration. Black bars represent positive values, and
white bars represent negative. Calculations are performed at the
Hopf bifurcation described in [19]. GlcTrans, glucose transporter;
Glycogen, glycogen branch; glycerol, glycerol branch; lpPEP,
lumped phosphoglycerate kinase, phosphoglycerate mutase, and
enolase reactions; PDC, pyruvate decarboxylase; difGlyc, glycerol
diffusion; difACA, ACA diffusion; difEtOH, ethanol diffusion; lacto,
lactonitrile formation; k-
0
, specific flow of the CSTR.
Mechanisms of glycolytic oscillations M. F. Madsen et al.
2652 FEBS Journal 272 (2005) 2648–2660 ª 2005 FEBS
of oscillation. Equation 3 (Materials and methods)
shows that frequency control is the sum of a r
0
p
term
and a r
00
p
term. Therefore, it is generally expected that
reactions with substantial control of stability (i.e. a
numerically large r
0
p
) will also control frequency. The
remaining reactions with frequency control (i.e. those
that have a numerically large r
00
p
) are GAPDH, ADH,
glycerol formation, and the specific flow of the con-
tinuous-flow stirred tank reactor (CSTR). Apart from
the mechanical flow, these are all part of the NAD
+
⁄
NADH feedback system, so this control system affects
the frequency of the oscillations without affecting the
stability of the reaction system.
Yeast extracts: Relaxation dynamics
Estimation of flux changes from experimental data
In the analysis of relaxation-like oscillations, one is
looking for separate processes being turned on and off
on long and short time-scales. On ⁄ off switching can be
revealed by plotting the ratio of the velocity change
across a period relative to the minimum velocity within
the oscillatory cycle as described in the Materials and
methods section. Using amplitude and phase informa-
tion from [12] and flux information from [22] we have
assembled the experimental flux-change diagram shown
in Fig. 4. It shows very large flux changes for phos-
phoglucoisomerase (PGI) and PFK as well as for the
ATPase reaction also reported to be active in these
yeast extracts. All other reactions show flux changes
that are substantially smaller. This result is in good
agreement with the PFK hypothesis for glycolytic
oscillations. (The flux changes of PGI can be assumed
driven by those of PFK.)
Comparison with the nine-variable model
by Wolf et al.
The PFK hypothesis for yeast extracts is further sub-
stantiated by comparison with the model for glycolytic
oscillations presented in [31]. (Here this model is ana-
lysed at the point defined by Table 1 of [31] with the
additional condition k
9
¼ 80 min
)1
; this point is the
same point as that analysed in [33].) Originally, this
model was intended to model oscillations in intact yeast
cells but, from the point of view of nonlinear dynamics,
the model behaves more like oscillating yeast extracts;
the oscillations are relaxation-like, and the model does
not possess the supercritical Hopf bifurcation found in
oscillating yeast cells (instead, a subcritical Hopf bifur-
cation is found at the onset of oscillations). Most
importantly, the flux-change diagram in Fig. 5 shows
good – although not quantitative – agreement with the
diagram based on experimental data (Fig. 4). In this
model the HK, PGI and PFK reactions are combined in
one reaction; the large flux-change of the HK-PFK reac-
tion corresponds to the large PGI flux change and the
even larger PFK flux change seen experimentally.
The HK-PFK reaction is modelled by the highly
nonlinear kinetics
v ¼ k
1
;
½Glc½ATP
1 þ
½ATP
K
i
n
; n ¼ 4:
∆
j
r
0
1
2
3
4
5
6
7
HK
PGI
PFK
ALD
TIM
glycerol
GAPDH
PGM
ENO
PK
PDC
ADH
ATPase
Glc in
Fig. 4. Relative flux changes in yeast extract experiments. For each
reaction, the flux change designates the ratio of the change of flux
across a period relative to the minimum flux in the oscillatory cycle.
Calculations are based on experimental amplitude and phase data
from [12] and experimental flux data from [22]. Sinusoidal oscilla-
tions are assumed. Glc in, glucose inflow; glycerol, glycerol branch;
PGM, phosphoglycerate mutase; ENO, enolase; PDC, pyruvate de-
carboxylase.
∆
j
r
0
2
4
6
8
10
12
Glc in
HK−PFK
ALD
glycerol
GAPDH−PGK
PK
PDC
ADH
difACA
outACA
ATPase
Fig. 5. Relative flux changes in the nine-variable model by Wolf
et al. [31]. For each reaction, the flux change designates the ratio
of the change of flux across a period relative to the minimum flux
in the oscillatory cycle. Compare with the experimental data in
Fig. 4. Glc in, glucose inflow; HK-PFK, lumped HK, PGI and PFK;
glycerol, glycerol branch; GAPDH-PGK, lumped GAPDH, phospho-
glycerate kinase, phosphoglycerate mutase and enolase reactions;
PDC, pyruvate decarboxylase; difACA, ACA diffusion; outACA, ACA
removal (including lactonitrile formation).
M. F. Madsen et al. Mechanisms of glycolytic oscillations
FEBS Journal 272 (2005) 2648–2660 ª 2005 FEBS 2653
The reaction velocity, v depends strongly on the ATP
concentration, with the maximum K
i
ffiffiffi
3
4
p
for n ¼ 4
and fixed glucose concentration. This is close to the
minimum ATP concentration encountered during the
oscillations. At the maximum concentration, the reac-
tion velocity, calculated for a fixed glucose concentra-
tion, is an order of magnitude lower. Hence, the large
variation in PFK flux is due to its regulation by ATP.
The ATPase reaction is modelled by simple mass-
action kinetics, so the variation in the ATPase velocity
reflects a proportional variation in [ATP].
Inspection of the time traces in Fig. 6 reveals that
the fast time-scale corresponds to turning on the
HK-PFK reaction, whereas the ATPase reaction, the
glucose accumulation and the breakdown of triose-
phosphates are associated with the slow time scale.
When HK-PFK is turned on by low [ATP], a burst of
triose phosphates is produced. The lower part of glyco-
lysis produces ATP from the triose phosphates, and
the HK-PFK reaction is shut down again. In this state
of the reaction system, ATP is consumed by the
ATPase reaction, and at some point [ATP] becomes so
low that HK-PFK is turned on again. This causes an
additional decrease in [ATP] because the HK–PFK
reaction consumes ATP itself.
The results of our modified metabolic control analy-
sis are shown in Fig. 7; as is custom, we have only cal-
culated the control exerted by net velocity parameters.
The results are in good agreement with those given in
Table 6 of [33]. Among the velocity parameters, the
amplitude of the oscillations are mainly controlled by
glucose inflow followed by ATPase activity. The velo-
city parameters of the remaining reactions – including
PFK – exert only little control. The same conclusions
hold for frequency control.
These results might seem to contradict the flux-change
results, which point to HK-PFK as the central part of
the oscillatory mechanism in extracts. A closer inspec-
tion of the problem, however, reveals that all of the
above results are in mutual agreement. The reason why
only a minor fraction of control resides with the ‘oscillo-
phore reaction’ is due to the on ⁄ off nature of the oscilla-
tions; it is the regulation of the HK-PFK reaction by
ATP that is important for the occurrence of oscillations,
not its V
max.
This notion can be quantified by calcula-
ting, for example, C
a
2
p
for all parameters in the model
and not only the velocity parameters. When we do this,
we find that n is the parameter with the largest magni-
tude of C
a
2
p
(C
a
2
n
¼ 37.8 mm
2
), followed by the other
0
1
2
3
4
5
6
7
0 0.05 0.1 0.15 0.2
0
50
100
150
200
250
300
concentration / mM
v
PFK
/ (mM min
-1
)
time / min
v
PFK
[Glc]
[ATP]
[Triose-P]
Fig. 6. Relaxation-like oscillations in the nine-variable model by Wolf
et al. [31]. Triose-P is triose phosphate, i.e. the sum of GAP and
DHAP.
a
2
| |
2
Γ / mM
p
0
5
10
15
20
25
HK−PFK
ALD
glycerol
GAPDH−PGK
PK
PDC
ADH
difACA
outACA
ATPase
Glc in
C
p
ω
lc
| |
0
0.2
0.4
0.6
0.8
1
1.2
1.4
1.6
1.8
Glc in
ALD
glycerol
GAPDH−PGK
PK
PDC
ADH
difACA
outACA
ATPase
HK−PFK
A
B
Fig. 7. Modified metabolic control analysis on the limit cycle of the
nine-variable model by Wolf et al.[31]. (A) C
a
2
p
calculations accord-
ing to Eqn (2). (B) C
x
lc
p
calculations according to the standard defini-
tion of control coefficients. For reversible reactions, the coefficients
for the forward and the reverse reactions are added in order to
reflect the effect of increasing the enzyme concentration. Black
bars represent positive values, and white bars represent negative
values. Glc in, glucose inflow; HK-PFK, lumped HK, PGI and PFK;
glycerol, glycerol branch; GAPDH-PGK, lumped GAPDH, phospho-
glycerate kinase, phosphoglycerate mutase and enolase reactions;
PDC, pyruvate decarboxylase; difACA, ACA diffusion; outACA, ACA
removal (including lactonitrile formation).
Mechanisms of glycolytic oscillations M. F. Madsen et al.
2654 FEBS Journal 272 (2005) 2648–2660 ª 2005 FEBS
PFK parameter K
i
with C
a
2
K
i
¼ )33.7mm
2
. These values
are directly comparable to those of Fig. 7; the remaining
values are C
a
2
A
tot
¼ 12.1mm
2
and C
a
2
N
tot
¼ 2.6mm
2
.
With this in mind, we can use the on ⁄ off switching
of PFK to rationalize the results in Fig. 7. Increased
ATPase activity shortens the time needed to remove
the ATP produced during the previous spike; hence it
increases the frequency and decreases the amplitude.
Increased glucose inflow results in a higher glucose
concentration before the spike and consequently in the
production of more ATP, which takes longer time to
remove. Therefore, the frequency decreases and the
amplitude increases. In other models (e.g. Nielsen et al.
[14] discussed below) and in experiments [37] the influ-
ence of the substrate concentration may outbalance
the influence of ATP on PFK activation, resulting in a
frequency increase with glucose inflow. The redox state
influences the frequency also by changing how much
of the triose phosphates are used to produce ATP in
the lower part of glycolysis, and how much is used to
produce glycerol without ATP production. This effect
explains the signs of the frequency control coefficients
for ADH, GAPDH and glycerol production.
The seven-variable model in [42] is similar to that
analysed here, and our analysis of it leads to the same
conclusions (results not shown).
Comparison with the extract model by Nielsen et al.
The yeast extract model of Nielsen et al. describes
an ATPase-free yeast extract in a CSTR [14]. At the
operating point defined by the specific flow k
0
¼
1.1 · 10
)2
min
)1
(Fig. 9d in [14]) the model shows relax-
ation-like oscillations; we will briefly summarize its ana-
lysis at this operating point as it shows good agreement
with many features of yeast extract oscillations. The rel-
ative phases of ATP, ADP, AMP, Pyr and ACA and of
F6P, FBP and GAP are in agreement with the experi-
ments reported in [22], whereas the relative phases of
phosphoenolpyruvate and NAD
+
⁄ NADH are not. The
model can also account for the perturbation experiments
and bifurcation experiments described in [14]. (The
model is analysed as described in that paper, apart from
the corrections that the unit of time is in min and
V
4m
¼ 10 mmÆmin instead of 20 mmÆmin
)1
.)
Flux-change analysis of the model (data not shown)
shows that PFK has a relative flux-change of 32. This
is an order of magnitude larger than any of the other
reactions, as expected for an ATPase-free version of
Fig. 4. Figure 8 shows the on ⁄ off switching of PFK.
In this model it is caused mainly by the AMP
activation of PFK and, to a smaller extent, by F6P
activation and ATP inhibition. In accordance with the
flux-change analysis, we find no other reactions exhib-
iting such an on ⁄ off switching.
Discussion
The mechanism of glycolytic oscillations
in intact yeast cells
In the case of intact yeast cells, we are close to a
supercritical Hopf bifurcation, and this provides a
mathematical framework for our analysis. Both the
experimental and model-based analyses by means of
polar phase plane plots, and the model-based sensitiv-
ity analysis of stability (amplitude) point towards the
ATP-ADP-AMP system and the allosteric regulation
of PFK as key elements responsible for the occurrence
of the instability. The frequency control analysis of the
model shows that the frequency of oscillation is con-
trolled by a larger set of control systems, including the
redox feedback system. Thus, for intact yeast cells we
conclude that frequency control is distributed through-
out large parts of the network, whereas the instability
of the stationary state originates from PFK and the
ATP-ADP-AMP system.
The mechanism of glycolytic oscillations
in yeast extracts
In the case of yeast extracts exhibiting relaxation-like
oscillations – which is by far the most common type of
oscillations observed with yeast extracts – we have
identified the fast time-scale as on ⁄ off switching of
PFK. This finding holds for both experimentally and
model-derived data. The phenomenon is caused by
AMP activation and ⁄ or ATP inhibition; we cannot tell
0
1
2
3
4
5
6
80 82 84 86 88 90 92 94 96
0
0.2
0.4
0.6
0.8
1
1.2
concentration / mM
v
PFK
/ (mM min
-1
)
time / min
v
PFK
[F6P]
[ATP]
250 · [AMP]
Fig. 8. Relaxation-like oscillations in the extract model by Nielsen
et al.[14]. Note that [AMP] has been multiplied by a factor of 250
in order to make it visible in the graph. See text for discussions.
M. F. Madsen et al. Mechanisms of glycolytic oscillations
FEBS Journal 272 (2005) 2648–2660 ª 2005 FEBS 2655
which of the two is most important as their effects are
dynamically equivalent.
In contrast to the case of intact yeast cells, we find
that the reactions controlling the frequency of the
relaxation oscillations are the same as those controlling
the amplitude. This indicates that the yeast extract
oscillations are governed entirely by the on ⁄ off switch-
ing of PFK.
One could argue that this supports the view that
PFK is the ‘oscillophore’ in yeast extracts. The network
structure is, however, also important as the on ⁄ off
switching occurs due to the interplay between the allo-
steric regulation of PFK and the ATP-ADP-AMP system.
Our analysis of relaxation oscillations is not as
sophisticated as that performed on Hopf oscillations,
as there is no underlying mathematical frame-work to
support the analysis. Lacking this, we cannot judge
whether the conclusions obtained for the case of Hopf
oscillations in intact yeast cells are also valid for the
case of yeast extracts. It is clear from the above discus-
sion, however, that the biochemical components that
are of most importance for the oscillations, are the
same in the two cases. Probably, the yeast cells are
always close to the Hopf bifurcation, simply because
the glycolytic flux cannot increase above a value deter-
mined by the saturation of the glucose membrane
transport system. (This view is consistent with a num-
ber of experimental observations, e.g. [18,35–37].)
Biochemical properties derived from Hopf
dynamics
Our use of polar phase plane plots to identify the bio-
chemical nature of the activating and inhibitory Hopf
modes is the first application of this method. The
analysis was performed directly on experimental data
without invoking prior knowledge of the reaction
network or its regulatory structure. As such, it is a top-
down approach well suited for high-throughput meth-
ods. The only restriction is that the system should be
close to a supercritical Hopf bifurcation. Of particular
interest for modelling, the clear biochemical identifica-
tion of the two Hopf modes provides experimental evi-
dence that a two-dimensional description of glycolysis
is sensible not only in terms of abstract Hopf dynamics
[19,43], but also in a biochemical formulation where
the two variables are energy charge and substrate for
either the upper or the lower part of glycolysis.
On the use of sensitivity analysis
When sensitivity analysis of relaxation oscillations is
restricted to velocity parameters (i.e. ‘enzyme activit-
ies’), we find that it will not necessarily be capable
of identifying reactions which control the dynamics
through their on ⁄ off switching. The reason for this is
that the important property of such an enzyme is its
regulation rather than its maximum velocity.
Summation theorems exist for the frequency control
coefficients calculated in metabolic control analysis,
but we find here that the coefficients are just as likely
to be negative as positive. Therefore, one cannot con-
clude from determination of one or a few coefficients
whether or not they signify a large share of frequency
control. Instead, the interesting feature is the relative
sizes of the coefficients. This situation differs from that
encountered in the common use of metabolic control
analysis, where flux-control coefficients are measured.
Here, the usual case is that increasing an enzyme activ-
ity results in increased flux, and hence flux control
coefficients are confined to the interval between zero
and one except for a few special cases.
In the neighbourhood of a supercritical Hopf bifur-
cation, the mathematical framework provided by the
Hopf dynamics allows us to relate sensitivity analysis
and nonlinear dynamics. This leads to two important
findings. One is that control of amplitude is equivalent
to control of stability. The other is that the frequency
of the oscillations is generally modulated by a larger
part of the reaction network than is stability. This is
due to the fact that frequency control is the sum of the
r
0
p
and the r
00
p
contributions (Eqn 3), whereas the
control of stability is determined by r
0
p
only (Eqn 4).
Consequently, it does not make sense to look for an
‘oscillophore’ in the neighbourhood of a supercritical
Hopf bifurcation, if this is thought of as an enzyme
controlling both the frequency and amplitude of the
oscillations. It is expected that those components con-
trolling stability will generally also control frequency,
whereas the opposite is not the case. We have shown
that such components can be identified by means of
sensitivity analysis.
Cell synchronization
Frequency modulation is of primary importance for
the synchronization of the glycolytic oscillations
among the individual yeast cells [30,42–44]. In partic-
ular, the NAD
+
⁄ NADH feedback system will be of
primary importance for the cell-synchronization pro-
cess if the synchronization is mediated by ACA, as has
been suggested previously [30,45] (see also [46]). The
distributed control of frequency in yeast cells implies
that a core model is not well suited for a detailed study
of the synchronization problem. Instead, one needs
a full-scale model that has been carefully validated
Mechanisms of glycolytic oscillations M. F. Madsen et al.
2656 FEBS Journal 272 (2005) 2648–2660 ª 2005 FEBS
against experimental data. If a simple description is
needed for the analysis, then such a model can be
reduced to the two-dimensional Hopf form, which
gives a quantitatively correct – albeit not ‘biochemi-
cally formulated’ – description of the dynamics [43].
At present, no full-scale model is capable of explaining
the synchronization of glycolytic oscillations. The
problem is apparently caused by wrong phase-relations
between acetaldehyde and the more central parts of
the oscillator [43].
Materials and methods
Modified metabolic control analysis of limit-cycle
oscillations
Metabolic control analysis is a systematic method for deter-
mining control strength. It is a variant of sensitivity analy-
sis where the effects of infinitesimal changes of parameters
are quantified. Originally, it was developed for studies of
flux control in enzymatic networks, and it has been used
previously in the analysis of models describing glycolytic
oscillations [32–34]. The control coefficient
C
X
p
¼
@X
=
X
@p
=
p
¼
@ ln X
@ ln p
ð1Þ
describes the control of a parameter p on a property X.
(Strictly speaking, the term ‘control coefficient’ is only used
when p is an enzyme activity; e.g. [47].) We want to discuss
the control of the oscillations, so the natural choice of
properties is frequency and amplitude of the oscillations.
For the sake of simplicity, it is custom to restrict the ana-
lysis to the velocity parameters (i.e. rate constants and V
max
parameters) of the rate expressions of the various reactions.
In the case of reversible reactions, we just consider the sum
of the control coefficients of the forward and reverse reac-
tions. This has the additional advantages that each reaction
has exactly one associated control coefficient, and that sum-
mation theorems based on time scaling invariance can be
applied: increasing all velocity parameters (including the
specific flow rate k
0
of the reactor) by a factor f is equival-
ent to rescaling the time as this changes all time constants
of the equations by a factor f
)1
. Accordingly, stationary
state concentrations or the shape and size of a limit cycle
will not change. In terms of control coefficients, this means
that the control coefficients will sum to one if the system
property in question has units including time
)1
; if it has
units not including time, then their sum will be zero.
The control coefficients C
x
lc
p
for the frequency on the
limit cycle is calculated according to Eqn (1). The calcula-
tions for the amplitude of the limit cycle need some con-
sideration; we define the amplitude as the sum of half
the peak-to-peak amplitudes of each of the metabolites s:
a ¼
P
s
a
s
. Furthermore, we choose to calculate:
C
a
2
p
¼
@a
2
@p
=
p
ð2Þ
instead of amplitude control coefficients. This is done in
order to avoid the singularity, which would otherwise occur
at a Hopf bifurcation where the amplitude becomes zero
and the slope of the amplitude becomes infinite. Summation
theorems can still be derived as indicated above, because
we have retained the relative measure @p
=
p for changes in
the parameter value p.
Calculations of C
x
lc
p
and C
a
2
p
were performed with con-
tinuation methods using the program cont [48]. The
parameter point chosen for analysis is used as a starting
point for short-distance limit-cycle continuations with each
of the parameters in the analysis as continuation parameter.
Summation theorems were used to check the validity of the
calculations or, in some cases, to calculate the control coef-
ficients of a velocity parameter which could otherwise not
be calculated due to numerical difficulties. Customised perl
scripts were used to automate this process. This procedure
is more efficient and gives better numerical precision than
Fourier transform based techniques.
Modified metabolic control analysis at
supercritical Hopf bifurcations
We have shown recently that metabolic control analysis – in
a form modified to avoid singularities as indicated above –
can be related directly to the universal dynamics of systems
close to a supercritical Hopf bifurcation [10]. The frequency
control coefficient at the bifurcation point becomes:
C
x
lc
p
¼
dlnx
dln p
¼
1
x
0
r
00
p
À r
0
p
g
00
g
0
; ð3Þ
and the relative rate of change of stability, which is a scaled
measure of the change of the square of the amplitude, is
given by:
C
ReðkÞ
p
¼
dReðkÞ
d p
=
p
¼ r
0
p
: ð4Þ
In these equations, Re(k) is the real part of the bifurcating
eigenvalue, x
0
is the frequency of oscillations at the bifurca-
tion point, r
0
p
and r
00
p
characterize the rate of change of sta-
bility and frequency, respectively, when moving away from
the bifurcation point by increasing p. Here, ‘stability’ refers
to the stability of the stationary state which becomes unsta-
ble at the bifurcation point. Hence, a positive value of r
0
p
indicates that the system moves into the oscillatory region
if p is increased. The remaining two parameters g ¢ and g¢¢
characterize the nonlinearity that stabilizes the emerging
limit cycle; these parameters are independent of the choice
of p.
A measure similar to Eqn (4) has been introduced previ-
ously [49]; the present measure has the advantage that the
singularity at the bifurcation point is avoided.
M. F. Madsen et al. Mechanisms of glycolytic oscillations
FEBS Journal 272 (2005) 2648–2660 ª 2005 FEBS 2657
For a given Hopf bifurcation point, we use mathematica
(Wolfram Research, Inc., Champaign, IL, USA) to calcu-
late sets of Stuart–Landau parameters (i.e. r
0
p
, r
00
p
,g¢ and
g¢¢) according to the formulae given in [50]. Each set corres-
ponds to choosing one of the parameters as bifurcation
parameter.
Construction of flux-change plots
Flux-change plots are used for identifying reactions exhibit-
ing on ⁄ off characteristics. We define the flux change of a
reaction as the change in flux across the period of oscilla-
tions relative to its minimum flux:
Dj
r
¼
j
max
À j
min
j
min
This measure can be obtained from concentration time
traces and a subset of in-and effluxes.
By working inwards along each branch of the network,
we derive the fluxes through the individual reactions. The
data given in [12,22] are sufficient for calculating flux chan-
ges for yeast extracts. As only phase and amplitude data
are available, we model concentration time traces as sinu-
soidal oscillations. This approximation softens the edges of
the relaxation-like oscillations. Although this underesti-
mates the flux change coefficients, the overall picture is pre-
served.
The HK flux change is uniquely determined by the sub-
strate injection rate and the glucose time trace. The PGI
flux change is given by the HK flux, glycerol production
and the G6P time trace. Including the F6P time trace, this
also determines the PFK flux-change. The fluxes of the
reactions from ADH to GAPDH are determined accord-
ingly. GAPDH, glycerol production and the time traces of
GAP and DHAP determine aldolase (ALD) and triosephos-
phate isomerase (TIM) flux changes. The ATPase flux
change is calculated from the fluxes of all ATP or ADP
consuming reactions, and the time trace of ATP. The ade-
nylate kinase (AK) flux change is determined trivially from
the ATP and ADP time traces.
Analysis by means of polar phase plane plots
Due to universality of the dynamics of systems close to
supercritical Hopf bifurcations, it is possible to infer bio-
chemical function from measurements of dynamic properties
close to such a bifurcation. It can be shown that, from a
dynamic point of view, such systems are composed of only
two interacting modes. The properties of these modes are so
that one mode activates the other, while the other inhibits
the first. The occurrence of the maxima of these two modes
is separated in time by one quarter of the period of oscilla-
tion (90°), with the activating mode leading the inhibitory
mode [10].
We can exploit this understanding of the dynamic system
to obtain an interpretation of the biochemical nature of the
activating and inhibiting modes. In essence, we do this by
mapping the measured phase and amplitude data of the
individual metabolites onto the plane of oscillations. For
this purpose, we use polar phase plane plots, where the
angles reflect the relative phases among the metabolites,
and the moduli indicate their relative amplitudes. If a bio-
chemical interpretation of the two Hopf modes is possible,
then the datapoints of the metabolites are located along
two perpendicular lines, reflecting the 90° phase difference
between the Hopf modes. If, on the other hand, no such
structure is evident from the plot, then the conclusion is
that a simple biochemical interpretation of the two Hopf
modes is not possible.
In order to arrive at simpler – and therefore more useful –
biochemical interpretations, in some cases we consider the
minimum of the concentration oscillation of a metabolite
instead of its maximum. As the maximum and the mini-
mum are separated by 180°, this is done by changing the
relative phase of that particular metabolite by 180°. If such
manipulations have been performed, then this is indicated
in the plot. This procedure does not affect the biochemical
conclusions. As only the phase differences among the
metabolites are considered in the analysis, we can rotate
the plots as we please. Theory and details are developed in
a separate article [10].
If the data is obtained experimentally, then this kind of
analysis has the advantage that no prior knowledge of
either the kinetics or the structure of the network is needed.
If a model is available, then we use mathematica to calcu-
late the relative phases and amplitudes from the complex
eigenvector of the plane of oscillation. In any case, the
method is only applicable close to a supercritical Hopf
bifurcation.
Acknowledgements
We thank Barbara Bakker for useful comments and
discussions. The work presented here was supported
by the Functional Dynamics initiative of the Danish
Natural Science Research Council. S.D. acknowledges
the financial support provided by the Villum Kann
Rasmussen Foundation.
References
1 Ghosh A & Chance B (1964) Oscillations of glycolytic
intermediates in yeast cells. Biochem Biophys Res
Commun 16, 174–181.
2 Frenkel R (1968) Control of reduced diphosphopyridine
nucleotide oscillations in beef heart extracts. II. Oscilla-
tions of glycolytic intermediates and adenine nucleo-
tides. Arch Biochem Biophys 125, 157–165.
Mechanisms of glycolytic oscillations M. F. Madsen et al.
2658 FEBS Journal 272 (2005) 2648–2660 ª 2005 FEBS
3 Tornheim K & Lowenstein JM (1974) The purine
nucleotide cycle. IV. Interactions with oscillations of the
glycolytic pathway in muscle extracts. J Biol Chem 249,
3241–3247.
4 O’Rourke B, Ramza BM & Marban E (1994) Oscilla-
tions of membrane current and excitability driven by
metabolic oscillations in heart cells. Science 265, 962–
966.
5 Nilsson T, Schultz V, Berggren P-O, Corkey BE &
Tornheim K (1996) Temporal patterns of changes in
ATP ⁄ ADP ratio, glucose 6-phosphate and cytoplasmic
free Ca
2+
in glucose-stimulated pancreatic b-cells.
Biochem J 314, 91–94.
6 Siegel G, Malmsten MKI, Klu
¨
ssendorf D
& Hofer H-W (1997) Vascular smooth muscle, a
multiply feedback-coupled system of high versality,
modulation and cell-signaling variability. Int J Microcirc
17, 360–373.
7 Wierschem K & Bertram R (2004) Complex bursting in
pancreatic islets: a potential glycolytic mechanism.
J Theor Biol 228, 513–521.
8 Winfree A (2000) The Geometry of Biological Time. 2nd
edn. Springer-Verlag, New York.
9 Richard P (2003) The rhythm of yeast. FEMS Microbiol
Rev 27, 547–557.
10 Danø S, Madsen MF & Sørensen PG (2005) Chemical
interpretation of oscillatory modes at a Hopf point.
Phys Chem Chem Phys 7, 1674–1679.
11 Duysens LNM & Amesz J (1957) Fluorescence spectro-
photometry of reduced phosphopyridine nucleotides in
intact cells in the near-ultraviolet and visible region.
Biochim Biophys Acta 24, 19–26.
12 Boiteux A & Hess B (1973) Control mechanism of gly-
colytic oscillations. In Biological and Biochemical Oscil-
lators (Chance B, Pye EK, Ghosh A & Hess B, eds),
pp. 243–252. Academic Press, New York.
13 Nielsen K, Sørensen PG & Hynne F (1997) Chaos in
glycolysis. J Theor Biol 186, 303–306.
14 Nielsen K, Sørensen PG, Hynne F & Busse H-G (1998)
Sustained oscillations in glycolysis: an experimental and
theoretical study of chaotic and complex periodic beha-
vior and of quenching of simple oscillations. Biophys
Chem 72, 49–62.
15 Chance B, Williamson G, Lee IY, Mela L, DeVault D,
Ghosh A & Pye EK (1973) Synchronization phenomena
in oscillations of yeast cells and isolated mitochondria.
In Biological and Biochemical Oscillators (Chance B, Pye
EK, Ghosh A & Hess B, eds), pp. 285–300. Academic
Press, New York.
16 von Klitzing L & Betz A (1970) Metabolic control in
flow systems. Arch Mikrobiol 71, 220–225.
17 Danø S (1999) Glycolytic Oscillations in Yeast Cells.
MSc Thesis, University of Copenhagen, Copenhagen.
18 Danø S, Sørensen PG & Hynne F (1999) Sustained
oscillations in living cells. Nature 402, 320–322.
19 Hynne F, Danø S & Sørensen PG (2001) Full-scale
model of glycolysis in Saccharomyces cerevisiae, Biophys
Chem 94, 121–163.
20 Higgins J (1964) A chemical mechanism for oscillation
of glycolytic intermediates in yeast cells. Proc Natl Acad
Sci USA 51, 989–994.
21 Goldbeter A (1996) Biochemical Oscillations and Cellular
Rhythms. Cambridge University Press, Cambridge.
22 Hess B, Boiteux A & Kru
¨
ger J (1969) Cooperation of
glycolytic enzymes. Adv Enzyme Regul 7, 149–167.
23 Hess B & Boiteux A (1971) Oscillatory phenomena in
biochemistry. Annu Rev Biochem 40, 237–258.
24 Boiteux A & Hess B (1974) Oscillations in glycolysis,
cellular respiration and communication. Farad Symp
Chem Soc 9, 202–214.
25 Hess B (1979) The glycolytic oscillator. J Exp Biol 81,
7–14.
26 Chance B, Holmes W, Higgins J & Connelly C (1958)
Localization of interaction sites in multi-component
transfer systems – theorems derived from analogies.
Nature 182, 1190–1193.
27 Madsen MF (2004) The Glycolytic Oscillophore. MSc
Thesis, University of Copenhagen, Copenhagen.
28 Sel’kov EE (1968) Self-oscillations in glycolysis. A sim-
ple kinetic model. Eur J Biochem 4, 79–86.
29 Goldbeter A & Lefever R (1972) Dissipative structures
for an allosteric model. Application to glycolytic oscilla-
tions. Biophys J 12, 1302–1315.
30 Richard P, Bakker BM, Teusink B, van Dam K
& Westerhoff HV (1996) Acetaldehyde mediates the
synchronization of sustained glycolytic oscillations in
populations of yeast cells. Eur J Biochem 235, 238–
241.
31 Wolf J, Passarge J, Somsen O, Snoep J, Heinrich R &
Westerhoff H (2000) Transduction of intracellular and
intercellular dynamics in yeast glycolytic oscillations.
Biophys J 78, 1145–1153.
32 Bier M, Teusink B, Kholodenko BN & Westerhoff HV
(1996) Control analysis of glycolytic oscillations.
Biophys Chem 62, 15–24.
33 Reijenga K, Westerhoff H, Kholodenko B & Snoep J
(2002) Control analysis for autonomously oscillating
biochemical networks. Biophys J 82, 99–108.
34 Teusink B, Bakker B & Westerhoff HV (1996) Control
of frequency and amplitude is shared by all enzymes in
three models for yeast glycolytic oscillations. Biochem
Biophys Acta 1275, 204–212.
35 Becker J-U & Betz A (1972) Membrane transport as
controlling pace-maker of glycolysis in Saccharomyces
carlsbergensis, Biochim. Biophys Acta 274, 584–
597.
36 Reijenga K, Snoep J, Diderich J, van Verseveld H,
Westerhoff H & Teusink B (2001) Control of glycolytic
dynamics by hexose transport in Saccharomyces cerevi-
siae, Biophys. J 80, 626–634.
M. F. Madsen et al. Mechanisms of glycolytic oscillations
FEBS Journal 272 (2005) 2648–2660 ª 2005 FEBS 2659
37 Hess B & Boiteux A (1973) Substrate control of glycoly-
tic oscillations. In Biological and Biochemical Oscillators
(Chance B, Pye EK, Ghosh A & Hess B, eds), pp. 229–
241 Academic Press, New York.
38 Sel’kov E (1975) Stabilization of energy charge, genera-
tion of oscillations and multiple steady states in energy
metabolism as a result of purely stoichiometric regula-
tion. Eur J Biochem 59, 151–157.
39 Aon MA, Cortassa S, Westerhoff HV, Berden JA, van
Spronsen E & van Dam K (1991) Dynamic regulation
of yeast glycolytic oscillations by mitochondrial func-
tions. J Cell Sci 99, 325–334.
40 Betz A & Chance B (1965) Phase relationship of glyco-
lytic intermediates in yeast cells with oscillatory meta-
bolic control. Arch Biochem Biophys 109, 585–594.
41 Richard P, Teusink B, Hemker MB, van Dam K &
Westerhoff HV (1996) Sustained oscillations in free-
energy state and hexose phosphates in yeast. Yeast 12,
731–740.
42 Wolf J & Heinrich R (2000) Effect of cellular interac-
tion on glycolytic oscillations in yeast: a theoretical
investigation. Biochem J 345, 321–334.
43 Danø S, Hynne F, De Monte S, d’Ovidio F, Sørensen
PG & Westerhoff H (2001) Synchronization of glycoly-
tic oscillations in a yeast cell population. Faraday Dis-
cuss 120, 261–276.
44 Ghosh AK, Chance B & Pye EK (1971) Metabolic cou-
pling and synchronization of NADH oscillations in
yeast cell populations. Arch Biochem Biophys 145, 319–
331.
45 Betz A & Becker JU (1975) Phase dependent phase
shifts induced by pyruvate and acetaldehyde in oscillat-
ing NADH of yeast cells. J Interdiscipl Cycle Res 6,
167–173.
46 Poulsen A, Lauritsen F & Olsen L (2004) Sustained gly-
colytic oscillations – no need for cyanide. FEMS Micro-
biol Lett 236, 261–266.
47 Fell D (1997) Understanding the Control of Metabolism.
Portland Press, London.
48 Kohout M, Schreiber I & Kubı
´
fek M (2002) A compu-
tational tool for nonlinear dynamical and bifurcation
analysis of chemical engineerig problems. Comput Chem
Eng 26, 517–527.
49 Reijenga K (2002) Dynamic Control of Yeast Glycolysis.
PhD Thesis, Vrije Universiteit Amsterdam, Amsterdam.
50 Ipsen M, Hynne F & Sørensen PG (1998) Systematic
derivation of amplitude equations and normal forms for
dynamical systems. Chaos 8, 834–852.
Mechanisms of glycolytic oscillations M. F. Madsen et al.
2660 FEBS Journal 272 (2005) 2648–2660 ª 2005 FEBS