Báo cáo khoa học: "Automatically Learning Measures of Child Language Development" pptx
Bạn đang xem bản rút gọn của tài liệu. Xem và tải ngay bản đầy đủ của tài liệu tại đây (309.92 KB, 5 trang )
Proceedings of the 50th Annual Meeting of the Association for Computational Linguistics, pages 95–99,
Jeju, Republic of Korea, 8-14 July 2012.
c
2012 Association for Computational Linguistics
Automatically Learning Measures of Child Language Development
Sam Sahakian
University of Wisconsin - Madison
Benjamin Snyder
University of Wisconsin - Madison
Abstract
We propose a new approach for the creation of
child language development metrics. A set of
linguistic features is computed on child speech
samples and used as input in two age predic-
tion experiments. In the first experiment, we
learn a child-specific metric and predicts the
ages at which speech samples were produced.
We then learn a more general developmen-
tal index by applying our method across chil-
dren, predicting relative temporal orderings of
speech samples. In both cases we compare
our results with established measures of lan-
guage development, showing improvements in
age prediction performance.
1 Introduction
The rapid childhood development from a seem-
ingly blank slate to language mastery is a puzzle
that linguists and psychologists continue to ponder.
While the precise mechanism of language learning
remains poorly understood, researchers have devel-
oped measures of developmental language progress
using child speech patterns. These metrics pro-
vide a means of diagnosing early language disor-
ders. Besides this practical benefit, precisely mea-
suring grammatical development is a step towards
understanding the underlying language learning pro-
cess.
Previous NLP work has sought to automate the
calculation of handcrafted developmental metrics
proposed by psychologists and linguists. In this pa-
per, we investigate a more fundamental question:
Can we use machine learning techniques to create
a more robust developmental measure itself? If so,
how well would such a measure generalize across
children? This last question touches on an underly-
ing assumption made in much of the child language
literature– that while children progress grammati-
cally at different rates, they follow fixed stages in
their development. If a developmental index auto-
matically learned from one set of children could be
accurately applied to others, it would vindicate this
assumption of shared developmental paths.
Several metrics of language development have
been set forth in the psycholinguistics literature.
Standard measures include Mean Length of Utter-
ance (MLU) (Brown, 1973)– the average length in
morphemes of conversational turns, Index of Pro-
ductive Syntax (IPSYN) (Scarborough, 1990)– a
multi-tiered scoring process where over 60 individ-
ual features are counted by hand and combined into
tiered scores, and D-Level (Rosenberg et al., 1987;
Covington et al., 2006)– a score for individual sen-
tences based on the observed presence of key syn-
tactic structures. Today, these hand-crafted metrics
persist as measurements of child language develop-
ment, each taking a slightly different angle to assess
the same question: Exactly how much grammatical
knowledge does a young learner possess?
NLP technology has been applied to help au-
tomate the otherwise tedious calculation of these
measures. Computerized Profiling (CP) (Long and
Channell, 2001) is a software package that produces
semi-automated language assessments, using part-
of-speech tagging and human supervision. In re-
sponse to its limited depth of analysis and the neces-
sity for human supervision in CP, there have since
95
D-Level
Article Count
“Be” Count
Fn. / Content
Prep. Count
Word Freq.
Depth
MLU
Adam 0.798 0.532 0.817 0.302 0.399 0.371 0.847 0.855
Abe 0.633 0.479 0.591 0.144 0.269 0.413 0.534 0.625
Ross 0.252 0.153 -0.061 0.125 0.314 0.209 0.134 0.165
Peter 0.371 0.429 0.781 0.562 0.638 0.657 0.524 0.638
Naomi 0.812 0.746 0.540 0.652 0.504 0.609 0.710 0.710
Sarah 0.829 0.550 0.733 0.382 0.654 0.570 0.731 0.808
Nina 0.824 0.758 0.780 0.560 0.451 0.429 0.780 0.890
Mean: 0.646 0.521 0.597 0.390 0.461 0.465 0.609 0.670
Table 1: τ of each feature versus time, for each individual
child. In this and all following tables, traditional devel-
opmental metrics are shaded.
been implementations of completely automated as-
sessments of IPSYN (Sagae et al., 2005) and D-
Level (Lu, 2009) which take advantage of automatic
parsing and achieve results comparable to manual
assessments. Likewise, in the ESL domain, Chen
and Zechner (2011) automate the evaluation of syn-
tactic complexity of non-native speech.
Thus, it has been demonstrated that NLP tech-
niques can compute existing scores of language pro-
ficiency. However, the definition of first-language
developmental metrics has as yet been left up to hu-
man reasoning. In this paper, we consider the au-
tomatic induction of more accurate developmental
metrics using child language data. We extract fea-
tures from longitudinal child language data and con-
duct two sets of experiments. For individual chil-
dren, we use least-squares regression over our fea-
tures to predict the age of a held-out language sam-
ple. We find that on average, existing single met-
rics of development are outperformed by a weighted
combination of our features.
In our second set of experiments, we investigate
whether metrics can be learned across children. To
do so, we consider a speech sample ordering task.
We use optimization techniques to learn weight-
ings over features that allow generalization across
children. Although traditional measures like MLU
and D-level perform well on this task, we find that
a learned combination of features outperforms any
single pre-defined developmental score.
2 Data
To identify trends in child language learning we
need a corpus of child speech samples, which we
0
2,250
4,500
6,750
9,000
14 21 28 35 42 49 56 63 70 77
Utterances
Age (months)
Adam
Abe
Ross
Peter
Naomi
Sarah
Nina
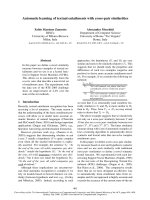
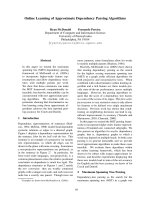
Figure 1: Number of utterances across ages of
each child in our corpus. Sources: Nina (Suppes,
1974), Sarah (Brown, 1973), Naomi (Sachs, 1983),
Peter (Bloom et al., 1974; Bloom et al., 1975),
Ross (MacWhinney, 2000), Abe (Kuczaj, 1977) and
Adam (Brown, 1973)
take from the CHILDES database (MacWhinney,
2000). CHILDES is a collection of corpora from
many studies of child language based on episodic
speech data. Since we are interested in development
over time, our corpus consists of seven longitudinal
studies of individual children. Data for each child
is grouped and sorted by the child’s age in months,
so that we have a single data point for each month
in which a child was observed. The size of our data
set, broken down by child, is shown in Figure 1.
We take advantage of automatic dependency
parses bundled with the CHILDES transcripts
(Sagae et al., 2007) and harvest features that should
be informative and complementary in assessing
grammatical knowledge. We first note three stan-
dard measures of language development: (i) MLU,
a measure of utterance length, (ii) mean depth of de-
pendency parse trees, a measure of syntactic com-
plexity similar to that of Yngve (1960), and (iii) D-
level, a measure of linguistic competence based on
observations of syntactic constructions.
Beyond the three traditional developmental met-
rics, we record five additional features. We count
two of Brown’s (1973) obligatory morphemes — ar-
ticles and contracted auxiliary “be” verbs — as well
as occurrences of any preposition. These counted
features are normalized by a child’s total number
of utterances at a given age. Finally, we include
two vocabulary-centric features: Average word fre-
96
D-Level Depth MLU All Features
Adam 14.037 14.149 11.128 14.175
Abe 34.69 44.701 34.509 39.931
Ross 329.64 336.612 345.046 244.071
Peter 23.58 13.045 8.245 24.128
Naomi 24.458 28.426 34.956 45.036
Sarah 12.503 20.878 13.905 6.989
Nina 7.654 6.477 4.255 3.96
Mean 63.795 66.327 64.578 54.041
Table 2: Mean squared error from 10-fold cross valida-
tion of linear regression on individual children. The low-
est error for each child is shown in bold.
quency (i.e. how often a word is used in a stan-
dard corpus) as indicated by CELEX (Baayen et al.,
1995), and the child’s ratio of function words (deter-
miners, pronouns, prepositions, auxiliaries and con-
junctions) to content words.
To validate a developmental measure, we rely on
the assumption that a perfect metric should increase
monotonically over time. We therefore calculate
Kendall’s Tau coefficient (τ) between an ordering of
each child’s speech samples by age, and an order-
ing by the given scoring metric. The τ coefficient
is a measure of rank correlation where two identical
orderings receive a τ of 1, complete opposite order-
ings receive a τ of -1, and independent orderings are
expected to receive a τ of zero. The τ coefficients
for each of our 8 features individually applied to the
7 children are shown in Table 1.
We note that the pre-defined indices of language
development — MLU, tree depth and D-Level —
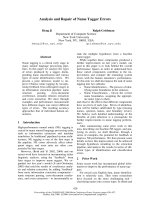
perform the ordering task most accurately. To illus-
trate the degree of variance between children and
features, we also include plots of each child’s D-
Level and contracted auxiliary “be” usage in Figure
2.
3 Experiments
Learning Individual Child Metrics Our first task
is to predict the age at which a held-out speech sam-
ple was produced, given a set of age-stamped sam-
ples from the same child. We perform a least squares
regression on each child, treating age as the depen-
dent variable, and our features as independent vari-
ables. Each data set is split into 10 random folds of
90% training and 10% test data. Mean squared error
is reported in Table 2. On average, our regression
MLU All Features MLU & Fn. / Content
0.7456 0.7457 0.7780
Table 3: Average τ of orderings produced by MLU (the
best traditional index) and our learned metric, versus true
chronological order. Highest τ is shown in bold.
achieves lower error than any individual feature by
itself.
Learning General Metrics Across Children To
produce a universal metric of language development
like MLU or D-Level, we train on data pooled across
many children. For each of 7 folds, a single child’s
data is separated as a test set while the remaining
children are used for training. Since Ross is the only
child with samples beyond 62 months, we do not at-
tempt to learn a general measure of language devel-
opment at these ages, but rather remove these data
points.
Unlike the individual-child case, we do not pre-
dict absolute ages based on speech samples, as each
child is expected to learn at a different rate. Instead,
we learn an ordering model which attempts to place
each sample in its relative place in time. The model
computes a score from a weighted quadratic combi-
nation of our features and orders the samples based
on their computed scores. To learn the parameters
of the model, we seek to maximize the Kendall τ
between true and predicted orderings, summed over
the training children. We pass this objective function
to Nelder-Mead (Nelder and Mead, 1965), a stan-
dard gradient-free optimization algorithm. Nelder-
Mead constructs a simplex at its initial guess of pa-
rameter values and iteratively makes small shifts in
the simplex to satisfy a descent condition until a lo-
cal maximum is reached.
We report the average Kendall τ achieved by this
algorithm over several feature combinations in Ta-
ble 3. Because we modify our data set in this ex-
periment, for comparison we also show the average
Kendall τ achieved by MLU on the truncated data.
4 Discussion
Our first set of experiments verified that we can
achieve a decrease in mean squared error over ex-
isting metrics in a child-specific age prediction task.
However, the results of this experiment are skewed
97
0 1 2
0
20
40
60
80
100
Adam
0 1 2
0
20
40
60
80
100
Abe
0 1 2
0
20
40
60
80
100
Ross
0 1 2
0
20
40
60
80
100
Peter
0 1 2
0
20
40
60
80
100
Naomi
0 1 2
0
20
40
60
80
100
Sarah
0 1 2
0
20
40
60
80
100
Nina
0 0.1 0.2
0
20
40
60
80
100
0 0.1 0.2
0
20
40
60
80
100
0 0.1 0.2
0
20
40
60
80
100
0 0.1 0.2
0
20
40
60
80
100
0 0.1 0.2
0
20
40
60
80
100
0 0.1 0.2
0
20
40
60
80
100
0 0.1 0.2
0
20
40
60
80
100
Figure 2: Child age plotted against D-Level (top) and counts of contracted auxiliary “be” (bottom) with best fit lines.
Since our regression predicts child age, age in months is plotted on the y-axis.
in favor of the learned metric by the apparent diffi-
culty of predicting Ross’s age. As demonstrated in
Figure 2, Ross’s data exhibits major variance, and
also includes data from later ages than that of the
other children. It is well known that MLU’s per-
formance as a measure of linguistic ability quickly
drops off with age.
During our first experiment, we also attempted to
capture more nuanced learning curves than the lin-
ear case. Specifically, we anticipated that learning
over time should follow an S-shaped curve. This
follows from observations of a “fast mapping” spurt
in child word learning (Woodward et al., 1994), and
the idea that learning must eventually level off as
mastery is attained. To allow our model to capture
non-linear learning rates, we fit logit and quadratic
functions to the data. Despite the increased free-
dom, only Nina’s predictions benefited from these
more complex models. With every other child, these
functions fit the data to a linear section of the curve
and yielded much larger errors than simple linear
regression. The preference towards linearity may
be due to the limited time span of our data. With
higher ages, the leveling off of linguistic perfor-
mance would need to be modeled.
In our second set of experiments, we attempted
to learn a general metric across children. Here we
also achieved positive results with simple methods,
just edging out established measures of language de-
velopment. The generality of our learned metric
supports the hypothesis that children follow simi-
lar paths of language development. Although our
learned solution is slightly more favorable than pre-
existing metrics, it performs very little learning. Us-
ing all features, learned parameter weights remain at
or extremely close to the starting point of 1.
Through trial and error, we discovered we could
improve performance by omitting certain features.
In Table 3, we report the best discovered feature
combination including only two relatively uncorre-
lated features, MLU and function/content word ra-
tio. If downweighting some features yields a better
result, we would expect to discover that with our op-
timization algorithm, but this evidently not the case,
perhaps due to our limited sample of 7 children.
The fact that weights move so little suggests that
our best result is stuck in a local maximum. To
investigate this, we also experimented with Differ-
ential Evolution (Storn and Price, 1997) and SVM-
ranking (Joachims, 2002), the former a global op-
timization technique, and the latter a method de-
veloped specifically to learn orderings. Although
these algorithms are more willing to adjust param-
eter weights and theoretically should not get stuck
in local maxima, they are still edged out in perfor-
mance by Nelder-Mead. It may be that the early
stopping of Nelder-Mead serves as a sort of smooth-
ing in this very small data-set of 7 children.
Our improvements over hand-crafted measures
of language development show promise. In the
case of individual children, we outperform existing
measures of development, especially past the early
stages of development when MLU ceases to corre-
late with age. Our attempts to learn a metric across
children met with more limited success. However,
when we restricted our regression to two of the least
correlated features, MLU and the function/content
word ratio, we were able to beat manually created
metrics. These results suggest that more sophisti-
cated models and techniques combined with more
data could lead to more accurate metrics as well as
insights into the language learning process.
98
References
R.H. Baayen, R. Piepenbrock, and L. Gulikers. 1995.
The CELEX lexical database (release 2)[cd-rom].
Philadelphia, PA: Linguistic Data Consortium, Uni-
versity of Pennsylvania [Distributor].
L. Bloom, L. Hood, and P. Lightbown. 1974. Imitation in
language development: If, when, and why. Cognitive
Psychology, 6(3):380–420.
L. Bloom, P. Lightbown, L. Hood, M. Bowerman,
M. Maratsos, and M.P. Maratsos. 1975. Structure and
variation in child language. Monographs of the Soci-
ety for Research in Child Development, pages 1–97.
R. Brown. 1973. A First Language: The Early Stages.
Harvard U. Press.
M. Chen and K. Zechner. 2011. Computing and evaluat-
ing syntactic complexity features for automated scor-
ing of spontaneous non-native speech. In Proceed-
ings of the 49th Annual Meeting of the Association for
Computational Linguistics, pages 722–731.
M.A. Covington, C. He, C. Brown, L. Naci, and J. Brown.
2006. How complex is that sentence? a proposed re-
vision of the Rosenberg and Abbeduto D-level scale.
Research Report, AI Center, University of Georgia.
T. Joachims. 2002. Optimizing search engines us-
ing clickthrough data. In Proceedings of the Eighth
ACM SIGKDD International Conference on Knowl-
edge Discovery and Data Mining, pages 133–142.
ACM.
S.A. Kuczaj. 1977. The acquisition of regular and irreg-
ular past tense forms. Journal of Verbal Learning and
Verbal Behavior, 16(5):589–600.
S.H. Long and R.W. Channell. 2001. Accuracy of
four language analysis procedures performed automat-
ically. American Journal of Speech-Language Pathol-
ogy, 10(2):180.
X. Lu. 2009. Automatic measurement of syntactic com-
plexity in child language acquisition. International
Journal of Corpus Linguistics, 14(1):3–28.
B. MacWhinney. 2000. The CHILDES project: Tools for
analyzing talk, volume 2. Psychology Press.
J.A. Nelder and R. Mead. 1965. A simplex method
for function minimization. The Computer Journal,
7(4):308–313.
S. Rosenberg, L. Abbeduto, et al. 1987. Indicators of
linguistic competence in the peer group conversational
behavior of mildly retarded adults. Applied Psycholin-
guistics, 8(1):19–32.
J. Sachs. 1983. Talking about the there and then: The
emergence of displaced reference in parent-child dis-
course. Childrens Language, 4.
K. Sagae, A. Lavie, and B. MacWhinney. 2005. Auto-
matic measurement of syntactic development in child
language. In Proceedings of the 43rd Annual Meeting
on Association for Computational Linguistics, pages
197–204. Association for Computational Linguistics.
K. Sagae, E. Davis, A. Lavie, B. MacWhinney, and
S. Wintner. 2007. High-accuracy annotation and
parsing of CHILDES transcripts. In Proceedings of
the Workshop on Cognitive Aspects of Computational
Language Acquisition, pages 25–32. Association for
Computational Linguistics.
H.S. Scarborough. 1990. Index of productive syntax.
Applied Psycholinguistics, 11(1):1–22.
R. Storn and K. Price. 1997. Differential evolution–a
simple and efficient heuristic for global optimization
over continuous spaces. Journal of Global Optimiza-
tion, 11(4):341–359.
P. Suppes. 1974. The semantics of children’s language.
American Psychologist, 29(2):103.
A.L. Woodward, E.M. Markman, and C.M. Fitzsimmons.
1994. Rapid word learning in 13-and 18-month-olds.
Developmental Psychology, 30(4):553.
V.H. Yngve. 1960. A model and an hypothesis for lan-
guage structure. Proceedings of the American Philo-
sophical Society, 104(5):444–466.
99