Báo cáo khoa học: "Assessing the Effect of Inconsistent Assessors on Summarization Evaluation" doc
Bạn đang xem bản rút gọn của tài liệu. Xem và tải ngay bản đầy đủ của tài liệu tại đây (96.29 KB, 4 trang )
Proceedings of the 50th Annual Meeting of the Association for Computational Linguistics, pages 359–362,
Jeju, Republic of Korea, 8-14 July 2012.
c
2012 Association for Computational Linguistics
Assessing the Effect of Inconsistent Assessors on Summarization Evaluation
Karolina Owczarzak
National Institute of Standards and Technology
Gaithersburg, MD 20899
Peter A. Rankel
University of Maryland
College Park, Maryland
Hoa Trang Dang
National Institute of Standards and Technology
Gaithersburg, MD 20899
John M. Conroy
IDA/Center for Computing Sciences
Bowie, Maryland
Abstract
We investigate the consistency of human as-
sessors involved in summarization evaluation
to understand its effect on system ranking and
automatic evaluation techniques. Using Text
Analysis Conference data, we measure anno-
tator consistency based on human scoring of
summaries for Responsiveness, Readability,
and Pyramid scoring. We identify inconsis-
tencies in the data and measure to what ex-
tent these inconsistencies affect the ranking
of automatic summarization systems. Finally,
we examine the stability of automatic metrics
(ROUGE and CLASSY) with respect to the
inconsistent assessments.
1 Introduction
Automatic summarization of documents is a re-
search area that unfortunately depends on human
feedback. Although attempts have been made at au-
tomating the evaluation of summaries, none is so
good as to remove the need for human assessors.
Human judgment of summaries, however, is not per-
fect either. We investigate two ways of measuring
evaluation consistency in order to see what effect it
has on summarization evaluation and training of au-
tomatic evaluation metrics.
2 Assessor consistency
In the Text Analysis Conference (TAC) Summariza-
tion track, participants are allowed to submit more
than one run (usually two), and this option is of-
ten used to test different settings or versions of the
same summarization system. In cases when the sys-
tem versions are not too divergent, they sometimes
produce identical summaries for a given topic. Sum-
maries are randomized within each topic before they
are evaluated, so the identical copies are usually in-
terspersed with 40-50 other summaries for the same
topic and are not evaluated in a row. Given that each
topic is evaluated by a single assessor, it then be-
comes possible to check assessor consistency, i.e.,
whether the assessor judged the two identical sum-
maries in the same way.
For each summary, assessors conduct content
evaluation according to the Pyramid framework
(Nenkova and Passonneau, 2004) and assign it Re-
sponsiveness and Readability scores
1
, so assessor
consistency can be checked in these three areas sep-
arately. We found between 230 (in 2009) and 430
(in 2011) pairs of identical summaries for the 2008-
2011 data (given on average 45 topics, 50 runs, and
two summarization conditions: main and update),
giving in effect anywhere from around 30 to 60 in-
stances per assessor per year. Using Krippendorff’s
alpha (Freelon, 2004), we calculated assessor con-
sistency within each year, as well as total consis-
tency over all years’ data (for those assessors who
worked multiple years). Table 1 shows rankings of
assessors in 2011, based on their Readability, Re-
sponsiveness, and Pyramid judgments for identical
summary pairs (around 60 pairs per assessor).
Interestingly, consistency values for Readability
are lower overall than those for Responsiveness and
Pyramid, even for the most consistent assessors.
Given that Readability and Responsiveness are eval-
uated in the same way, i.e. by assigning a numeri-
cal score according to detailed guidelines, this sug-
1
/>Summ.2011.guidelines.html
359
ID Read ID Resp ID Pyr
G 0.867 G 0.931 G 0.975
D 0.866 D 0.875 D 0.970
A 0.801 H 0.808 H 0.935
H 0.783 A 0.750 A 0.931
F 0.647 F 0.720 E 0.909
C 0.641 E 0.711 C 0.886
E 0.519 C 0.490 F 0.872
Table 1: Annotator consistency in assigning Readability
and Responsiveness scores and in Pyramid evaluation, as
represented by Krippendorff’s alpha for interval values,
on 2011 data.
gests that Readability as a quality of text is inher-
ently more vague and difficult to pinpoint.
On the other hand, Pyramid consistency values
are generally the highest, which can be explained
by how the Pyramid evaluation is designed. Even
if the assessor is inconsistent in selecting Sum-
mary Content Units (SCUs) across different sum-
maries, as long as the total summary weight is sim-
ilar, the summary’s final score will be similar, too.
2
Therefore, it would be better to look at whether as-
sessors tend to find the same SCUs (information
“nuggets”) in different summaries on the same topic,
and whether they annotate them consistently. This
can be done using the “autoannotate” function of
the Pyramid process, where all SCU contributors
(selected text strings) from already annotated sum-
maries are matched against the text of a candidate
(un-annotated) summary. The autoannotate func-
tion works fairly well for matching between extrac-
tive summaries, which tend to repeat verbatim whole
sentences from source documents.
For each summary in 2008-2011 data, we autoan-
notated it using all remaining manually-annotated
summaries from the same topic, and then we com-
pared the resulting “autoPyramid” score with the
score from the original manual annotation for that
summary. Ideally, the autoPyramid score should
be lower or equal to the manual Pyramid score: it
would mean that in this summary, the assessor se-
lected as relevant all the same strings as s/he found
in the other summaries on the same topic, plus possi-
bly some more information that did not appear any-
2
The final score is based on total weight of all SCUs found
in the summary, so the same weight can be obtained by select-
ing a larger number of lower-weight SCUs or a smaller number
of higher-weight SCUs (or the same number of similar-weight
SCUs which nevertheless denote different content).
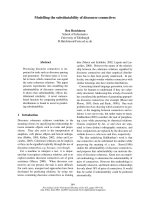
Figure 1: Annotator consistency in selecting SCUs in
Pyramid evaluation, as represented by the difference be-
tween manual Pyramid and automatic Pyramid scores
(mP-aP), on 2011 data.
where else. If the autoPyramid score is higher than
the manual Pyramid score, it means that either (1)
the assessor missed relevant strings in this summary,
but found them in other summaries; or (2) the strings
selected as relevant elsewhere in the topic were acci-
dental, and as such not repeated in this summary. Ei-
ther way, if we then average out score differences for
all summaries for a given topic, it will give us a good
picture of the annotation consistency in this partic-
ular topic. Higher average autoPyramid scores sug-
gest that the assessor was missing content, or other-
wise making frequent random mistakes in assigning
content. Figure 1 shows the macro-average differ-
ence between manual Pyramid scores and autoPyra-
mid scores for each assessor in 2011.
3
For the most
part, it mirrors the consistency ranking from Table
1, confirming that some assessors are less consistent
than others; however, certain differences appear: for
instance, Assessor A is one of the most consistent in
assigning Readability scores, but is not very good at
selecting SCUs consistently. This can be explained
by the fact that the Pyramid evaluation and assigning
Readability scores are different processes and might
require different skills and types of focus.
3 Impact on evaluation
Since human assessment is used to rank participat-
ing summarizers in the TAC Summarization track,
3
Due to space constraints, we report figures for only 2011,
but the results for other years are similar.
360
Pearson’s r Spearman’s rho
-1 worst -2 worst -1 worst -2 worst
Readability 0.995 0.993 0.988 0.986
Responsiveness 0.996 0.989 0.986 0.946
Pyramid 0.996 0.992 0.978 0.960
mP-aP 0.996 0.987 0.975 0.943
Table 2: Correlation between the original summarizer
ranking and the ranking after excluding topics by one or
two worst assessors in each category.
we should examine the potential impact of incon-
sistent assessors on the overall evaluation. Because
the final summarizer score is the average over many
topics, and the topics are fairly evenly distributed
among assessors for annotation, excluding noisy
topics/assessors has very little impact on summa-
rizer ranking. As an example, consider the 2011 as-
sessor consistency data in Table 1 and Figure 1. If
we exclude topics by the worst performing assessor
from each of these categories, recalculate the sum-
marizer rankings, and then check the correlation be-
tween the original and newly created rankings, we
obtain results in Table 2.
Although the impact on evaluating automatic
summarizers is small, it could be argued that exclud-
ing topics with inconsistent human scoring will have
an impact on the performance of automatic evalua-
tion metrics, which might be unfairly penalized by
their inability to emulate random human mistakes.
Table 3 shows ROUGE-2 (Lin, 2004), one of the
state-of-the-art automatic metrics used in TAC, and
its correlations with human metrics, before and af-
ter exclusion of noisy topics from 2011 data. The
results are fairly inconclusive: it seems that in most
cases, removing topics does more harm than good,
suggesting that the signal-to-noise ratio is still tipped
in favor of signal. The only exception is Readability,
where ROUGE records a slight increase in correla-
tion; this is unsurprising, given that consistency val-
ues for Readability are the lowest of all categories,
and perhaps here removing noise has more impact.
In the case of Pyramid, there is a small gain when
we exclude the single worst assessor, but excluding
two assessors results in a decreased correlation, per-
haps because we remove too much valid information
at the same time.
A different picture emerges when we examine
how well ROUGE-2 can predict human scores on
the summary level. We pooled together all sum-
Readability Responsiveness Pyramid mP-aP
before 0.705 0.930 0.954 0.954
-1 worst 0.718 0.921 0.961 0.942
-2 worst 0.718 0.904 0.952 0.923
Table 3: Correlation between the summarizer rankings
according to ROUGE-2 and human metrics, before and
after excluding topics by one or two worst assessors in
that category.
Readability Responsiveness Pyramid mP-aP
before 0.579 0.694 0.771 0.771
-1 worst 0.626 0.695 0.828 0.752
-2 worst 0.628 0.721 0.817 0.741
Table 4: Correlation between ROUGE-2 and human met-
rics on a summary level before and after excluding topics
by one or two worst assessors in that category.
maries annotated by each particular assessor and cal-
culated the correlation between ROUGE-2 and this
assessor’s manual scores for individual summaries.
Then we calculated the mean correlation over all
assessors. Unsurprisingly, inconsistent assessors
tend to correlate poorly with automatic (and there-
fore always consistent) metrics, so excluding one
or two worst assessors from each category increases
ROUGE’s average per-assessor summary-level cor-
relation, as can be seen in Table 4. The only ex-
ception here is when we exclude assessors based on
their autoPyramid performance: again, because in-
consistent SCU selection doesn’t necessarily trans-
late into inconsistent final Pyramid scores, exclud-
ing those assessors doesn’t do much for ROUGE-2.
4 Impact on training
Another area where excluding noisy topics might be
useful is in training new automatic evaluation met-
rics. To examine this issue we turned to CLASSY
(Rankel et al., 2011), an automatic evaluation met-
ric submitted to TAC each year from 2009-2011.
CLASSY consists of four different versions, each
aimed at predicting a particular human evaluation
score. Each version of CLASSY is based on one
of three regression methods: robust regression, non-
negative least squares, or canonical correlation. The
regressions are calculated based on a collection of
linguistic and content features, derived from the
summary to be scored.
CLASSY requires two years of marked data to
score summaries in a new year. In order to predict
361
the human metrics in 2011, for example, CLASSY
uses the human ratings from 2009 and 2010. It first
considers each subset of the features in turn, and us-
ing each of the regression methods, fits a model to
the 2009 data. The subset/method combination that
best predicts the 2010 scores is then used to pre-
dict scores for 2011. However, the model is first re-
trained on the 2010 data to calculate the coefficients
to be used in predicting 2011.
First, we trained all four CLASSY versions on
all available 2009-2010 topics, and then trained
again excluding topics by the most inconsistent as-
sessor(s). A different subset of topics was ex-
cluded depending on whether this particular version
of CLASSY was aiming to predict Responsiveness,
Readability, or the Pyramid score. Then we tested
CLASSY’s performance on 2011 data, ranking ei-
ther automatic summarizers (NoModels case) or hu-
man and automatic summarizers together (AllPeers
case), separately for main and update summaries,
and calculated its correlation with the metrics it was
aiming to predict. Table 5 shows the result of this
comparison. For Pyramid, (a) indicates that ex-
cluded topics were selected based on Krippendorff’s
alpha, and (b) indicates that topics were excluded
based on their mean difference between manual and
automatic Pyramid scores.
The results are encouraging; it seems that remov-
ing noisy topics from training data does improve the
correlations with manual metrics in most cases. The
greatest increase takes place in CLASSY’s correla-
tions with Responsiveness for main summaries in
AllPeers case, and for correlations with Readabil-
ity. While none of the changes are large enough
to achieve statistical significance, the pattern of im-
provement is fairly consistent.
5 Conclusions
We investigated the consistency of human assessors
in the area of summarization evaluation. We con-
sidered two ways of measuring assessor consistency,
depending on the metric, and studied the impact of
consistent scoring on ranking summarization sys-
tems and on the performance of automatic evalu-
ation systems. We found that summarization sys-
tem ranking, based on scores for multiple topics,
was surprisingly stable and didn’t change signifi-
NoModels AllPeers
main update main update
Pyramid
CLASSY1 Pyr 0.956 0.898 0.945 0.936
CLASSY1 Pyr new (a) 0.950 0.895 0.932 0.955
CLASSY1 Pyr new (b) 0.960 0.900 0.940 0.955
Responsiveness
CLASSY2 Resp 0.951 0.903 0.948 0.963
CLASSY2 Resp new 0.954 0.907 0.973 0.950
CLASSY4 Resp 0.951 0.927 0.830 0.949
CLASSY4 Resp new 0.943 0.928 0.887 0.946
Readability
CLASSY3 Read 0.768 0.705 0.844 0.907
CLASSY3 Read new 0.793 0.721 0.858 0.906
Table 5: Correlations between CLASSY and human met-
rics on 2011 data (main and update summaries), before
and after excluding most inconsistent topic from 2009-
2010 training data for CLASSY.
cantly when several topics were removed from con-
sideration. However, on a summary level, remov-
ing topics scored by the most inconsistent assessors
helped ROUGE-2 increase its correlation with hu-
man metrics. In the area of training automatic met-
rics, we found some encouraging results; removing
noise from the training data allowed most CLASSY
versions to improve their correlations with the man-
ual metrics that they were aiming to model.
References
Deen G. Freelon. 2010. ReCal: Intercoder Reliability
Calculation as a Web Service. International Journal
of Internet Science, Vol 5(1).
Chin-Yew Lin. 2004. ROUGE: A Package for Auto-
matic Evaluation of Summaries. Text Summarization
Branches Out: Proceedings of the ACL-04 Workshop,
78–81. Barcelona, Spain.
Ani Nenkova and Rebecca J. Passonneau. 2004. Evaluat-
ing content selection in summarization: The Pyramid
method. Proceedings of the Human Language Tech-
nology Conference of the North American Chapter of
the Association for Computational Linguistics, 145–
152. Boston, MA.
Rebecca J. Passonneau, Ani Nenkova, Kathleen McKe-
own, and Sergey Sigelman. 2005. Applying the Pyra-
mid method in DUC 2005. Proceedings of the 5th
Document Understanding Conference (DUC). Van-
couver, Canada.
Peter A. Rankel, John M. Conroy, and Judith D.
Schlesinger. 2012. Better Metrics to Automatically
Predict the Quality of a Text Summary. Proceedings
of the SIAM Data Mining Text Mining Workshop 2012.
362