Báo cáo khoa học: Sulfoquinovosylmonoacylglycerol inhibitory mode analysis of rat DNA polymerase b pdf
Bạn đang xem bản rút gọn của tài liệu. Xem và tải ngay bản đầy đủ của tài liệu tại đây (544.55 KB, 13 trang )
Sulfoquinovosylmonoacylglycerol inhibitory mode analysis
of rat DNA polymerase b
Nobuyuki Kasai
1
, Yoshiyuki Mizushina
2
, Hiroshi Murata
1
, Takayuki Yamazaki
1
, Tadayasu Ohkubo
3
,
Kengo Sakaguchi
1
and Fumio Sugawara
1
1 Department of Applied Biological Science, Tokyo University of Science, Noda, Chiba, Japan
2 Department of Nutritional Science, Kobe-Gakuin University, Kobe, Hyogo, Japan
3 Department of Pharmaceutical Sciences, Osaka University, Suita, Osaka, Japan
We screened many DNA polymerase inhibitors
obtained from natural sources, such as long chain
unsaturated fatty acids, bile acids, terpenoids, and
sulfolipids [1–6]. Sulfoquinovosylmonoacylglycerol
(SQMG) (Fig. 1A,B), which was isolated from sea
algae, has been shown to be a potent inhibitor of euk-
aryotic DNA polymerases (pol) a, pol b, pol d, pol e,
pol g, pol j, pol k, terminal deoxynucleotidyl trans-
ferase (TdT) and HIV-1 reverse transcriptase, but not
of prokaryotic polymerases such as E. coli DNA
polymerase I [7,8]. SQMG showed potent antitumor
activities in vivo in nude mice transplanted with human
adenocarcinoma cells [9,10] and suppressed tumor cell
proliferation in vitro [11]. We have already reported a
pathway of total chemical synthesis of SQMG for bio-
chemical and medicinal experiments [12].
Pol b is a key enzyme that protects the cell against
DNA damage by base excision repair. Eukaryotic DNA
polymerases are classified into four group: A, B, X and
Y [13]. Pol b is a member of the polymerase X (pol X)
Keywords
binding site; DNA polymerase b; inhibitor;
NMR chemical shift mapping;
sulfoquinovosylmonoacylglycerol
Correspondence
F. Sugawara, Department of Applied
Biological Science, Tokyo University of
Science, Noda, Chiba 278–8510, Japan
Fax: +81 4 7123 9767
Tel: +81 4 7124 1501 (ext. 3400)
E-mail:
(Received 11 May 2005, revised 29 June
2005, accepted 6 July 2005)
doi:10.1111/j.1742-4658.2005.04848.x
We have previously reported that sulfoquinovosylmonoacylglycerol
(SQMG) is a potent inhibitor of mammalian DNA polymerases. DNA
polymerase b (pol b) is one of the most important enzymes protecting the
cell against DNA damage by base excision repair. In this study, we charac-
terized the inhibitory action of SQMG against rat pol b. SQMG competed
with both the substrate and the template-primer for binding to pol b. A gel
mobility shift assay and a polymerase activity assay showed that SQMG
competed with DNA for a binding site on the N-terminal 8-kDa domain
of pol b, subsequently inhibiting its catalytic activity. Fragments of SQMG
such as sulfoquinovosylglycerol (SQG) and fatty acid (myristoleic acid,
MA) weakly inhibited pol b activity and the inhibitory effect of a mixture
of SQG and MA was stronger than that of SQG or MA. To characterize
this inhibition more precisely, we attempted to identify the interaction
interface between SQMG and the 8-kDa domain by NMR chemical shift
mapping. Firstly, we determined the binding site on a fragment of SQMG,
the SQG moiety. We observed chemical shift changes primarily at two
sites, the residues comprising the C-terminus of helix-1 and the N-terminus
of helix-2, and residues in helix-4. Finally, based on our present results and
our previously reported study of the interaction interface of fatty acids, we
constructed two three-dimensional models of a complex between the 8-kDa
domain and SQMG and evaluated them by the mutational analysis. The
models show a SQMG interaction interface that is consistent with the data.
Abbreviations
HSQC, heteronuclear single quantum coherence; LA, lithocholic acid; MA, myristoleic acid; NA, nervonic acid; oligo(dT), oligo
deoxyribothymidylic acid; Pol, DNA polymerase; SQG, sulfoquinovosylglycerol; SQMG, sulfoquinovosylmonoacylglycerol; TdT, terminal
deoxynucleotidyl transferase.
FEBS Journal 272 (2005) 4349–4361 ª 2005 FEBS 4349
family, which is composed of pol b, pol k, pol l and
TdT. Pol X family members share regions that are
similar to the full-length pol b (two helix-hairpin-helix
motifs and a pol X domain) [14]. Pol b is the smallest
known DNA polymerase in mammalian cells, contain-
ing 335 amino-acid residues with a molecular mass of
39 kDa, and its structure is highly conserved among
mammals [15]. Pol b has two domains with apparent
flexibility at a protease-sensitive region between residues
82–86. Trypsin treatment produced an N-terminal
8-kDa domain fragment, which retained binding affinity
for ssDNA, and a C-terminal 31-kDa domain fragment
with reduced DNA polymerase activity. The crystal
structure of the full-length pol b [16] and the solution
structure of the 8-kDa domain of pol b have been repor-
ted [17]. The crystal structure of the pol b-DNA com-
plex has also been determined, and it reveals important
structure-function relationships governing the processes
of DNA polymerization and DNA repair [18,19]. Pol b
is one of the most intensively investigated polymerases,
particularly among those present in eukaryotic cells.
We have determined the binding sites for two types of
pol b inhibitors, nervonic acid (NA) (Fig. 1E) and litho-
cholic acid (LA) by NMR experiments [20,21]. These
inhibitors bound to the 8-kDa domain of pol b and dis-
turbed its binding to the template-primer DNA. In this
study, we examine the structural interactions of SQMG
with rat pol b and discuss the inhibitory action of
SQMG against pol b, comparing this with mechanisms
of other inhibitors. It is hoped that these studies will aid
efforts to design more effective inhibitors of pol b.
Results and Discussion
Effects of two SQMGs and NA on the activity
of rat DNA polymerase b
In this study, we examine two types of SQMG, whose
fatty acid moieties occur at C
14
and C
18
, respectively.
As shown in Fig. 1, SQMG(C
14:1
) bears a myristoleic
acid (MA) (Fig. 1F) on the glycerol moiety, and
SQMG(C
18:1
) bears an oleic acid on the glycerol moiety.
Figure 2A shows the inhibitory dose–response curves of
SQMG(C
18:1
), SQMG(C
14:1
) and NA against pol b.We
measured the DNA polymerization activity under the
same condition in order to make precise comparisons
between these inhibitors. IC
50
values of SQMG(C
18:1
),
SQMG(C
14:1
) and NA were determined to be 0.8, 1.8
and 5 lm, respectively. SQMG(C
18:1
) inhibited pol b
activity more strongly than SQMG(C
14:1
). The inhibi-
tory effect of SQMG showed a similar tendency to that
of fatty acid [1]. The hydrophobic interaction is import-
ant for binding, as the difference of SQMG(C
14:1
) and
SQMG(C
18:1
) is only in the length of the fatty acid moi-
ety. The inhibitory effect of SQMG was greater than
that of NA. The molecular lengths of SQMG(C
18:1
),
SQMG(C
14:1
) and NA are about 32.0, 27.0 and 28.4 A
˚
,
respectively, as derived from computer models. The
molecular size of SQMG(C
14:1
) was very similar to that
of NA. The difference in the inhibitory potency of
O
H
HO
H
HO
H
O
OH
H
H
SO
3
H
HO
O
O
O
H
HO
H
HO
H
O
OH
H
H
SO
3
H
HO
O
O
O
H
HO
H
HO
H
O
OH
H
H
SO
3
H
HO
OH
C
HO
O
A
B
C
D
E
F
O
H
HO
H
HO
H
OH
OH
H
H
OH
C
HO
O
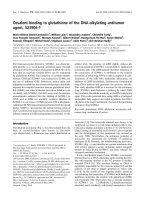
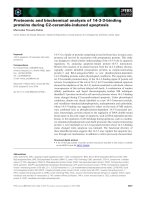
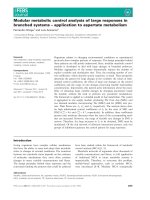
Fig. 1. Chemical structures of the compounds (A) sulfoquino-
vosylmonoacylglycerol [SQMG(C
14:1
)], (B) sulfoquinovosylmono-
acylglycerol [SQMG(C
18:1
)], (C) sulfoquinovosylglycerol (SQG), (D)
D-glucose, (E) nervonic acid (NA) and (F) myristoleic acid (MA).
Interaction mode between SQMG and DNA Pol b N. Kasai et al.
4350 FEBS Journal 272 (2005) 4349–4361 ª 2005 FEBS
SQMG and NA can be attributed to the relative hydro-
phobicity of the sulfoquinovosyl moiety vs. the hydroxyl
moiety.
Mode of DNA polymerase b inhibition by SQMG
and NA
In order to elucidate the inhibition mechanism, the
extent of inhibition as a function of DNA template-
primer or dNTP substrate concentrations was studied
(Table 1). SQMG(C
18:1
) influenced the activities more
strongly than did SQMG(C
14:1
); Table 1 shows a
kinetic analysis of the inhibitors. In this analysis,
poly(dA) ⁄ oligo(dT)
12)18
and dTTP were used as the
DNA template-primer and dNTP substrate, respect-
ively. Double reciprocal plots of the results show that
all of the inhibitors tested for pol b activity competed
with the DNA template and the substrate (Table 1). In
the case of the DNA template-primer, the apparent
maximum velocity (V
max
) was unchanged at 111 pmolÆ
0
20
40
60
80
100
0246810
Compound (µM)
C
B
A
DNA polymerase β activity (%)
0.15 nmol
SQMG(C
14:1
)
conc.
start
DNA + pol β
complex
M13 ssDNA
DNA + 8-kDa domain
complex
0.15 nmol
Lane 1 2 3 4 5 6 7 8 9 10
I/P - 0 0.1 1 10 - 0 0.1 1 10
8-kDa domain
full-length pol β
0.5 pmol 1.5 pmol
Lane
I/P
17 me
r
20 me
r
1
100
2
10
3
1
4
0
5
100
6
0
SQMG(C
14:1
)
conc.
full-length pol β 31-kDa domain
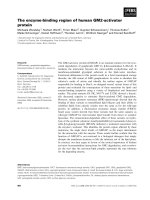
Fig. 2. (A) Dose–response curves of SQMG(C
14:1
) and SQMG(C
18:1
) and nervonic acid. Rat DNA polymerase b (0.05 units) was preincubated
with the indicated concentrations (0–10 l
M) of SQMG(C
14:1
)(j), SQMG(C
18:1
)(d)orNA(n). DNA polymerase activity in the absence of
added compounds was taken to be 100%. (B) Gel mobility shift analysis. Gel mobility shift analysis of binding between M13 ssDNA and
DNA polymerase b. M13 plasmid ssDNA (2.2 nmol; nucleotide, single strand and singly primed) was mixed with purified proteins and
SQMG(C
14:1
). Lanes 2–5 contained the full-length DNA polymerase b at a concentration of 7.5 lM; lanes 7–10 contained the 8-kDa domain
at a concentration of 7.5 l
M; lanes 1 and 6 contained no protein. Lanes 2, 3, 4, 5, 7, 8, 9 and 10 were mixed with various concentrations of
SQMG(C
14:1
). The concentrations were as follows: lanes 2 and 7, lanes 3 and 8, lanes 4 and 9, and lanes 5 and 10 were zero, 0.75, 7.5 and
75 l
M, respectively. (C) Analysis of the poly(dA) ⁄ oligo(dT)
16
template ⁄ primer synthetic products. DNA synthetic reactions were carried out
with 20 l
M poly(dA) ⁄ oligo(dT)
16
(¼ 2 ⁄ 1) and 20 lM [
32
P]dTTP[aP] (60 CiÆmmol
)1
), and the products were examined by gel electrophoresis
and imaging analysis as described in the Experimental procedures section. The protein concentrations were as follows: lanes 1–4, 25 n
M of
the full-length DNA polymerase b; lanes 5 and 6, 75 n
M of the 31-kDa domain. SQMG(C
14:1
) concentrations were as follows: lanes 1–6 were
2500, 250, 25, 0, 7500 and 0 n
M, respectively. Markers indicate the positions of the extended primer.
N. Kasai et al. Interaction mode between SQMG and DNA Pol b
FEBS Journal 272 (2005) 4349–4361 ª 2005 FEBS 4351
h
)1
, whereas 242% and 493% increases in the Michael-
is constant (K
m
) were observed in the presence of 1 and
2 lm SQMG(C
14:1
), respectively (Table 1). The V
max
for the dNTP substrate was 62.5 pmolÆh
)1
, and the K
m
for the substrate increased from 3.05 to 20.0 lm in the
presence of 2 lm SQMG(C
14:1
) (Table 1). The inhibitor
constant (K
i
) values, obtained from Dixon plots, were
found to be 0.89 lm and 2.8 lm in the presence of
2mm for the DNA template-primer and the dNTP sub-
strate, respectively (Table 1). Similarly, the K
i
values of
SQMG(C
18:1
) were found to be 0.42 lm and 1.44 l m
for the DNA template-primer and dNTP substrates,
respectively, and the K
i
values of NA were found to be
4.0 lm and 3.5 lm for the DNA template-primer and
dNTP substrates, respectively. All of the pol b inhibi-
tors examined competed with both the DNA template-
primer and the dNTP substrate.
Binding analysis comparing SQMG and the
N-terminal 8-kDa domain of pol b by a gel
mobility shift assay
We investigated the interaction between the 8-kDa
domain of pol b and SQMG in detail. The DNA binding
activity of the 8-kDa domain was analyzed using a gel
mobility shift assay. Figure 2B shows results of a gel
mobility shift assay demonstrating M13 single stranded
DNA (ssDNA) binding to the full-length pol b (lane 2),
as well as to the 8-kDa domain (lane 7). The full-length
pol b and the 8-kDa domain formed complexes with the
M13 ssDNA, leading to changes in the DNA mobility
that appeared as shifts in its position. However, the
31-kDa domain, the polymerization domain without a
DNA-binding site, was not shifted [23]. SQMG(C
14:1
)
interfered with complex formation between M13 ssDNA
and pol b (left panel) and between M13 ssDNA and the
8-kDa (right panel) to the same extent. The molecular
ratios of SQMG(C
14:1
) (I) and the proteins (P) are repre-
sented by I ⁄ P in Fig. 2B. The interference by
SQMG(C
14:1
) is shown with the I ⁄ P ratios in lanes 2, 3,
4 and 5, and in lanes 7, 8, 9 and 10 of 0, 0.1, 1 and 10,
respectively. The interference by SQMG(C
14:1
) was
nearly complete at an I ⁄ P ratio of 1, and it disappeared
at the ratio of 0.1, suggesting that one molecule of
SQMG(C
14:1
) competed with one molecule of M13
ssDNA and subsequently interfered with the binding of
DNA to the full-length pol b or to the 8-kDa domain.
The results of the gel mobility shift assay using
SQMG(C
18:1
) instead of SQMG(C
14:1
) were similar
(data not shown).
Table 1. Kinetic analysis of the inhibitory effects of sulfoquinovosylmonoacylglycerols (SQMG(C
14:1
), SQMG(C
18:1
)) and NA on the activities
of DNA polymerase b, as a function of the DNA template-primer and the nucleotide substrate concentrations. Rat DNA polymerase b was
0.05 units.
Compound Substrate conc. (l
M) Compound (lM) K
m
a
(pmoÆh
)1
) V
max
a
K
i
b
(lM) Inhibitory mode
a
SQMG(C
14:1
)
DNA template-primer
c
0 6.74 111 0.89 Competitive
116.3
233.2
Nucleotide substrate
d
0 3.05 62.5 2.8 Competitive
1 4.95
220.0
SQMG(C
18:1
)
DNA template-primer 0 6.74 111 0.42 Competitive
0.5 18.4
134.8
Nucleotide substrate 0 3.05 62.5 1.44 Competitive
0.5 6.34
123.5
NA
DNA template-primer 0 6.74 111 4.0 Competitive
417.2
631.0
Nucleotide substrate 0 3.05 62.5 3.5 Competitive
4 4.80
618.7
a
From Lineweaver–Burke plot.
b
From Dixon plot.
c
Poly (dA) ⁄ oligo(dT)
12)18
.
d
dTTP.
Interaction mode between SQMG and DNA Pol b N. Kasai et al.
4352 FEBS Journal 272 (2005) 4349–4361 ª 2005 FEBS
Product analysis after DNA synthesis on
poly(dA) ⁄ oligo(dT)
We examined whether the catalytic activity on the
31-kDa domain was inhibited by SQMG. The 31-kDa
domain can bind to the DNA template-primer
(although weakly), and it retains the DNA polymeriza-
tion activity. We used poly(dA)oligo(dT)
16
as the tem-
plate-primer, and analyzed newly synthesized DNA
fragments produced by the 31-kDa domain (Fig. 2C).
The reaction products in vitro were investigated by
using denaturing polyacrylamide gel electrophoresis.
Figure 2C shows the products formed by the full-
length pol b (lanes 1–4) or the 31-kDa domain (lanes
5–6). It is known that DNA polymerase b is a distribu-
tive enzyme [24], which adds a single nucleotide and
then dissociates from the template-product complex.
The 31-kDa domain can replicate DNA in a similar
manner to the full-length pol b.
Within a 10-minute incubation period, most of the
primers were elongated (lane 4). With 1.5 pmol of the
31-kDa domain, DNA replication was observed (lane
6). The 8-kDa domain fragment was incapable of repli-
cating DNA [23]. At an I ⁄ P ratio of more than 10,
SQMG(C
14:1
) (lanes 1–2) completely suppressed DNA
polymerization by the full-length pol b.AtanI⁄ P ratio
of 1 for the protein (lane3), DNA synthesis hardly
occurred. However, the 31-kDa domain synthesized
DNA without interference from SQMG(C
14:1
) (lane 5).
At the range of the SQMG(C
14:1
) concentrations that
influence the template-primer-binding site on the 8-kDa
domain, SQMG(C
14:1
) is thus thought to indirectly inhi-
bit DNA polymerization at the 31-kDa catalytic site
because the site lacks a template-primer, and it is also
thought to compete with the substrate. The results of
the products analysis using SQMG(C
18:1
) instead of
SQMG(C
14:1
) were similar (data not shown).
Biochemical characterization of fragments
of SQMG
To determine the inhibitory mechanism of pol b
by SQMG(C
14:1
), two separated fragments of
SQMG(C
14:1
), the sulfoquinovosylglycerol (SQG)
(Fig. 1C) moiety and the myristoleic acid (MA) moiety,
were prepared. SQG weakly inhibited the DNA poly-
merization activity of pol b with the IC
50
value of
7.95 mm (Fig. 3A). The inhibition dose–response curves
of SQG and MA against pol b were shown in Fig. 3B.
In the range of 0–1 mm, SQG did not influence pol b
activity, although MA inhibited it with the IC
50
value
of 375 lm. The inhibitory effect of a mixture of SQG
and MA was stronger than that of SQG or MA, and
the IC
50
value was 120 lm. When SQG was present in
the polymerase reaction mixture, the MA inhibitory
effect on pol b was approximately 2.6-fold stronger.
The pol b inhibitory effect of SQMG(C
14:1
) was stron-
ger than that of a mixture of SQG and MA (Fig. 3B).
An excessive amount of SQG or MA (i.e. I ⁄ P ¼ 10)
did not inhibit the ssDNA binding activity of the
8-kDa domain of pol b (Lanes 3 and 4 of Fig. 3C). On
the other hand, a mixture of SQG and MA inhibited
the activity (Lane 5 of Fig. 3C). As the mode of the
pol b inhibition by SQG and MA was competitive
against both DNA template-primer and dNTP sub-
strate (data not shown), it was suggested that a mix-
ture of SQG and MA could also competitively inhibit
the binding activity of DNA template-primer. These
results suggested that the SQG moiety could enhance
the inhibitory activities of the DNA polymerization
and ssDNA binding by MA.
NMR experiment to determine the interaction
interface between SQMG(C
14:1
) and the 8-kDa
domain
A titration experiment using the 8-kDa domain and a
1mm stock solution of SQMG(C
14:1
) was performed as
follows. Two-dimensional
1
H-
15
N HSQC spectra of the
8-kDa domain-SQMG(C
14:1
) complex at SQMG(C
14:1
)
concentrations of 0.05, 0.1, 0.15 and 0.2 mm were
recorded. As the concentration of SQMG(C
14:1
)
increased, the cross-peaks of the 8-kDa domain broad-
ened. At an SQMG(C
14:1
) concentration of 0.1 mm,
most of the cross-peaks disappeared and some broad
cross-peaks appeared at 7.8–8.5 p.p.m. SQMG(C
14:1
)
may aggregate at the millimolar concentration required
for NMR experiments, and the 8-kDa domain may
interact with micelle-like forms of SQMG(C
14:1
) [25].
If the experiment could be carried out at micromolar
concentrations, SQMG(C
14:1
) would not aggregate, as
SQMG(C
14:1
) inhibited the DNA polymerization activ-
ity of the full-length pol b but not the 31-kDa domain.
This finding indicated that pol b was not denatured by
surface-active effects of SQMG(C
14:1
). Consequently,
the NMR relaxation time shortening was due to the
increase of the apparent molecular weight, leading to
the appearance of cross-peaks of unstructured residues.
For this reason, we could not directly identify the
SQMG(C
14:1
) interaction interface of the 8-kDa
domain. To avoid the aggregation of SQMG, we used
chemically synthesized SQG, which did not bind the
fatty acid moiety.
The fragment linking method is commonly used in
the NMR-based drug design process [26]. A strongly
binding compound can be synthesized by combining
N. Kasai et al. Interaction mode between SQMG and DNA Pol b
FEBS Journal 272 (2005) 4349–4361 ª 2005 FEBS 4353
several low affinity compounds with different binding
sites for a target protein. By applying this fragment
linking method inversely, we attempted to identify the
interaction interface of SQMG with the 8-kDa domain.
Firstly, we determined the interaction interfaces of the
SQG and fatty acid separately. We then combined
these two interaction interfaces and identified the
SQMG interaction interface of the 8-kDa domain.
Analysis of the SQG interface with the 8-kDa
domain by NMR chemical shift changes
The solution structure of the 8-kDa domain has been
determined by Mullen et al. [17]. According to their
results, the 8-kDa domain (residues 1–87) formed four
a-helices packed as two antiparallel pairs. The pairs of
a-helices crossed each other at 60°, producing a V-like
shape. The 8-kDa domain contains a helix-hairpin-helix
motif that is classified as a DNA binding domain. There
is a hydrophobic region between helix-1 and helix-2.
The 8-kDa domain was titrated with a 1 m stock
solution of SQG. Two-dimensional
1
H-
15
N HSQC
spectra were recorded for the 8-kDa domain-SQG
complex at SQG concentrations of 10, 30, 60 and
100 mm. The pol b-SQG complex was in the fast
exchange region on the NMR time scale, permitting us
to follow the chemical shift changes of the backbone
NH and
15
N signals of the 8-kDa domain upon
complex formation. This was achieved by recording a
series of
1
H-
15
N HSQC spectra of the uniformly
15
N-
labeled 8-kDa domain in the presence of increasing
amounts of SQG. Of the 80 amides in residues 6–87
of the 8-kDa domain, 76 amides were assigned in
the SQG complex using the CBCA(CO)NH and
HNCACB spectra to confirm the reported assignments
[17]. NH and
15
N chemical shift differences along the
amino-acid sequence of the 8-kDa domain in the pres-
ence of 100 mm SQG are indicated in Fig. 4.
The residues displaying chemical shift changes upon
binding to SQG in the structure of the 8-kDa domain
with or without SQG are shown in Fig. 5A. The surfa-
ces of residues with NH chemical shift changes in the
range of 0.02–0.03 p.p.m and
15
N chemical shift chan-
ges of 0.15–0.25 p.p.m. (A6, T10, L11, G13, V20, L22,
0
20
40
60
80
DNA polymerase β activity (%)
100
SQG (mM)
0 20 40 60 80 100
0
20
40
60
80
DNA polymerase β a
ctivity (%)
100
Compound (mM)
0 0.2 0.4 0.6 0.8 1
AB
C
8-kDa domain
7.5 µM
Lane 1 2 3 4 5
I/P - 0 10 10 10
SQG
MA
SQG+MA
M13 ssDNA
DNA+8-kDa domain
complex
start
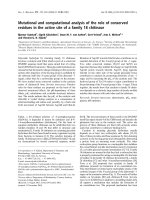
Fig. 3. (A) Dose–response curve of SQG.
Rat DNA polymerase b (0.05 units) was pre-
incubated with the indicated concentrations
(0–100 m
M) of SQG. DNA polymerase activ-
ity in the absence of added compounds was
taken to be 100%. (B) Dose–response
curves of SQG, MA, and a mixture of SQG
and MA.Rat DNA polymerase b (0.05 units)
was preincubated with the indicated con-
centrations (0–1 m
M) of SQG (d), MA (n)or
a mixture of SQG and MA (s). The DNA
polymerase activity in the absence of added
compounds was taken to be 100%. (C) Gel
mobility shift analysis. Gel mobility shift ana-
lysis of binding between M13 ssDNA and
the 8-kDa domain of pol b. M13 plasmid
ssDNA (2.2 nmol; nucleotide, single strand
and singly primed) was mixed with purified
proteins and SQMG(C
14:1
). Lanes 2–5 con-
tained the 8-kDa domain at a concentration
of 7.5 l
M; lanes 1 contained no protein. The
compounds (75 l
M each) were as follows:
lanes 3, 4, and 5 were SQG, MA, and a mix-
ture of SQG and MA, respectively.
Interaction mode between SQMG and DNA Pol b N. Kasai et al.
4354 FEBS Journal 272 (2005) 4349–4361 ª 2005 FEBS
F25, K27, N28, Q31, Y36, N37, V45, K60, L62, G64,
D74, L77, L82 and K84) are colored yellow. Those
with NH chemical shift changes of 0.03–0.04 p.p.m
and
15
N chemical shift changes of 0.25–0.35 p.p.m.
(N24, V29, S30, I33, Y39 and I69) are colored orange.
NH chemical shift changes exceeding 0.04 p.p.m and
15
N chemical shift changes exceeding 0.35 p.p.m. (E9,
A23, E26, K35, H51, G66, A70, R83 and L85) are
colored red.
In the presence of SQG, the cross-peaks were shifted
as follows: A6, E9 and L11 were in the unstructured
segment. G13, V20, L22, A23, N24, F25, E26, K27
and N28 were in helix-1; V29, S30 and Q31 were in
the loop between helix-1 and helix-2; I33, K35, Y36
and N37 were in helix-2; H51 was in the loop between
helix-2 and helix-3; K60 and L62 were in helix-3; G64
and G66 were in the loop between helix-3 and helix-4;
I69, A70, D74 and L77 were in helix-4; L82, R83, K84
and L85 were in the unstructured linker segment that
connected to the 31-kDa catalytic domain. The
N- (residues 1–10) and C-termini (residues 83–87) were
disordered, as judged from the heteronuclear
15
N-{
1
H}
NOE data (values < 0.4) [17]. As the chemical shifts
of the residues in the disordered regions are changed
easily by minor changes in the environment (buffer,
etc.), we excluded the residues in the disordered
regions from our analysis. These chemical shift chan-
ges could be explained in terms of SQG contact and
perturbations of the electrostatic charge distribution at
the surface. Surface residues displaying chemical shift
changes were predominantly, although not entirely,
clustered at two sites of the 8-kDa domain (Fig. 5A),
e.g. Site I: L22, F25, E26, N28, I33, K35, N37 and
Y39, and Site II: K60, L62, G64, G66 and A70.
The cross-peak for K35 at Site I was sufficiently
resolved during the titration to determine the mole
fraction of protein bound to SQG. The backbone
amide proton of K35 displayed a long chemical shift
change upon complex formation. The change in the
chemical shift of the K35 resonance was interpreted as
resulting from an average (d
av
) of the chemical shifts
for the free and the bound forms (d
b
) of the K35
resonance. Similarly, the K
D
value was determined by
the chemical shift change of G66 at Site II. Assuming
that SQG binds to the 8-kDa domain as a 2 : 1 com-
plex with each site having the same affinity, the K
D
values determined by K35 and G66 were 59 and
79 mm, respectively (Fig. 6). The average K
D
value
was 69 mm. We have reported that the K
D
value of
NA was 1.02 mm [20]. Linking of two moieties that
each has a millimolar affinity has been reported to cre-
ate a compound with a micromolar affinity [26]. Thus,
it was reasonable that the inhibitor constant (K
i
)
values of SQMG(C
14:1
) and SQMG(C
18:1
) were found
to be 0.89 lm and 0.42 lm, respectively (Table 1). In
order to determine whether or not the chemical shift
change induced by SQG was specific, the 8-kDa
A
B
C
Fig. 4. Chemical shift changes of HN and
15
N for the pol b 8-kDa
domain upon complex formation with SQG. (A) Overlay of the
1
H-
15
N HSQC spectra of the
15
N-labeled N-terminal 8-kDa domain
of pol b (0.1 m
M) in the absence (blue) and presence (red) of
100 m
M SQG. (B and C) Chemical shift changes, |D
1H
| (panel B) and
|D
15N
| (panel C), are plotted vs. residue number, where D
1H
and
D
15N
are the differences in p.p.m. between the free and bound
chemical shifts.
N. Kasai et al. Interaction mode between SQMG and DNA Pol b
FEBS Journal 272 (2005) 4349–4361 ª 2005 FEBS 4355
domain was titrated with d-glucose (Fig. 1D) at con-
centrations of 10, 50 and 100 mm. d-glucose is a pyra-
nose, as is SQG, but it possesses neither a sulfonyl nor
a glycerol moiety. No NH or
15
N chemical shift chan-
ges were observed upon addition of d-glucose. There-
fore, the interaction of SQG with the 8-kDa domain
was specific.
Analysis of the SQMG binding site on the pol b
8-kDa domain
We determined the interaction interface between fatty
acids and the 8-kDa domain of pol b in the previous
report [20]. We analyzed the binding site of SQMG
based on the results of the NMR chemical shift map-
pings of SQG (Fig. 5A) and the fatty acid (Fig. 5B)
[20]. We propose two possible models of the SQMG-
pol b complex. We constructed both models of the
complex between the 8-kDa domain and SQMG based
on the following analysis (Fig. 7).
In the first model (hereafter referred to as Model A),
the sulfoquinovosylglycerol moiety of SQMG interacts
with the 8-kDa domain at Site I and the alkyl moiety
of SQMG interacts with the C-terminus of helix-4 (Site
III). In the model of the fatty acid complex with the
8-kDa domain, the carboxyl moiety of the fatty acid
interacts with Site I and the alkyl moiety interacts at
Site III (Fig. 7A). There is a hydrophobic region
between helix-1 and helix-2 (Fig. 5C). There is an over-
lap at Site I in the interaction interfaces of SQG and
the fatty acid. In Model A, the sulfoquinovosylglycerol
moiety of SQMG is bound to Site I instead of the
carboxyl moiety of the fatty acid, and the alkyl moiety
binds to Site III.
F25
F25
V29
V29
K35
K35
D74
D74
L77
L77
H51
H51
E26
E26
A70
A70
G66
G66
G64
G64
K60
K60
I33
I33
L62
L62
Q31
Q31
K27
K27
Site I
Site I
Site II
Site II
K35
K35
E26
E26
Y39
Y39
S30
S30
Q31
Q31
N24
N24
F25
F25
V29
V29
N28
N28
L22
L22
K60
K60
D74
D74
Site I
Site I
V29
V29
K35
K35
D74
D74
L77
L77
H51
H51
E26
E26
I33
I33
K52
K52
T79
T79
K35
K35
E26
E26
Y39
Y39
S30
S30
V29
V29
L22
L22
D74
D74
H51
H51
F76
F76
G80
G80
K52
K52
T79
T79
L77
L77
Site III
Site III
Site I
Site I
F25
F25
V29
V29
K35
K35
D74
D74
L77
L77
H51
H51
E26
E26
A70
A70
G66
G66
G64
G64
K60
K60
I33
I33
L62
L62
Q31
Q31
K27
K27
K52
K52
T79
T79
K35
K35
E26
E26
Y39
Y39
S30
S30
Q31
Q31
N24
N24
F25
F25
V29
V29
N28
N28
L22
L22
K60
K60
D74
D74
H51
H51
F76
F76
G80
G80
K52
K52
T79
T79
L77
L77
K35
K35
F25
F25
K60
K60
E71
E71
K68
K68
K72
K72
I73
I73
I69
I69
G66
G66
Site III
Site III
Site I
Site I
90
o
F25
F25
K35
K35
G64
G64
K60
K60
L62
L62
E71
E71
K72
K72
K68
K68
G66
G66
A
B
C
D
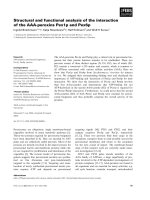
Fig. 5. Interaction interfaces between DNA polymerase b and SQG,
fatty acid and ssDNA, and hydrophobicity representation; the N-ter-
minal (1–10) and C-terminal (81–87) unstructured regions were
removed for clarity. (A) Interaction interface between SQG and the
8-kDa domain. The amino-acid residues of the major shifted cross-
peaks from the
1
H-
15
N HSQC spectra are indicated. NH chemical
shift changes of 0.02–0.03 p.p.m and
15
N chemical shift changes of
0.15–0.25 p.p.m. are depicted in yellow. NH chemical shift changes
of 0.03–0.04 p.p.m and
15
N chemical shift changes of 0.25–
0.35 p.p.m. are indicated in orange. NH chemical shift changes of
more than 0.04 p.p.m and
15
N chemical shift changes of more than
0.35 p.p.m. are indicated in red. (B) Interaction interface between
fatty acids and the 8-kDa domain. The amino-acid residues of the
major shifted cross-peaks from the
1
H-
15
N HSQC spectra are indica-
ted in red. (C) These images show the hydrophobicity of the
molecular surfaces (i.e. blue is hydrophilic and red is hydrophobic).
These images were prepared using the computer program
INSIGHT II.
(D) Interaction interface between ssDNA and the 8-kDa domain. The
amino acid residues related to DNA binding are depicted in cyan.
0
0.01
0.02
0.03
0.04
0.05
0.06
020406080100
SQG (mM)
NH chemical shift difference (ppm)
Fig. 6. Determination of K
D
for SQG binding to the 8-kDa domain
of DNA polymerase b. Titration of SQG was performed to measure
the chemical shift change at the nondegenerate K35 (diamonds)
and G66 (triangles) NH in
1
H-
15
N HSQC spectra at 750 MHz
(25 °C). The average K
D
value of SQG was 69 mM.
Interaction mode between SQMG and DNA Pol b N. Kasai et al.
4356 FEBS Journal 272 (2005) 4349–4361 ª 2005 FEBS
We examined the general binding mode of the sulfo-
nyl moiety by analysis of crystal structures of com-
plexes between proteins and sugars containing the
sulfate moiety. We analyzed 35 crystal structures
deposited in the PDB, which were collected based on
the criteria listed in a previous report [27]. The sulfonyl
moieties interacted with the sidechain of arginine and
lysine in 12 and 10 crystal structures, respectively. This
implies that the sulfoquinovosylglycerol moiety of
SQMG would interact with residues in Site I. K35 is
the only basic amino-acid residue in Site I and the NH
chemical shift of K35 was greatly changed by addition
of SQG. Thus, the sulfonyl moiety of SQMG may
form a salt bridge to the amino moiety of the side-
chain of K35. The hydroxyl moieties of the sugar of
SQMG might interact with the sidechain carboxyl moi-
ety of E26. The NH chemical shift of E26 was also
changed greatly by addition of SQG.
In the second model (hereafter referred to as Model
B), the sulfoquinovosylglycerol moiety of SQMG inter-
acted with the 8-kDa domain at Site II and the alkyl
moiety of SQMG interacted at Site III (Fig. 7B). At
Site II, the residues in which NH or
15
N chemical shift
were greatly changed were G66, I69 and A70, which
does not possess any amino moiety. The survey of
crystal structures showed that the sulfonyl moieties
interacted with the backbone amide in 10 out of 35
crystal structures. Thus, the sulfonyl moiety of SQMG
might bind to the backbones of these residues, as
shown in this model.
To examine which is a more reasonable model, we
performed a mutational analysis of pol b. We altered
four residues whose chemical shifts were greatly chan-
ged by addition of SQG. In Site I, we mutated E26
and K35 to alanine to remove the charged moieties of
the sidechains. In Site II, we altered G66 and A70 to
proline to remove the backbone amide protons. All the
mutants of pol b retained the DNA polymerization
activity. We measured the SQMG(C
14:1
) inhibitory
effects of the DNA polymerization activity against
these four mutants (Table 2). The IC
50
value of
SQMG(C
14:1
) against the wild type pol b protein was
1.8 lm. On the other hand, the IC
50
values against the
E26A, G66P and A70P mutants were determined to be
10.6, 89.2 and 11.8 lm, respectively, whereas that
against the K35A mutant was more than 200 lm.As
the inhibitory effects of SQMG(C
14:1
) on all the
mutants decreased significantly, these four residues
may be involved in the interaction with SQMG(C
14:1
).
The SQMG(C
14:1
) inhibitory effect on the G66P
mutant was approximately 50-fold weaker compared
to that of the wild type pol b protein. Moreover, the
IC
50
value against the K35A mutant was more than
two times that against the G66P mutant. The K35A
mutant was influenced most weakly among the four
mutants. Therefore, these results suggested that Model
K35
A
B
F25
G66
A70
Fig. 7. Possible structures of the complex formed between the
8-kDa domain and SQMG(C
14:1
).The sulfurs, carbons, oxygens, and
hydrogens in the inhibitor structures are indicated in orange, green,
red, and white, respectively. (A) Model A. SQMG(C
14:1
) binds to
the 8-kDa domain of pol b at Site I and Site III. The molecular orien-
tation of pol b-SQMG(C
14:1
) is almost the same as that in Fig. 5 in
the left column image. (B) Model B. SQMG(C
14:1
) binds to the
8-kDa domain at Site II and Site III. The molecular orientation of pol
b-SQMG(C
14:1
) is almost the same as that in Fig. 5 in the right col-
umn image. These images were prepared using
PYMOL (DeLano Sci-
entific, CA, USA).
N. Kasai et al. Interaction mode between SQMG and DNA Pol b
FEBS Journal 272 (2005) 4349–4361 ª 2005 FEBS 4357
A may be more reasonable to represent the interaction
interface between SQMG(C
14:1
) and the 8-kDa
domain.
Proposed inhibitory mode of SQMG against pol b
Figure 5D shows the interaction interface of the
8-kDa domain with ssDNA. This model is based on
site-directed mutagenesis assays [28] and NMR experi-
ments [17]. According to the report of Prasad et al.
[28], point mutants at F25, K35, K60, and K68
showed impaired ssDNA binding activity. The NMR
experiment indicated which residues (K60, L62, G64,
G66, I69, E71, K72, I73 and R83) had NH chemical
shift changes over 0.2 p.p.m and
15
N chemical shift
changes over 1.0 p.p.m. upon addition of 5 mer-
ssDNA, p(dT)
8
or 9 mer-ssDNA [17]. In Model A,
SQMG competes with template DNA for binding to
Site I, and subsequently inhibits the template DNA
binding to the 8-kDa domain. Binding of SQMG to
K35 would disrupt its interaction with ssDNA. In
Model B, SQMG competes with template DNA for
binding to Site II. Subsequently, SQMG blocks bind-
ing of template DNA to pol b. In both models,
SQMG would prevent template DNA binding to the
8 kDa domain at Site I or Site II. Consequently,
SQMG would inhibit the DNA polymerization activ-
ity of pol b.
We have previously reported the interaction inter-
face of lithocholic acid (LA) with the 8-kDa domain
of pol b [21]. LA binds to the 8-kDa domain at helix-3
and helix-4, but not at Site I. Many other inhibitors,
such as glycyrrhizic acid, bind to Site II [29]. Gly-
cyrrhizic acid would compete with template DNA for
binding to Site II of the 8-kDa domain. Most inhibi-
tors of pol b, whose interaction interfaces are known
thus far, bind competitively to the DNA binding site
of the 8-kDa domain. The hydrophilic part of SQMG
would interact with DNA binding site and compete
with DNA in a similar fashion, whereas the hydropho-
bic part of SQMG would bind to and then anchor at
Site III. Both hydrophobic and hydrophilic types of
affinity contribute to the formation of the SQMG-pol
b complex. SQMG(C
18:1
) showed a larger inhibitory
effect on pol b than did SQMG(C
14:1
). Their structural
difference was just in the length of the fatty acid moi-
ety. This suggests that the fatty acid moiety contributes
to the binding affinity to some extent. In the case of
fatty acids, the inhibitory effect increased in propor-
tion to the number of carbons comprising the alkyl
chain [1]. These three-dimensional structural models
could facilitate the design of more potent inhibitors for
DNA pol b.
SQMG inhibited not only pol b, but also pol a, pol
d, pol e, pol g, pol j, pol k and TdT [8]. It was sug-
gested that similar binding sites were present in these
mammalian polymerases. For example, they might
possess hydrophobic cores adjacent to DNA binding
sites where SQMG could interact. Their amino-acid
sequences differ, but they might have similar three-
dimensional structures. The binding site might be
essential for their DNA polymerase activity, and such
a region might have been conserved evolutionarily
among the mammalian polymerases. Low molecular
weight organic compounds may prove useful as
molecular probes to investigate the structural homo-
logy and the structure-function relationships of
enzymes whose three-dimensional structures are as yet
unknown.
Experimental procedures
Materials
Sulfoquinovosylmonoacylglycerol and sulfoquinovosylglyc-
erol were chemically synthesized according to our previ-
ously reported method [12]. NA was purchased from
Sigma (St Louis, MO, USA), and
15
N-NH
4
Cl was pur-
chased from Cambridge Isotope Laboratory (Andover,
MA, USA). Nucleotides and chemically synthesized tem-
plate-primers such as poly(dA), poly(rA), oligo(dT)
12)18
,
and oligo(dT)
16
were purchased from Amersham Bio-
science (Uppsala, Sweden). The other reagents of ana-
lytical grade were purchased from Junsei Kagaku (Tokyo,
Japan).
DNA polymerase assays
Activity of pol b was measured by the methods described
previously [1,23,30]. For DNA polymerases, poly(dA) ⁄ oli-
go(dT)
12)18
and dTTP were used as DNA template-primer
Table 2. IC
50
values of SQMG(C
14:1
) against the DNA polymeriza-
tion activity of mutants of DNA polymerase b. SQMG(C
14:1
)was
incubated with each enzyme (0.05 units). The enzymatic activity
was measured as described under Experimental procedures.
Enzyme activity in the absence of the compound was taken as
100%.
Pol b IC
50
values of SQMG(C
14:1
)(lM)
Wild type 1.8
Mutants
E26A 10.6
K35A > 200
G66P 89.2
A70P 11.8
Interaction mode between SQMG and DNA Pol b N. Kasai et al.
4358 FEBS Journal 272 (2005) 4349–4361 ª 2005 FEBS
and nucleotide substrate, respectively. Inhibitors were dis-
solved in dimethyl sulfoxide (DMSO) at various concentra-
tions and sonicated for 30 s. Four lL of sonicated samples
were mixed with 16 lL of each enzyme (final 0.05 units) in
50 mm Tris ⁄ HCl (pH 7.5) containing 1 mm dithiothreitol,
50% glycerol and 0.1 mm EDTA, and kept at 0 °C for
10 min. These inhibitor-enzyme mixtures (8 l L) were added
to 16 lL of each of the enzyme standard reaction mixtures,
and incubation was carried out at 37 °C for 60 min. The
activity without the inhibitor was considered to be 100%,
and the remaining activities at each concentration of inhib-
itor were determined as percentages of this value. One unit
of each DNA polymerase activity was defined as the
amount of enzyme that catalyzes the incorporation of
1 nmol of deoxyribonucleotide triphosphates (i.e. dTTP)
into synthetic template-primers (i.e. poly(dA) ⁄
oligo(dT)
12)18
,A⁄ T ¼ 2 ⁄ 1) in 60 min at 37 °C under the
normal reaction conditions [1,23].
Gel mobility shift assay
The gel mobility shift assay was carried out as described by
Casas-Finet et al. [31]. The binding mixture (in a final vol-
ume of 20 lL) contained 20 mm Tris ⁄ HCl, pH 7.5, 40 mm
KCl, 50 lgÆmL
)1
bovine serum albumin (BSA), 10%
DMSO, 2 mm EDTA, M13 plasmid DNA (2.2 nmol; nuc-
leotide, single-strand and singly primed), and 0.15 nmol of
the full-length pol b or the 8-kDa domain of pol b. Various
concentrations of inhibitors were added to the binding
mixture, followed by incubation at 25 °C for 10 min.
Samples were run on a 1.0% agarose gel in 0.1 m Tris-
acetate buffer, pH 8.3, containing 5 mm EDTA at 50 V for
2h.
In vitro DNA synthesis on poly(dA) ⁄ oligo(dT)
For DNA synthesis, the reaction mixture (20 lL) contained
50 mm Tris ⁄ HCl, pH 7.5, 3 mm MgCl
2
,5mm dithiothrei-
tol, 10% methanol, 20 lm poly(dA) ⁄ oligo(dT)
16
(¼ 2 ⁄ 1),
20 lm [
32
P]dTTP[aP] (60 CiÆmmol
)1
), and the full-length
pol b or the 31-kDa domain of pol b. Various concentra-
tions of SQMG were dissolved in 100% methanol and then
added to the above reaction mixture, followed by incuba-
tion at 37 °C for 10 min. The products were precipitated
with 100% ethyl alcohol, and then washed with 70% ethyl
alcohol. Bromophenol blue was added to the precipitate,
which was then loaded onto a 15% polyacrylamide-7 m
urea gel (40 · 20 cm, 0.4 mm) in a buffer containing
6.7 mm Tris-borate, pH 7.5 and 1 mm EDTA [32]. The gel
was prerun for 1 h at 2000 V, and electrophoresis was per-
formed at 2000 V. After electrophoresis, the gel was dried
and then exposed to imaging plates for 30 min and scanned
with a Bio Imaging Analyzer BAS 2000 system (Fujifilm,
Tokyo, Japan).
Expression and purification of the mutant
proteins
The expression vectors of the mutant proteins were con-
structed by QuikChange II (Stratagene, La Jolla, CA,
USA). The full-length rat DNA pol b mutant proteins were
overexpressed in Escherichia coli strain BL21(DE3) harbor-
ing the expression plasmid pET28a. After Ni-NTA column
(Qiagen, Valencia, CA, USA) purification, following the
procedure recommended by the manufacturer, the mutant
proteins were purified on a Hi-Trap SP-Sepharose cation
exchange column (Amersham) by elution with a concentra-
tion gradient of 0–1 m potassium chloride.
Preparation of the isotope labeled 8-kDa domain
of pol b
For the NMR experiment, the 8-kDa domain of rat DNA
pol b (residue 1–87) was overexpressed in Escherichia coli
strain BL21(DE3) harboring the expression plasmid
pET21a grown on minimal media containing
15
NH
4
Cl
(0.5 gÆL
)1
) as the sole nitrogen source, to produce the uni-
formly
15
N-labeled protein. Protein expression was induced
at a D
600
¼ 0.6 by addition of IPTG to a final concentra-
tion of 1 mm. The 8-kDa domain was passed through a
DEAE-Sepharose column (Amersham) and then purified on
a Hi-Trap SP-Sepharose column by elution with a concen-
tration gradient of 0–1 m sodium chloride, and was then
further purified by a Superdex 75 gel filtration column
(Amersham). In preparing the NMR sample, the purified
8-kDa domain was dialyzed against 10 mm Tris ⁄ HCl buffer
(pH 7.0) and concentrated using an Amicon Ultra filter
(Millipore). The sample for the NMR experiment contained
0.1 mm of the
15
N-labeled 8-kDa domain.
NMR Analysis
All NMR experiments were carried out at 25 °C on Bruker
DMX600 and DMX750 (Rheinstetten, Germany) spectro-
meters. Each
1
H-
15
N HSQC spectrum size was 1024 points
in the t2 dimension and 256 points in the t1 dimension.
SQMG was titrated directly into the NMR samples con-
taining the 8-kDa domain of pol b at each titration point.
To confirm the chemical shift assignments of the 8-kDa
domain, 3D CBCA(CO)NH and HNCACB spectra were
recorded [33]. All the acquired data was processed using
the nmrpipe and pipp programs [34,35].
The titration curves were analyzed by nonlinear least-
square fitting to the following equations
d
ob
À d
f
¼ðd
sat
=½P
t
ÞfðK
D
þ½P
t
þ n½I
t
Þ
À½ðK
D
þ½P
t
þ n½I
t
Þ
2
À 4½P
t
n½I
t
1=2
g=2 ð1Þ
d
sat
¼ d
b
À d
f
ð2Þ
N. Kasai et al. Interaction mode between SQMG and DNA Pol b
FEBS Journal 272 (2005) 4349–4361 ª 2005 FEBS 4359
where d
ob
is the chemical shift of the protein at each titra-
tion point and d
f
is the chemical shift of the protein in the
absence of inhibitor, d
b
is the chemical shift of the protein
when fully bound by inhibitor, [P]
t
is the total concentra-
tion of the protein, [I]
t
is the total concentration of inhib-
itor, and n is the number of inhibitor binding sites on the
protein [36,37].
Structural models of the complex
Molecular docking of the 8-kDa domain of pol b and
SQMG was performed using the affinity program within
the insight ii software (Accelrys, San Diego, CA, USA).
The coordinates of the 8-kDa domain of pol b (Protein
Data Bank (PDB) ID: 1DK3) were obtained from PDB.
The initial position of SQG was determined based on the
result of chemical shift mapping. The calculation used an
ESFF force field in the discovery program and a Simula-
ted Annealing method in the affinity program (Accelrys).
Acknowledgements
We thank Dr S. Hanashima, Dr S. Kamisuki and Dr
K Matsumoto of Tokyo University of Science for
helpful discussion. We also thank Dr K. Morikawa,
Dr I. Ohki and Dr T. Kodama of BERI for helpful
discussion, and Dr C. Shionyu of BERI for helpful
support of database search.
References
1 Mizushina Y, Tanaka N, Yagi H, Kurosawa T, Onoue
M, Seto H, Horie T, Aoyagi N, Yamaoka M,
Matsukage A, Yoshida S & Sakaguchi K (1996) Fatty
acids selectively inhibit eukaryotic DNA polymerase
activities in vitro. Biochim Biophys Acta 1308, 256–262.
2 Ogawa A, Murate T, Suzuki M, Nimura Y & Yoshida
S (1998) Lithocholic acid, a putative tumor promoter,
inhibits mammalian DNA polymerase beta. Jpn J
Cancer Res 89, 1154–1159.
3 Mizushina Y, Kamisuki S, Kasai N, Ishidoh T,
Shimazaki N, Takemura M, Asahara H, Linn S, Yosh-
ida S, Koiwai O, Sugawara F, Yoshida H & Sakaguchi
K (2002) Petasiphenol: a DNA polymerase lambda inhi-
bitor. Biochemistry 41, 14463–14471.
4 Murakami C, Ishijima K, Hirota M, Sakaguchi K,
Yoshida H & Mizushina Y (2002) Novel anti-inflamma-
tory compounds from Rubus sieboldii, triterpenoids, are
inhibitors of mammalian DNA polymerases. Biochim
Biophys Acta 1596, 193–200.
5 Mizushina Y, Kamisuki S, Kasai N, Shimazaki N,
Takemura M, Asahara H, Linn S, Yoshida S, Matsuk-
age A, Koiwai O, Sugawara F, Yoshida H & Sakaguchi
K (2002) A plant phytotoxin, solanapyrone A, is an
inhibitor of DNA polymerase beta and lambda. J Biol
Chem 277, 630–638.
6 Mizushina Y, Kamisuki S, Mizuno T, Takemura M,
Asahara H, Linn S, Yamaguchi T, Matsukage A,
Hanaoka F, Yoshida S, Saneyoshi M, Sugawara F &
Sakaguchi K (2000) Dehydroaltenusin, a mammalian
DNA polymerase alpha inhibitor. J Biol Chem 275,
33957–33961.
7 Ohta K, Mizushina Y, Hirata N, Takemura M, Suga-
wara F, Matsukage A, Yoshida S & Sakaguchi K
(1998) Sulfoquinovosyldiacylglycerol, KM043, a new
potent inhibitor of eukaryotic DNA polymerases and
HIV-reverse transcriptase type 1 from a marine red
alga, Gigartina tenella. Chem Pharm Bull (Tokyo) 46,
684–686.
8 Mizushina Y, Xu X, Asahara H, Takeuchi R, Oshige
M, Shimazaki N, Takemura M, Yamaguchi T, Kuroda
K, Linn S, Yoshida H, Koiwai O, Saneyoshi M, Suga-
wara F & Sakaguchi K (2003) A sulphoquinovosyldi-
acylglycerol is a DNA polymerase epsilon inhibitor.
Biochem J 370, 299–305.
9 Sahara H, Ishikawa M, Takahashi N, Ohtani S, Sato
N, Gasa S, Akino T & Kikuchi K (1997) In vivo anti-
tumour effect of 3¢-sulphonoquinovosyl 1¢-monoacyl-
glyceride isolated from sea urchin (Strongylocentrotus
intermedius) intestine. Br J Cancer 75, 324–332.
10 Ohta K, Mizushina Y, Yamazaki T, Hanashima S,
Sugawara F & Sakaguchi K (2001) Specific interaction
between an oligosaccharide on the tumor cell surface
and the novel antitumor agents, sulfoquinovosylacylgly-
cerols. Biochem Biophys Res Commun 288, 893–900.
11 Ohta K, Hanashima S, Mizushina Y, Yamazaki T,
Saneyoshi M, Sugawara F & Sakaguchi K (2000)
Studies on a novel DNA polymerase inhibitor group,
synthetic sulfoquinovosylacylglycerols: inhibitory action
on cell proliferation. Mutat Res 467, 139–152.
12 Hanashima S, Mizushina Y, Yamazaki T, Ohta K,
Takahashi S, Sahara H, Sakaguchi K & Sugawara F
(2001) Synthesis of sulfoquinovosylacylglycerols,
inhibitors of eukaryotic DNA polymerase alpha and
beta. Bioorg Med Chem 9, 367–376.
13 Burgers PM, Koonin EV, Bruford E, Blanco L, Burtis
KC, Christman MF, Copeland WC, Friedberg EC,
Hanaoka F, Hinkle DC, Lawrence CW, Nakanishi M,
Ohmori H, Prakash L, Prakash S, Reynaud CA, Sugino
A, Todo T, Wang Z, Weill JC & Woodgate R (2001)
Eukaryotic DNA polymerases: proposal for a revised
nomenclature. J Biol Chem 276, 43487–43490.
14 Aravind L & Koonin EV (1999) DNA polymerase beta-
like nucleotidyltransferase superfamily: identification of
three new families, classification and evolutionary his-
tory. Nucleic Acids Res 27, 1609–1618.
15 Kornberg A & Baker T (1992) DNA Replication, 2nd
edn, pp. 197–225. W.H. Freeman, New York, USA.
Interaction mode between SQMG and DNA Pol b N. Kasai et al.
4360 FEBS Journal 272 (2005) 4349–4361 ª 2005 FEBS
16 Sawaya MR, Pelletier H, Kumar A, Wilson SH &
Kraut J (1994) Crystal structure of rat DNA polymerase
beta: evidence for a common polymerase mechanism.
Science 264, 1930–1935.
17 Maciejewski MW, Liu D, Prasad R, Wilson SH &
Mullen GP (2000) Backbone dynamics and refined solu-
tion structure of the N-terminal domain of DNA poly-
merase beta. Correlation with DNA binding and dRP
lyase activity. J Mol Biol 296, 229–253.
18 Sawaya MR, Prasad R, Wilson SH, Kraut J & Pelletier
H (1997) Crystal structures of human DNA polymerase
beta complexed with gapped and nicked DNA: evidence
for an induced fit mechanism. Biochemistry 36, 11205–
11215.
19 Pelletier H, Sawaya MR, Wolfle W, Wilson SH &
Kraut J (1996) Crystal structures of human DNA
polymerase beta complexed with DNA: implications for
catalytic mechanism, processivity, and fidelity. Biochem-
istry 35, 12742–12761.
20 Mizushina Y, Ohkubo T, Date T, Yamaguchi T,
Saneyoshi M, Sugawara F & Sakaguchi K (1999) Mode
analysis of a fatty acid molecule binding to the N-term-
inal 8-kDa domain of DNA polymerase beta. A 1: 1
complex and binding surface. J Biol Chem 274, 25599–
25607.
21 Mizushina Y, Ohkubo T, Sugawara F & Sakaguchi K
(2000) Structure of lithocholic acid binding to the
N-terminal 8-kDa domain of DNA polymerase beta.
Biochemistry 39, 12606–12613.
22 Hanashima S, Mizushina Y, Ohta K, Yamazaki T,
Sugawara F & Sakaguchi K (2000) Structure-activity
relationship of a novel group of mammalian DNA poly-
merase inhibitors, synthetic sulfoquinovosylacylglycer-
ols. Jpn J Cancer Res 91, 1073–1083.
23 Mizushina Y, Yoshida S, Matsukage A & Sakaguchi K
(1997) The inhibitory action of fatty acids on DNA
polymerase beta. Biochim Biophys Acta 1336,
509–521.
24 Abbotts J, SenGupta DN, Zmudzka B, Widen SG,
Notario V & Wilson SH (1988) Expression of human
DNA polymerase beta in Escherichia coli and character-
ization of the recombinant enzyme. Biochemistry 27,
901–909.
25 Matsumoto K, Takenouchi M, Ohta K, Ohta Y, Imura
T, Oshige M, Yamamoto Y, Sahara H, Sakai H, Abe M,
Sugawara F, Sato N & Sakaguchi K (2004) Design of
vesicles of 1,2-di-O-acyl-3-O-(beta-D-sulfoquinovosyl)
-glyceride bearing two stearic acids (beta-SQDG-C18), a
novel immunosuppressive drug. Biochem Pharmacol 68 ,
2379–2386.
26 Lepre CA, Moore JM & Peng JW (2004) Theory and
applications of NMR-based screening in pharmaceutical
research. Chem Rev 104, 3641–3676.
27 Shionyu Mitsuyama C, Shirai T, Ishida H & Yamane T
(2003) An empirical approach for structure-based pre-
diction of carbohydrate-binding sites on proteins.
Protein Eng 16, 467–478.
28 Prasad R, Beard WA, Chyan JY, Maciejewski MW,
Mullen GP & Wilson SH (1998) Functional analysis of
the amino-terminal 8-kDa domain of DNA polymerase
beta as revealed by site-directed mutagenesis. DNA
binding and 5¢-deoxyribose phosphate lyase activities.
J Biol Chem 273, 11121–11126.
29 Hu HY, Horton JK, Gryk MR, Prasad R, Naron JM,
Sun DA, Hecht SM, Wilson SH & Mullen GP (2004)
Identification of small molecule synthetic inhibitors of
DNA polymerase beta by NMR chemical shift map-
ping. J Biol Chem 279, 39736–39744.
30 Mizushina Y, Yagi H, Tanaka N, Kurosawa T, Seto H,
Katsumi K, Onoue M, Ishida H, Iseki A, Nara T, Mor-
ohashi K, Horie T, Onomura Y, Narusawa M, Aoyagi
N, Takami K, Yamaoka M, Inoue Y, Matsukage A,
Yoshida S & Sakaguchi K (1996) Screening of inhibitor
of eukaryotic DNA polymerases produced by microor-
ganisms. J Antibiot (Tokyo) 49, 491–492.
31 Casas Finet JR, Kumar A, Morris G, Wilson SH &
Karpel RL (1991) Spectroscopic studies of the structural
domains of mammalian DNA beta-polymerase. J Biol
Chem 266, 19618–19625.
32 Detera SD & Wilson SH (1982) Studies on the mechan-
ism of Escherichia coli DNA polymerase I large frag-
ment. Chain termination and modulation by
polynucleotides. J Biol Chem 257, 9770–9780.
33 Cavanagh J, Fairbrother WJ, Palmer AG III & Skelton
NJ (1996) Protein NMR Spectroscopy: Principles and
Practice. Academic Press, Inc, CA, USA.
34 Delaglio F, Grzesiek S, Vuister GW, Zhu G, Pfeifer J &
Bax A (1995) NMRPipe: a multidimensional spectral
processing system based on UNIX pipes. J Biomol
NMR 6, 277–293.
35 Garrett DS, Powers R, Gronenborn AM & Clore GM
(1991) A common sense approach to peak picking two-,
three- and four-dimensional spectra using automatic
computer analysis of contour diagrams. J Magn Reson
95, 214–220.
36 Cantor CR & Schimmel PR (1980) Biophysical Chemis-
try, Part III: the Behavior of Biological Macromolecules.
W.H. Freeman, NY, USA.
37 Freire E, Mayorga OL & Straume M (1990) Isothermal
titration calorimetry. Anal Chem 10, 2359–2367.
N. Kasai et al. Interaction mode between SQMG and DNA Pol b
FEBS Journal 272 (2005) 4349–4361 ª 2005 FEBS 4361