Báo cáo khoa học: The HS:1 serostrain of Campylobacter jejuni has a complex teichoic acid-like capsular polysaccharide with nonstoichiometric fructofuranose branches and O-methyl phosphoramidate groups pot
Bạn đang xem bản rút gọn của tài liệu. Xem và tải ngay bản đầy đủ của tài liệu tại đây (339.9 KB, 16 trang )
The HS:1 serostrain of Campylobacter jejuni has a complex
teichoic acid-like capsular polysaccharide with
nonstoichiometric fructofuranose branches and O-methyl
phosphoramidate groups
David J. McNally, Harold C. Jarrell, Jianjun Li, Nam H. Khieu, Evgeny Vinogradov,
Christine M. Szymanski and Jean-Robert Brisson
Institute for Biological Sciences, National Research Council of Canada, Ottawa, Ontario, Canada
The Gram-negative, spiral-shaped bacterium Campylo-
bacter jejuni is one of the leading causative agents of
human enteritis and surpasses Salmonella, Shigella and
Escherichia in some regions as the primary cause of
gastrointestinal disease [1,2]. Furthermore, there is a
growing body of evidence suggesting that infection
with C. jejuni is linked to the development of Guillain-
Barre
´
and Miller-Fisher neuropathies [3–5]. Although
the bacteria now recognized as members of the genus
Campylobacter were first described at the beginning of
the 20th century, public awareness remains limited and
much of the biology of Campylobacters and the mech-
anisms by which they cause disease are still relatively
poorly understood [1].
In recent years, the health and economic burden
associated with Campylobacter infection has fueled
interest for this genus and in 2000, the genome sequence
for C. jejuni NCTC 11168 (HS:2) was reported [6].
Keywords
Campylobacter jejuni; capsular
polysaccharide; CE-ESI-MS; HR-MAS NMR;
phosphoramidate
Correspondence
J R. Brisson, Institute for Biological
Sciences, National Research Council of
Canada, Ottawa, Canada, K1A 0R6
Fax: +1 613 9529092
Tel: +1 613 9903244
E-mail:
(Received 11 May 2005, revised 4 July
2005, accepted 11 July 2005)
doi:10.1111/j.1742-4658.2005.04856.x
Recently, the CPS biosynthetic loci for several strains of Campylobacter
jejuni were sequenced and revealed evidence for multiple mechanisms of
structural variation. In this study, the CPS structure for the HS:1 serostrain
of C. jejuni was determined using mass spectrometry and NMR at
600 MHz equipped with an ultra-sensitive cryogenically cooled probe. Ana-
lysis of CPS purified using a mild enzymatic method revealed a teichoic
acid-like [-4)-a-d-Galp-(1–2)-(R)-Gro-(1-P]
n
, repeating unit, where Gro is
glycerol. Two branches at C-2 and C-3 of galactose were identified as
b-d-fructofuranoses substituted at C-3 with CH
3
OP(O)(NH
2
)(OR) groups.
Structural heterogeneity was due to nonstoichiometric glycosylation at C-3
of galactose and variable phosphoramidate groups. Identical structural
features were found for cell-bound CPS on intact cells using proton
homonuclear and
31
P heteronuclear two-dimensional HR-MAS NMR at
500 MHz. In contrast, spectroscopic data acquired for hot water ⁄ phenol
purified CPS was complicated by the hydrolysis and subsequent loss of
labile groups during extraction. Collectively, the results of this study estab-
lished the importance of using sensitive isolation techniques and HR-MAS
NMR to examine CPS structures in vivo when labile groups are present.
This study uncovered how incorporation of variable O-methyl phosphor-
amidate groups on nonstoichiometric fructose branches is used in C. jejuni
HS:1 as a strategy to produce a highly complex polysaccharide from its
small CPS biosynthetic locus and a limited number of sugars.
Abbreviations
CPS, capsular polysaccharide; CE-ESI-MS, capillary electrophoresis-electrospray ionization-mass spectrometry; HMBC, heteronuclear multiple
bond coherence; HMW LPS, high-molecular-weight lipopolysaccharides; HR-MAS NMR, high resolution magic angle spinning nuclear
magnetic resonance; HSQC, heteronuclear single quantum coherence; MeOPN, O-methyl phosphoramidate CH
3
OP(O)(NH
2
)(OR).
FEBS Journal 272 (2005) 4407–4422 ª 2005 FEBS 4407
Analysis of the genome sequence revealed that this
strain possesses four gene clusters necessary for carbo-
hydrate biosynthesis [6]. Among these was the first des-
cription of a type II ⁄ III capsule locus similar to that
found in encapsulated organisms, such as those found
in Escherichia coli K1 and Neisseria meningitidis group
B [6,7]. In particular, identification of kps genes,
responsible for transferring the CPS repeat to the outer
membrane, prompted a systematic genetic analysis of
the corresponding locus and resulted in the identifica-
tion of CPS in several strains of C. jejuni [8]. The CPS
product of this locus was subsequently shown to be the
major serodeterminant in the heat-stable typing scheme
first described by Penner and Hennessy [9–11], and
alcian blue staining led to the visualization of capsule in
C. jejuni by electron microscopy [12]. Because of these
pioneering studies, C. jejuni is now widely accepted as a
species that produces a CPS and what was previously
reported in the literature as high-molecular-weight lipo-
polysaccharides (HMW LPSs) for C. jejuni, are now
considered to be CPSs [12–14].
Because capsular polysaccharide is the outermost
structure on the bacterial cell, it plays a key role in the
interaction between the pathogen, host, and environ-
ment [15]. Generally, CPS is thought to be important
for bacterial survival and persistence in the environ-
ment and often contributes to pathogenesis [16]. For
C. jejuni, CPS is considered to be an important viru-
lence factor based on its involvement in epithelial cell
invasion, diarrhoeal disease, serum resistance and
maintenance of bacterial cell surface hydrophilicity
[11]. Furthermore, the CPSs produced by different
strains of C. jejuni are structurally complex and highly
variable. For instance, there are presently more than
60 serostrains described for C. jejuni, not including
nontypeable strains, each with a unique CPS structure
[14]. Moreover, for each serogroup it is possible to
have phase-variable CPS modifications such as the
addition of methyl, ethanolamine and aminoglycerol
groups reported for C. jejuni NCTC 11168 CPS [15].
In a recent study, the CPS biosynthetic regions for
selected strains of C. jejuni were sequenced including:
serostrain HS:41 (176.83), 81–176 (HS:23 ⁄ 26), sero-
strain HS:36 (ATCC 43456), serostrain HS:23 (CCUG
10954), serostrain HS:19 (NCTC 12517) and G1
(HS:1) [14]. Comparison of the determined cps
sequences of the HS:19, HS:41 and HS:1 strains with
the genome sequenced NCTC 11168 (HS:2) strain pro-
vided evidence for multiple mechanisms of CPS vari-
ation including exchange of capsular genes and entire
clusters by horizontal transfer, gene duplication, dele-
tion, fusion and contingency gene variation [14]. The
study also demonstrated for the first time that strains
belonging to the same serogroup (e.g. 81–176
(HS:23 ⁄ 36), HS:23 and HS:36) contain capsule loci
with the same gene complement. In contrast to
C. jejuni NCTC 11168 and HS:19, the biosynthetic
region of the HS:1 strain was the smallest and was
shown to contain only 11 genes (Fig. 1a). Of import-
ance, the cps locus of the HS:1 strain was shown to
contain a tagD homologue encoding a glycerol-3-phos-
phate cytidylyltransferase necessary for the biosynthe-
sis of CDP-glycerol. Moreover, it was shown that the
(a)
(b)
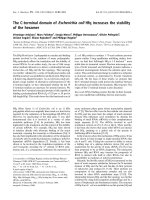
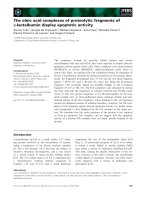
Fig. 1. Predicted capsule gene schematic and determined struc-
tures for the defructosylated repeating unit (CPS-1) and complete
CPS structure (CPS-2) of the C. jejuni HS:1 serostrain. (a) Carbohy-
drate biosynthetic genes located between the genes encoding the
capsule transport system are shown from the sequenced locus of
the HS:1 strain, G1 [14]. The phase variable genes in G1 which
could be involved in the structural heterogeneity described in this
report are indicated by grey arrows. (b) For CPS-2, the repeating
unit is [-4)-a-
D-Galp-(1–2)-(R)-Gro-(1-P-]
n
with MeOPN-3-b-D-fructo-
furanose branches at C-2 and C-3 of Gal. Structural heterogeneity
is due to variable phosphoramidate groups on nonstoichiometric
fructose branches. Residue A is a-
D-Galp, a-D-galactopyranose,
residue B is GroP, glycerol-phosphate, residue C is b-
D-Fruf,
b-
D-fructofuranose; and MeOPNisO-methyl phosphoramidate,
CH
3
OP(O)(NH
2
)(OR).
Campylobacter jejuni HS:1 serostrain CPS D. J. McNally et al.
4408 FEBS Journal 272 (2005) 4407–4422 ª 2005 FEBS
HS:1 strain encodes a tagF homologue responsible for
transferring glycerol-phosphate residues from CDP-
glycerol. These genetic findings for the cps loci of this
HS:1 strain corroborated the structures reported for
the C. jejuni HS:1 serostrain HMW LPS (CPS), where
the repeat unit was [-4)-a-d-Gal-(1–2)-Gro-(3- P-]
n
[17,18]. We did however, observe important discrepan-
cies between these structures reported for HS:1 HMW
LPS and preliminary NMR data obtained for the par-
tially purified CPS of G1 (HS:1) and the HS:1 sero-
strain of C. jejuni [14]. For instance, we detected the
presence of at least two acid-labile groups and provi-
ded evidence showing that one of these was likely an
MeOPNCH
3
OP(O)(NH
2
)(OR) modification similar to
the one identified on the CPS structure of the genome-
sequenced strain of C. jejuni, NCTC 11168 [14,15].
In the current study, we thoroughly investigated the
chemical structure of CPS for the HS:1 serostrain
of C. jejuni. Initially, CPS was isolated from bacterial
cells using a traditional hot water ⁄ phenol method [19];
however, due to the extent of structural degradation
observed for CPS purified using this method, a gentler
procedure for isolating CPS was required to preserve
the labile constituents of HS:1 CPS. Accordingly, the
methods of Darveau and Hancock [20], Huebner et al.
[21] and Hsieh et al. [22] were combined and used to
isolate CPS from this strain of C. jejuni. High resolu-
tion NMR at 600 MHz with an ultra-sensitive cryo-
genically cooled probe was then used to elucidate the
structure of purified CPS, and HR-MAS NMR at
500 MHz was used to examine native CPS directly
on the surface of whole bacterial cells. Concurrently,
CE-ESI-MS and in-source collision-induced dissoci-
ation [23] was used to analyze the structure of purified
HS:1 CPS, corroborate NMR findings and characterize
the extent of heterogeneity for HS:1 CPS. In this study,
we present the advantages and importance of using sen-
sitive techniques for examining CPS in C. jejuni, report
the complete structure of C. jejuni HS:1 CPS and dis-
cuss the biological significance of these new structural
findings for this strain of the bacterium.
Results
The results generated by HR-MAS and high resolution
NMR, CE-ESI-MS and chemical ⁄ enzymatic analyses
provided strong evidence showing that the backbone
of C. jejuni HS:1 CPS resembles teichoic acid and con-
sists of a [-4)-a-d-Galp-(1–2)-(R)-Gro-(1-P-]
n
repeating
unit (Fig. 1b). The complete CPS structure for HS:1 is
complex due to the presence of a nonstoichiometric
fructose branch at C-3 of galactose, and variable
MeOPN groups at C-3 of both fructose branches at
C-2 and C-3 of galactose (Fig. 1b). Most importantly,
it was established that this structural heterogeneity was
not an artifact of the isolation procedure, but reflects
that which is maintained in vivo.
Isolation of CPS and
1
H NMR spectroscopy
Using the hot water ⁄ phenol extraction method, 7.3 mg
of pure CPS was obtained from 6 g (wet pellet mass)
of bacterial cells, while the enzymatic method afforded
6.8 mg of pure CPS from the same mass of bacterial
cells. By suspending an enzyme purified sample of
HS:1 CPS in nonbuffered D
2
O (pD 2.2), the auto-
hydrolyzed defructosylated repeating unit was obtained
(CPS-1), as well as other hydrolysis fragments. The
1
H
NMR spectrum of this auto-hydrolyzed CPS sample
showed sharp spectral lines and one major anomeric
signal for Gal H-1 (Fig. 2A). Signals originating from
the methyl group of the MeOPN modification, nor-
mally present at 3.78 p.p.m., were absent [15]. The
1
H
NMR spectrum of a hot water ⁄ phenol purified sample
of HS:1 CPS showed two broad anomeric signals for
Gal H-1 and resonances originating from the MeOPN
modification were weak and therefore difficult to
observe (Fig. 2B). In contrast, the spectrum for the
enzyme isolated CPS sample (CPS-2) showed one
signal for Gal H-1 and signals originating from the
methyl group of the MeOPN modification were sharp
and clearly discernable (Fig. 2C).
HR-MAS NMR of HS:1 cells provided valuable
insight into the nature of cell-bound CPS on the sur-
face of bacterial cells. The HR-MAS
1
H NMR spec-
trum of HS:1 cells (Fig. 2D) closely resembled the
proton spectrum obtained for the enzyme purified CPS
sample in that one anomeric signal was observed for
Gal H-1, and signals arising from the MeOPN modifi-
cation were sharp and clearly visible. In light of the
degradation observed for the hot water ⁄ phenol purified
CPS sample, and because an enzyme purified CPS
sample most closely resembled CPS on the surface of
HS:1 cells; chemical analyses, high resolution NMR
analyses and mass spectrometry analyses were per-
formed using enzyme purified CPS.
Sugar composition analysis of enzyme purified
CPS
By comparing the GC retention times of alditol acetate
derivatives for common aldo sugar standards with
those prepared from an enzyme purified HS:1 CPS
sample, galactose and the reduction products of fruc-
tose, mannose and glucose, were unambiguously iden-
tified (data not shown).
D. J. McNally et al. Campylobacter jejuni HS:1 serostrain CPS
FEBS Journal 272 (2005) 4407–4422 ª 2005 FEBS 4409
Determination of absolute configuration for
enzyme purified CPS
By comparing the GC retention times of the R- and
S-butyl glycosides of an authentic d-galactose standard
to the R-butyl glycosides of an enzyme purified HS:1
CPS sample, galactose was shown to have the D confi-
guration (data not shown). Furthermore, an intense
increase in adsorption at 340 nm following treatment
with a hexokinase-phosphoglucoisomerase-glucose-6-
dehydrogenase-NADP fructose assay kit (Sigma, Oak-
ville, Canada) indicated that fructose also had the D
configuration (data not shown).
The chirality of naturally occurring glycerols can be
determined chemically, enzymatically or can be deduced
from the biosynthetic pathway responsible for their pro-
duction [24]. When CDP-glycerol is used as a precursor
to incorporate glycerol in the growing repeating chain
of teichoic acids, the resulting glycerol-1-phosphate
unit has the D, or R configuration [24]. Alternatively,
when glycerophosphate is biosynthetically derived from
phosphatidylglycerol, the resulting product is L-or
S-glycerol-1-phosphate [24]. Based on previous work
where we reported that the CPS biosynthetic locus of
a HS:1 strain of C. jejuni contains a tagF homologue
responsible for transferring glycerol-phosphate residues
from CDP-glycerol [14], the glycerol-1-phosphate resi-
due was concluded to have the R configuration.
High resolution NMR analysis of auto-hydrolyzed
enzyme purified CPS (CPS-1)
Due to the complexity of the NMR spectrum of the
native CPS, the backbone structure was first deter-
mined. Examination of an auto-hydrolyzed defructo-
sylated enzyme purified HS:1 CPS sample revealed a
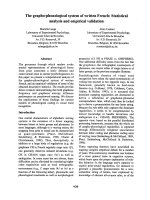
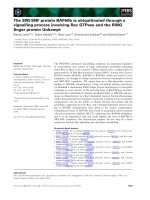
Fig. 2. NMR analysis of purified and cell-
bound C. jejuni HS:1 CPS. (A)
1
H NMR
spectrum of an auto-hydrolyzed enzyme
purified CPS sample. (B)
1
H NMR spectrum
of a hot water ⁄ phenol purified CPS sample.
(C)
1
H NMR spectrum of an enzyme purified
CPS sample. (D) HR-MAS
1
H NMR spec-
trum (10 °C) of cell-bound CPS. N-linked gly-
can anomeric resonances are indicated with
asterisks. (E) 1D-NOESY spectrum (400 ms)
of Gal H-1 for an enzyme purified CPS sam-
ple. (F) HR-MAS NOESY (23 °C, 100 ms)
showing the trace of Gal H-1 for cell-bound
CPS. (G) 1D-NOESY HR-MAS spectrum
(10 °C, 200 ms) of Gal H-4a and H-4b for
cell-bound CPS. (H) HR-MAS
31
P HSQC
spectrum (10 °C, 512 transients, 64 incre-
ments,
1
J
P,H
¼ 10 Hz) for cell-bound CPS.
(I) HR-MAS
31
P HSQC spectrum (23 °C, 512
transients, 64 increments,
1
J
P,H
¼ 10 Hz)
for cell-bound CPS. For the selective 1D
experiments, excited resonances are under-
lined.
Campylobacter jejuni HS:1 serostrain CPS D. J. McNally et al.
4410 FEBS Journal 272 (2005) 4407–4422 ª 2005 FEBS
[-4)-a-d-Galp-(1–2)-(R)-Gro-(1-P]
n
repeating unit
(CPS-1) as well as other hydrolysis products (Fig. 3).
The 1D-TOCSY of Gal H-1 revealed J-correlated
peaks for Gal H-2, H-3 and H-4 (Fig. 3A). The
1D-NOESY of Gal H-4 revealed NOEs for Gal H-3
and H-5 (Fig. 3B), and the 1D-TOCSY of Gal H-5
identified the Gal H-6 resonances (Fig. 3C). A
1D-NOESY-TOCSY experiment with selective excita-
tion of Gal H-1 ⁄ Gro H-2 was used to identify the
glycerol resonances (Fig. 3D). The Gal H-1 ⁄ Gro C-2
HMBC correlation confirmed the Gal-(1–2)-Gro link-
age. The
31
P HSQC spectrum (Fig. 3E) showed that
Gal H-4 and Gro H-1 ⁄ 1¢ were linked by a phospho-
rus atom with a chemical shift characteristic of a
monophosphate diester bond [25,26]. The
13
C HSQC
spectrum (Fig. 3G) and HMBC spectrum were used
to assign the
13
C resonances (Table 1) and signals
consistent with those reported for fructofuranose and
fructopyranose monosaccharides were observed
[27–29].
High resolution NMR analysis of intact enzyme
purified CPS (CPS-2)
Analysis of an intact enzyme-purified sample of HS:1
CPS using NMR at 600 MHz revealed fructose
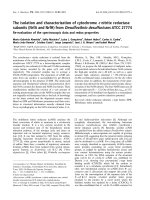
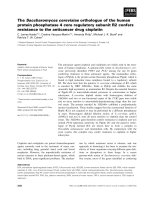
Fig. 3. NMR analysis of an auto-hydrolyzed
defructosylated sample of C. jejuni HS:1
CPS, CPS-1. (A) 1D-TOCSY (80 ms) of Gal
H-1. (B) 1D-NOESY (800 ms) of Gal H-4. (C)
1D-TOCSY (60 ms) of Gal H-5. (D) 1D-NO-
ESY-TOCSY of Gal H-1 (800 ms) and Gro
H-2 (60 ms). (E)
31
P HSQC with
1
J
P,H
¼
10 Hz, 64 transients and 240 increments.
(F)
13
C HSQC with
1
J
C,H
140 Hz, 8
transients and 256 increments. For
the selective 1D experiments, excited
resonances are underlined. Ff and Fp repre-
sent the fructofuranose and fructopyranose
monosaccharides, respectively.
Table 1. NMR proton and carbon chemical shifts d (p.p.m) for an
auto-hydrolyzed enzyme purified sample of C. jejuni HS:1 CPS
(CPS-1) and corresponding hydrolysis products. The
31
P chemical
shift for the monophosphate diester linkage was d
P
0.49 p.p.m.
Atom Type
CPS-1
d
H
d
C
A1 CH 5.20 98.9
A2 CH 3.87 70.4
A3 CH 3.98 69.9
A4 CH 4.54 75.5
A5 CH 4.17 71.5
A6 ⁄ A6¢ CH
2
3.74 ⁄ 3.74 61.6
B1 ⁄ B1¢ CH
2
4.11 ⁄ 4.05 65.2
B2 CH 3.97 77.9
B3 ⁄ B3¢ CH
2
3.76 ⁄ 3.76 62.1
Fruf1 ⁄ 1¢ CH
2
3.56 ⁄ 3.64 63.4
Fruf2 C – 105.1
Fruf3 CH 4.10 76.1
Fruf4 CH 4.10 75.2
Fruf5 CH 3.82 81.4
Fruf6 ⁄ 6¢ CH
2
3.67 ⁄ 3.79 63.2
Frup1 ⁄ 1¢ CH
2
3.55 ⁄ 3.70 64.5
Frup2 C – 98.8
Frup3 CH 3.79 68.3
Frup4 CH 3.88 69.3
Frup5 CH 4.02 69.4
Frup6 ⁄ 6¢ CH
2
3.70 ⁄ 4.02 64.1
D. J. McNally et al. Campylobacter jejuni HS:1 serostrain CPS
FEBS Journal 272 (2005) 4407–4422 ª 2005 FEBS 4411
branches located at C-2 and C-3 of Gal and MeOPN
groups on C-3 of the fructoses. Due to the instability
of HS:1 CPS, a cryogenically cooled probe was used as
it permitted the acquisition of
1
H and
13
C NMR
experiments in a relatively short period of time. The
1D-TOCSY of Gal H-1 revealed two separate reso-
nances for Gal H-2, H-3 and H4 labeled A2a,A2b,
A3a,A3b,A4a and A4b, respectively. (Fig. 4A). The
1D-NOESY of Gal H-4a showed NOEs for Gal H-2a,
Gal H-3a, Gal H-5 and Gal H-6 ⁄ 6¢, as well as for Fru
H-4 and Fru H-6 ⁄ 6¢ (Fig. 4B). Conversely, excitation
of Gal H-4b revealed NOE enhancements for Gal
H-2b, Gal H-3b, Gal H-5 and H-6 ⁄ 6¢ as well as for
Fru H-6 ⁄ 6¢ (Fig. 4C). A 1D-NOESY ⁄ TOCSY experi-
ment with selective excitation of Gal H-1 and Gro
H-1 ⁄ 1¢ permitted the assignment of Gro H-2 and Gro
H-3 ⁄ 3¢ (Fig. 4D).
The HMBC experiment revealed three-bond correla-
tions between Gal H-2, Gal H-3b and Fru C-2 indicating
that two fructose branches were present for the CPS of
C. jejuni HS:1 (data not shown). The 1D-NOESY of
Fru H-3 revealed enhancements for Fru H-1 ⁄ 1¢, H-4
and H-5 (Fig. 4E) while the 1D-TOCSY of Fru H-4
showed correlations to Fru H-3 and H-5 (Fig. 4F).
The
31
P HSQC experiment revealed monophosphate
diester linkages between Gal C-4a, C-4b and Gro C-1
with different chemical shifts at d
P
0.40 p.p.m and
0.49 p.p.m., respectively (Fig. 4G). A proton-phospho-
rus correlation at d
P
14.67 p.p.m. observed between
the methyl group of the MeOPN and H-3 of Fru indi-
cated that this CPS modification was located at C-3 of
the b-d-fructofuranoside residues (Fig. 4G). The phos-
phorus chemical shift of the MeOPN was consistent
with those reported for phosphoramidates in the litera-
ture [25,26,30]. Comparison of carbon chemical shifts
for defructosylated CPS-1 and intact CPS-2 indicated
that fructose branches were located at C-2 and C-3 of
Gal (Fig. 4H, Table 2). The small upfield shift changes
caused by fructosylation of Gal at C-2 and C-3 of
2.1 p.p.m and 1.2 p.p.m., respectively, were consistent
with those reported for the CPSs of Escherichia coli
strains 04:K52:H
–
and O13:K11:H11 (Tables 1 and 2)
[28,29]. The
13
C HSQC spectrum also showed minor
contaminating signals similar to those reported for
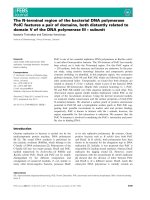
Fig. 4. NMR analysis of an enzyme purified
sample of C. jejuni HS:1 CPS, CPS-2.
(A) 1D-TOCSY (80 ms) of Gal H-1. (B)
1D-NOESY (400 ms) of Gal H-4a.
(C) 1D-NOESY (400 ms) of Gal H-4b.(D)
1D-NOESY-TOCSY of Gal H-1 (400 ms) and
Gro H-1 ⁄ 1¢ (50 ms). (E) 1D-NOESY (400 ms)
of Fru H-3. (F) 1D-TOCSY (80 ms) of Fru
H-4. (G)
31
P HSQC with
1
J
P,H
¼ 20 Hz, 8
transients and 32 increments. (H)
13
C HSQC
with
1
J
C,H
¼ 150 Hz, 80 transients and
256 increments. For the selective 1D
experiments, excited resonances are
underlined. Residue C represents Fru with
MeOPN present and residue *C, Fru with
no MeOPN.
Campylobacter jejuni HS:1 serostrain CPS D. J. McNally et al.
4412 FEBS Journal 272 (2005) 4407–4422 ª 2005 FEBS
C. jejuni HS:1 LPS (CPS) [17,31] as well as for pep-
tides and nucleic acids. Furthermore, signals belonging
to nonsubstituted b-fructofuranoside indicated that
fructose branches were variably substituted with
MeOPN groups [27–29].
Mass spectrometry analysis
CE-ESI-MS analysis corroborated the structure pro-
posed for HS:1 CPS and clearly established that two
branches are present in the repeating unit with various
degrees of heterogeneity (Fig. 5 and Table 3). Low
orifice voltage ()110 V) CE-ESI-MS analysis of an
auto-hydrolyzed enzyme purified sample of HS:1 CPS
(CPS-1) revealed a mixture of negatively charged ions
originating from the backbone (Fig. 5A). In particular,
ions observed at m ⁄ z 315.0, 407.1 and 631.2, corres-
ponding to the masses of Hex + GroP, Hex +
GroP + Gro + H
2
O and (Hex)
2
+ (GroP)
2
, respect-
ively, confirmed that the natural acidity of HS:1 CPS
(pD 2.2) had hydrolyzed both fructofuranose branches
and confirmed the structure of the backbone repeating
unit as [-4)-a-d-Galp-(1–2)-( R )-Gro-(1-P-]
n
.
Due to the high molecular mass of HS:1 CPS, a
high negative orifice voltage ()400 V) was used to pro-
mote in-source collision-induced dissociation [23] for
an intact enzyme purified sample of HS:1 CPS (CPS-2)
to facilitate its analysis by CE-ESI-MS (Fig. 5B). In
addition to observing ions originating from the repeat-
ing unit, ions at m ⁄ z 639.4 and 801.6 corresponding
to (Hex)
3
+ GroP and (Hex)
4
+ GroP, respectively,
confirmed the attachment of both fructose branches on
galactose. Furthermore, ions observed at m ⁄ z 671.4,
894.6, 905.5 and 987.7 corresponding to (Hex)
3
+
(MeOPN)
2
, (Hex)
4
+ GroP + MeOPN, (Hex)
3
+
GroP + (MeOPN)
2
+ P, and (Hex)
4
+ GroP +
(MeOPN)
2
, respectively, supported that MeOPN
groups were located on both fructose branches. Of
particular importance, CE-ESI-MS ⁄ MS analysis of
m ⁄ z 732.5, corresponding to one full repeat of HS:1
CPS, showed an ion at m ⁄ z 658.2, corresponding to
(Hex)
3
+ MeOPN+P, and corroborated the findings
of NMR analysis by demonstrating that Fru branches
in HS:1 CPS are variably substituted with MeOPN
groups (Fig. 5C).
Branching pattern of CPS-2
Two unique spin systems, a and b, were identified for
Gal indicative of structural heterogeneity due to two
different forms of the repeating unit. For the enzyme
purified CPS sample and whole cells, only one Gal
H-1 resonance at 5.40 p.p.m. was detected in their cor-
responding
1
H spectra (Fig. 2C,D). Because loss of the
fructose branch at Gal C-2 would have caused an
upfield shift of Gal H-1 similar to that observed for
the hot water ⁄ phenol purified CPS sample or the auto-
hydrolyzed CPS sample (Fig. 2A,B), the Gal C-2 fruct-
osyl branch was the dominant form present in the
native CPS. Hence, these different spin systems arose
from two forms of CPS due to nonstoichiometric
branching at C-3 of Gal. The larger carbon chemical
shift difference observed for Gal C-3a and b
(0.9 p.p.m) compared to the one for Gal C-2a and b
(0.2 p.p.m) also indicated that variable glycosydation
occurred at C-3 of Gal. Based on the Gal H-3b and
Fru C-2 HMBC correlation, spin system b was attrib-
uted to the form where both fructose branches were
simultaneously present at C-2 and C-3 of Gal, while
spin system a represents the form where the fructose
branch at Gal C-3 was absent.
Table 2. NMR proton and carbon chemical shifts d (p.p.m) for an
intact enzyme purified sample of C. jejuni HS:1 CPS (CPS-2). The
31
P chemical shifts for the monophosphate diester linkages of Gal
H-4a and b were d
P
0.40 p.p.m and 0.49 p.p.m., respectively. The
31
P chemical shift for the MeOPN groups was 14.67 p.p.m., and a
scalar coupling
3
J
P,H
of 11.1 Hz was observed.
Atom Type
CPS-2
d
H
d
C
A1 CH 5.40 98.8
A2a CH 4.29 68.5
A2b CH 4.28 68.3
A3a CH 4.33 69.4
A3b CH 4.40 68.7
A4a CH 4.74 77.2
A4b CH 4.69 77.3
A5 CH 4.16 72.0
A6 ⁄ A6¢ CH
2
3.76 ⁄ 3.76 61.6
B1 ⁄ B1¢ CH
2
4.15 ⁄ 4.11 64.5
B2 CH 4.02 77.1
B3 ⁄ B3¢ CH
2
3.84 ⁄ 3.76 61.6
C1 ⁄ C1¢ CH
2
3.78 ⁄ 3.63 62.4
C2 C – 104.1
C3 CH 4.84 79.7
C4 CH 4.52 73.2
C5 CH 3.85 81.2
C6 ⁄ C6¢ CH
2
3.86 ⁄ 3.77 62.5
MeOPNCH
3
3.81 54.9
C1 ⁄ C1¢
a
CH
2
3.78 ⁄ 3.63 62.4
C2
a
C – 104.1
C3
a
CH 4.12 77.0
C4
a
CH 4.12 76.6
C5
a
CH 3.75 81.5
C6 ⁄ C6¢
a
CH
2
3.86 ⁄ 3.77 62.5
a
Chemical shift data d (p.p.m) for unsubstituted b-D-fructofurano-
side (MeOPN is absent).
D. J. McNally et al. Campylobacter jejuni HS:1 serostrain CPS
FEBS Journal 272 (2005) 4407–4422 ª 2005 FEBS 4413
HR-MAS NMR spectroscopy of cell-bound CPS
In order to characterize the heterogeneity of the CPS
in its native state, HR-MAS NMR studies were per-
formed on intact cells. As observed for the purified
CPS, two signals arising from Gal H-4, H-4a and
H-4b, were detected on the surface of HS:1 cells and
appeared to be present in equal proportions (Fig. 2).
The 1D NOESY of Gal H-1 for an enzyme purified
CPS sample showed NOEs for Gal H-2, Gro H-1 ⁄ 1¢,
Gro H-2 and Gro H-3 ⁄ 3¢ (Fig. 2E). Likewise, in the
HR-MAS NOESY trace of Gal H-1 (Fig. 2F) for
HS:1 cells, the same NOE pattern was observed. The
1D HR-MAS NOESY for the Gal H-4a and H-4b
resonances (Fig. 2G) of cell-bound CPS revealed
NOEs for Gal H-3b, H-2a and b, H-5, H-6 ⁄ 6¢ as well
as for fructose H-6 ⁄ 6¢, similar to those observed for
the purified CPS (Fig. 4). The
31
P HSQC HR-MAS
Fig. 5. Mass spectrometry analysis of
C. jejuni HS:1 CPS. (A) CE-ESI-MS analysis
of an auto-hydrolyzed defructosylated sam-
ple of HS:1 CPS (CPS-1) (negative ion mode,
orifice voltage )110 V). (B) CE-ESI-MS
analysis of an intact enzyme purified sample
of HS:1 CPS (CPS-2) (negative ion mode,
orifice voltage )400 V). (C) CE-ESI-MS ⁄ MS
analysis for an intact enzyme purified sample
of HS:1 CPS (CPS-2) m/z 732.2 (negative ion
mode, orifice voltage )400 V). Collision
energy was ramped from )35 to )55 V for
the scan range of m/z 100–800.
Campylobacter jejuni HS:1 serostrain CPS D. J. McNally et al.
4414 FEBS Journal 272 (2005) 4407–4422 ª 2005 FEBS
spectrum of whole HS:1 cells showed proton-phospho-
rus correlations for Gal H-4a and b with at d
P
0.33 p.p.m and d
P
0.49 p.p.m., respectively (Fig. 2H).
The correlation between MeOPNatd
P
14.67 p.p.m.
with H-3 of fructofuranose was also observed. Hence,
the NOEs and
31
P HSQC indicated that structural het-
erogeneity due to different branching patterns on the
Gal residue was also present for intact cells.
Molecular dynamics simulations
Three models were constructed for the [-4)-a-d-Galp-
(1–2)-(R)-Gro-(1-P-]
n
repeating unit of HS:1 CPS
representing different substitution patterns for the fruc-
tose branches located at C-2 and C-3 of a-d-Galp
(present ⁄ absent, absent ⁄ present and present ⁄ present).
These models were then used to verify NOEs observed
during NMR analysis. A minimum energy conformer
generated using a Metropolis Monte-Carlo calculation
for HS:1 CPS with both MeOPN-substituted fructose
branches (in the same plane as the page) attached to
the repeating unit (out of plane, with P closest to the
reader) is shown in Fig. 6. Molecular dynamics simula-
tions showed that regardless of the substitution pattern
of Gal, the average interproton distance between Gal
H-1 and Gro H-2 was approximately 2.6 A
˚
± 0.2 A
˚
and therefore confirmed the strong NOE observed
between these two residues. Steric hindrance between
both fructofuranose branches was found to be minimal
as reflected in the mobility of these groups. Interest-
ingly, the fructose branch at C-3 of Gal was shown to
be substantially more flexible than its Gal C-2 substi-
tuted counterpart. Molecular dynamics simulations
indicated that the weak interresidue NOE observed
between Gal H-4a and fructose H-4 for an intact
enzyme purified CPS sample (Fig. 4B) could have ori-
ginated from either fructose branch as interproton dis-
tances were comparable for both branches and ranged
from 3 to 5 A
˚
. The results of molecular dynamics
Table 3. Negative ion CE-ESI-MS data ()400 V orifice voltage), cal-
culated masses and proposed fragments for auto-hydrolyzed (CPS-
1) and intact (CPS-2) samples of HS:1 CPS. Isotope-averaged
masses of residues were used for calculation of total molecular
masses based on the following proposed compositions: Gro (gly-
cerol), 74.1; Hex (a-
D-galactopyranoside), 162.1; MeOPN(O-methyl
phosphoramidate CH
3
OP(O)(NH
2
)), 93.2; P (phosphate), 80.0; H
2
O,
18.0. For these gas-phase (IS-CID) degradation products, no H
2
O
molecule is added to the residues unless specifically indicated.
Molecular mass (m ⁄ z)
Structure
Observed Calculated Difference
153.1 153.1 0.0 GroP
171.3 171.1 0.2 GroP +H
2
O
223.3 223.1 0.2 Hex + P ) (H
2
O)
2
254.8 254.2 0.6 Hex + MeOPN
259.0 259.1 0.1 Hex + P +H
2
O
297.3 297.2 0.1 Hex + GroP ) H
2
O
315.3 315.2 0.1 Hex + GroP
333.5 333.2 0.3 Hex + GroP +H
2
O
377.5 377.2 0.3 Hex + GroP + P ) H
2
O
385.3 385.2 0.1 (Hex)
2
+ P ) H
2
O
395.3 395.2 0.1 Hex + GroP + P
398.3 398.2 0.1 (Hex)
2
+ MeOPN ) H
2
O
407.5 407.3 0.2 Hex + GroP +Gro+H
2
O
416.8 416.3 0.5 (Hex)
2
+ MeOPN
453.3 453.3 0.0 (Hex)
2
+ MeOPN+(H
2
O)
2
459.3 459.5 0.2 (Hex)
2
+GroP ) H
2
O
469.3 469.3 0.0 Hex + (GroP)
2
) H
2
O
477.3 477.3 0.0 (Hex)
2
+GroP
487.3 487.3 0.0 Hex + (GroP)
2
+H
2
O
490.8 490.4 0.4 (Hex)
2
+ Gro + MeOPN
495.5 495.4 0.1 (Hex)
2
+GroP +H
2
O
509.6 509.4 0.2 (Hex)
2
+ Gro + MeOPN
539.3 539.3 0.0 (Hex)
2
+GroP + P ) H
2
O
551.5 551.4 0.1 (Hex)
2
+GroP +Gro
557.5 557.3 0.2 (Hex)
2
+GroP + P
570.3 570.4 0.1 (Hex)
2
+GroP +MeOPN
578.8 578.4 0.4 (Hex)
3
+ MeOPN
613.5 613.4 0.1 (Hex)
2
+(GroP)
2
) H
2
O
621.5 621.5 0.0 (Hex)
2
+GroP ) H
2
O
631.3 631.4 0.1 (Hex)
2
+(GroP)
2
639.3 639.5 0.2 (Hex)
3
+GroP
652.3 652.5 0.2 (Hex)
3
+ Gro + MeOPN
658.2 658.4 0.2 (Hex)
3
+ MeOPN+P
667.5 667.4 0.1 (Hex)
2
+(GroP)
2
+(H
2
O)
2
671.8 671.5 0.3 (Hex)
3
+ (MeOPN)
2
701.5 701.4 0.1 (Hex)
3
+GroP+P ) H
2
O
723.3 723.5 0.2 (Hex)
2
+(GroP)
2
+Gro+H
2
O
732.3 732.5 0.2 (Hex)
3
+GroP +MeOPN
751.4 751.4 0.0 (Hex)
3
+ (MeOPN)
2
+ P
775.5 775.5 0.0 (Hex)
3
+(GroP)
2
) H
2
O
793.5 793.5 0.0 (Hex)
3
+(GroP)
2
793.3 793.5 0.2 (Hex)
2
+GroP +MeOPN
+ P ) H
2
O
801.6 801.6 0.0 (Hex)
4
+GroP
829.5 829.6 0.1 (Hex)
3
+(GroP)
2
+(H
2
O)
2
855.3 855.5 0.2 (Hex)
3
+(GroP)
2
+ P ) H
2
O
Table 3. (Continued).
Molecular mass (m ⁄ z)
Structure
Observed Calculated Difference
886.8 886.6 0.2 (Hex)
3
+(GroP)
2
+ MeOPN
894.5 894.6 0.1 (Hex)
4
+GroP +MeOPN
905.5 905.5 0.0 (Hex)
3
+GroP +(MeOPN)
2
+ P
929.8 929.6 0.2 (Hex)
3
+(GroP)
3
) H
2
O
947.5 947.6 0.1 (Hex)
3
+(GroP)
3
987.5 987.7 0.2 (Hex)
4
+GroP +(MeOPN)
2
1048.5 1048.7 0.2 (Hex)
4
+(GroP)
2
+ MeOPN
1109.5 1109.7 0.2 (Hex)
4
+(GroP)
3
D. J. McNally et al. Campylobacter jejuni HS:1 serostrain CPS
FEBS Journal 272 (2005) 4407–4422 ª 2005 FEBS 4415
simulations also suggested that NOEs observed at
3.86 p.p.m. in the NOESY spectra of Gal H-4a and
Gal H-4b (Fig. 4B,C) likely arose from Fru H-6 ⁄ 6¢ as
the minimum interproton distance for these protons
was approximately 2 A
˚
. In contrast, interproton
distances calculated for Gal H-4 ⁄ Fru H-5, and Gal
H-4 ⁄ Gro H-3 were on the order of 5–7 A
˚
thereby
negating the likelihood of observing these interresidue
NOEs.
Discussion
We previously demonstrated that HR-MAS NMR
can be used to rapidly compare C. jejuni CPS struc-
tures from intact cells and provided the first struc-
tural evidence that CPS is associated with Penner
serotype [14,15]. In this study, we investigated the
CPS structure for the representative HS:1 serostrain
of C. jejuni to complement data recently reported for
CPS biosynthesis in strain G1 (HS:1) [14], and to
determine the structure of labile CPS constituents
not detected by previous studies examining HMW
LPS (CPS) for the HS:1 serostrain [17,18]. Together,
different analytical methods showed that the HS:1-
type CPS of C. jejuni is complex and has a teichoic
acid-like [-4)-a-d-Galp-(1–2)-(R)-Gro-(1-P-]
n
repeating
unit with a b-d-fructofuranose branch at C-2 of Gal,
a nonstoichiometric fructose branch at C-3 of Gal
and variable MeOPN modifications on C-3 of both
fructose sugars.
By using a conventional hot water ⁄ phenol CPS
isolation method [19] and a more sensitive enzymatic
approach [20–22], we demonstrated that the method
used to isolate CPS was an important factor that influ-
enced the structure of the purified polysaccharide
thereby establishing the importance of using mild
isolation conditions to examine CPS structures. For
instance, due to the hydrolysis of the labile fructose
branches during extraction, two a-d-Galp anomeric
signals were observed for hot water ⁄ phenol purified
CPS: one at 5.40 p.p.m. when the fructose branch at
Gal C-2 was present and; another at 5.20 p.p.m. when
it was absent. These structural artifacts complicated
NMR and mass spectrometry data and as a result,
hindered the identification of these labile branches
and MeOPN groups. In contrast, spectroscopic data
acquired for an enzyme purified CPS sample was com-
paratively simple due to the preservation of both fruc-
tose branches, as was indicated by the appearance of
only one anomeric signal for a-d-Galp at 5.40 p.p.m.
Most importantly, HR-MAS NMR analysis confirmed
that the enzyme purified CPS sample was biologically
more representative of native cell-bound CPS on the
surface of HS:1 cells. For this study, use of this gentle
enzymatic method coupled with HR-MAS NMR
proved pivotal in determining the structure and loca-
tion of the fructose branches and MeOPN groups as
both are labile structures that are easily hydrolyzed by
high temperature and moderately acidic conditions
[15,28,29]. Because CPS is considered to be an import-
ant virulence factor for C. jejuni [1,15], sensitive ana-
lytical techniques that facilitate the study of its fragile
CPS structures are fundamental in increasing our
understanding of host–pathogen interactions, mecha-
nisms of infectivity and to guide the development of
effective therapeutics for this bacterium. This latter
point is illustrated by the fact that although fructose
has been reported for only a few bacterial CPSs, it was
found to be the immunodominant sugar of the cap-
sular K11 antigen of Escherichia coli O13:K11:H11
[28,29,32,33].
NMR and mass spectrometry analyses of an auto-
hydrolyzed defructosylated sample of enzyme purified
HS:1 CPS showed that it resembled teichoic acid, and
consisted of a [-4)-a-d-Galp-(1–2)-(R)-Gro-(1-P-]
n
repeating unit (CPS-1). Carbon and proton chemical
shifts were identical to those of the capsular antigen of
Neisseria meningitidis that has the same backbone [34].
Moreover, these findings supported those reported for
HMW LPS (CPS) isolated from this strain of C. jejuni
by McDonald [17], who showed it to consist of a [-4)-
a-d-Gal-(1–2)-Gro-(3-P-]
n
repeating unit. However, the
presence of fructose or MeOPN modifications was
not reported. The extraction and purification methods
used by the previous work probably resulted in the
Fig. 6. Molecular model for the C. jejuni HS:1 CPS. The [-4)-a-D-
Galp-(1–2)-(R)-Gro-(1-P-]
n
repeating unit with both MeOPN-substi-
tuted b -
D-fructofuranose branches at C-2 and C-3 of Gal. An
additional phosphate group is added at C-4 of Gal. OH groups have
been removed to simplify the appearance of the model.
Campylobacter jejuni HS:1 serostrain CPS D. J. McNally et al.
4416 FEBS Journal 272 (2005) 4407–4422 ª 2005 FEBS
hydrolysis of these labile constituents. Crude extracts
prepared using a hot water ⁄ phenol method were trea-
ted with acid to liberate a glycan polymer believed to
be HMW LPS. In the review by Moran et al. [18], the
structure is reported as [-4)-a-d-Gal-(1–3)-Gro-(1-P-]
n
which is probably a typographical error for the Gal-
Gro linkage as it refers to the original work by
McDonald [17]. Also, in our case, as the absolute con-
figuration of glycerol was determined from genetic
analysis, the glycerol-phosphate linkage is reported as
Gro-(1-P instead of Gro-(3-P [17].
The identification of MeOPN-substituted and
unsubstituted fructose branches suggested that this
modification could be expressed in a phase-variable
manner in C. jejuni HS:1 as found for C. jejuni NCTC
11168 [15]. Phosphoramidate structures are quite rare
in nature and have not, to our knowledge, been shown
to exist on CPS for any other bacterium and therefore
appear to be unique to C. jejuni. Previous work exam-
ining synthetic phosphoramidate molecules have shown
that they are high energy, labile structures with large
standard free energies of hydrolysis and greater phos-
pho donor potential than ATP [35–37]. Although very
little is known about their biological role in vivo,
because of their reactive nature and high phospho-
donor capabilities, phosphoramidates are thought to
interact nonspecifically with accessible amino acids of
proteins [38]. Furthermore, there is a growing body of
evidence suggesting that natural phosphoramidates,
such as phosphohistidine, play an important role in
two-component and phosphorelay signal transduction
pathways in bacteria that mediate responses such as
sporulation, chemotaxis, mucoidy, and flagellar move-
ment to environmental stimuli [39–45]. Accordingly, a
range of small-molecular-weight phosphoramidate
molecules have been identified that are able to elicit
similar responses from bacteria and are therefore
thought to mimic these naturally occurring phosphor-
amidate messengers [38–40,44,46]. Although a two
component system regulating growth and colonization
in response to environmental temperature was reported
for C. jejuni [47], the relationship between the biologi-
cal roles reported for phosphoramidates in other bac-
teria and the MeOPN CPS modification in C. jejuni is
not clear. Thus, the biological role of this capsular
modification in C. jejuni, much like the biosynthetic
pathway responsible for its production, is unknown at
this time.
In conclusion, in this study we determined the com-
plete structure of the CPS for the C. jejuni HS:1 sero-
strain. In doing so, we established the importance of
using mild isolation methods and noninvasive analyt-
ical techniques for examining CPS in this bacterium
due to the presence of highly labile constituents that
are easily overlooked using conventional methods.
Because the hot water ⁄ phenol method of extraction
and treatment of CPS with acid are still commonplace,
it is conceivable that such labile groups as these are
more widely distributed in bacteria than is currently
acknowledged. Further, one might speculate that such
discrepancies may be influential in the success of CPS-
based vaccine development.
As a result of using HR-MAS NMR to examine
CPS directly on the surface of bacterial cells we
showed that the HS:1-type CPS of C. jejuni consists
of a [-4)-a-d-Galp-(1–2)-(R)-Gro-(1-P-]
n
repeating unit
with two labile fructofuranoside branches and vari-
able MeOPN modifications. Hence, this strain of
C. jejuni can achieve a structurally variable and com-
plex CPS from its relatively small CPS biosynthetic
locus [14]. This structural heterogeneity may be a
mechanism to convey antigenic variation and protec-
tion from host defenses [14]. Alternatively, CPS het-
erogeneity may be due to incorporation of incomplete
glycan blocks or differences in the activity of the
enzymes involved in the biosynthesis of the CPS
repeats. Future work will focus on elucidating the
biosynthetic pathway responsible for MeOPN produc-
tion; establishing the biological role of the MeOPN
in C. jejuni and; determining the structure of CPS in
other strains of C. jejuni to establish the commonality
of this CPS modification within this species. The
results generated by these future initiatives will ulti-
mately determine the potential of the MeOPN modifi-
cation as a useful marker and therapeutic target for
this mucosal pathogen.
Experimental procedures
Solvents and reagents
Unless otherwise stated, all solvents and reagents were
purchased from Sigma Biochemicals and Reagents (Oakville,
Canada).
Media and growth conditions
The C. jejuni HS:1 serostrain (ATCC 43429, designation
MK5-S7630) was routinely maintained on Mueller Hinton
(MH) agar (Difco, Kansas City, MO, USA) plates under
microaerophilic conditions (10% CO
2
,5%O
2
, 85% N
2
)at
37 °C. For large scale extraction of CPS, 6 L of C. jejuni
HS:1 was grown in brain heart infusion (BHI) broth
(Difco) under microaerophilic conditions at 37 °C for 24 h
with agitation at 100 r.p.m. Bacterial cells were then har-
vested by centrifugation (9000 g for 20 min) and placed in
D. J. McNally et al. Campylobacter jejuni HS:1 serostrain CPS
FEBS Journal 272 (2005) 4407–4422 ª 2005 FEBS 4417
70% (v ⁄ v) ethanol. Cells were removed from the ethanol
solution by centrifugation (9000 g for 20 min) and the bac-
terial pellet was refrigerated until extraction.
Hot water/phenol isolation of CPS
Bacterial CPS was extracted using the hot water ⁄ phenol
method according to Westphal and Jann [19]. Briefly,
bacterial cells harvested from 6 L of BHI broth were
blended in 90% phenol at 96 °C for 15 min, allowed to
cool for 30 min and then dialyzed (MWCO 12 KDa,
Sigma) against running water for 72 h. The volume of
the bacterial extract was then reduced to approximately
100 mL under vacuum (37 °C), ultracentrifuged (140 kG,
15 °C) for 2 h and the supernatant, which contained
crude CPS, was flash frozen in an acetone ⁄ dry ice bath
and lyophilized to dryness. Crude CPS was then resus-
pended in H
2
O and purified using a SephadexÒ superfine
G-50 column (Sigma, Oakville, Canada) equipped with a
Waters differential refractometer (model R403, Waters,
Mississauga, Canada).
1
H NMR at 400 MHz (Varian,
Palo Alto, CA, USA) was then used to screen fractions
and those found to contain CPS were combined, flash
frozen in an acetone ⁄ dry ice bath and lyophilized to dry-
ness. Semi-purified CPS was then re-suspended in H
2
O
and purified using a Gilson liquid chromatograph (model
306 and 302 pumps, 811 dynamic mixer, 802B manomet-
ric module, with a Gilson UV detector (220 nm) (model
UV ⁄ Vis-151 detector, Gilson, Middleton, WI, USA)
equipped with a tandem QHP HiTrap
TM
ion exchange
column (Amersham Biosciences, Piscataway, NJ, USA).
Fractions containing CPS were combined, flash frozen in
an acetone ⁄ dry ice bath and lyophilized to dryness. Puri-
fied bacterial CPS was then de-salted using a SephadexÒ
superfine G-15 column (Sigma) and fractions found to
contain CPS were combined, flash frozen in an acetone ⁄
dry ice bath, lyophilized to dryness and stored at )20 °C
until further analysis.
Enzymatic isolation of CPS
An enzymatic method of isolating CPS from C. jejuni HS:1
cells was developed based on the methodologies of [20],
Huebner et al. [21] and Hsieh et al. [22]. Bacterial cells har-
vested from 6 L of BHI broth were suspended in NaCl ⁄ P
i
buffer (pH 7.4). Lysozyme was then added to a final con-
centration of 1 mgÆmL
)1
(Sigma) prior to the addition of
mutanolysin to a final concentration of 67 UÆmL
)1
(Sigma).
The bacterial cell suspension was then incubated for 24 h at
37 °C with agitation at 100 r.p.m. The mixture was then
emulsiflexed twice (21 000 psi) to lyse cells, and DNAse I
and RNAse (130 lgÆ mL
)1
DNAse I and RNAse, Sigma)
was added prior to being incubated for 4 h at 37 °C with
agitation at 100 r.p.m. Following digestion with nucleases,
pronase and protease was added to a final concentration of
200 lgÆmL
)1
(Sigma) before being incubated at 37 °C over-
night with agitation at 100 r.p.m. The crude CPS extract
was then dialyzed against running water for 72 h (MWCO
12 kDa, Sigma), ultracentrifuged for 2 h (140 kG, 15 °C)
and the supernatant, containing crude CPS, was lyophilized
to dryness. CPS was then purified using the same chroma-
tographic protocol described above.
Sugar composition analysis of enzyme purified
CPS
The composition of an enzyme purified sample of C. jejuni
HS:1 CPS was determined using the alditol acetate method
adapted from Sawardeker et al. [48]. A 1 mg sample of
CPS was hydrolyzed by adding 0.5 mL of 3 m trifluoroace-
tic acid and heating at 100 °C for 2 h. Hydrolyzed CPS
was then dried under a nitrogen stream at room tempera-
ture prior to reduction with 5 mg of NaBH
4
in 300 lLof
H
2
O. The reaction was allowed to proceed for 1 h at room
temperature and was stopped by the addition of 0.5 mL of
HOAc. Reduced CPS sugars were then dried under a nitro-
gen stream at room temperature prior to the addition of
three volumes of MeOH (3 · 1 mL), with a drying step per-
formed between each volume of MeOH. Acetylation was
achieved by the addition of 0.5 mL of acetic anhydride and
heating at 85 °C for 30 min prior to being dried at room
temperature under a nitrogen stream. Alditol acetate
derived CPS sugars were then suspended in 1.5 mL of
CH
2
Cl
2
and analyzed using an Agilent 6850 series GC sys-
tem, equipped with an Agilent 19091 L-433E 50% phenyl
siloxane capillary column (30 m · 250 lm · 0.25 lm)
(170 °C to 250 °C, 2.8 °CÆmin
)1
) (Agilent Technologies,
Palo Alto, CA, USA). Alditol acetate derivatives of authen-
tic standards for common keto and aldo sugars (Sigma)
were then prepared using the same protocol outlined above.
The composition of C. jejuni HS:1 CPS was then unambig-
uously determined by comparing the retention times of
CPS alditol acetate derivatives to those of authentic stand-
ards.
Determination of absolute configuration for
enzyme purified CPS
The absolute configuration (d or l) of galactose within an
enzyme purified sample of HS:1 CPS was assigned by char-
acterization of its R-butyl glycoside using GC according to
Loentein et al. [49]. Approximately 300 lLofR-butanol
and 30 lL of acetyl chloride (Sigma) was added to 1 mg of
enzyme purified CPS. The mixture was then heated at
85 °C for 3 h prior to being dried under a nitrogen stream
at room temperature. Following the addition of 500 lLof
acetic anhydride and pyridine, the mixture was heated at
85 °C for 3 h before being dried a second time. The R-butyl
glycoside of galactose was then suspended in 1.5 mL of
Campylobacter jejuni HS:1 serostrain CPS D. J. McNally et al.
4418 FEBS Journal 272 (2005) 4407–4422 ª 2005 FEBS
CH
2
Cl
2
and analyzed using an Agilent 6850 series GC sys-
tem, equipped with an Agilent 19091 L-433E 50% phenyl
siloxane capillary column (30 m · 250 lm · 0.25 lm)
(170 °C to 250 °C, 2.8 °CÆmin
)1
) (Agilent Technologies).
The absolute configuration of galactose in the CPS sample
was then unambiguously determined by comparing the
retention time of its R-butyl glycoside to the R- and S-butyl
glycosides of an authentic d-galactose standard prepared
using the same method (Sigma). In light of the complica-
tions reported for producing the butyl-glycosides of keto
sugars [50], the absolute configuration of fructose in HS:1
CPS was assigned enzymatically using a fructose assay kit
(Sigma) and a 1 mg sample of hydrolyzed enzyme purified
HS:1 CPS according to Rodriguez et al. [29]. As recommen-
ded by the manufacturer, the CPS sample was first treated
overnight with b-d-glucose oxidase (100 lgÆmL
)1
,37°C,
Sigma) to eliminate traces of d-glucose.
HR-MAS NMR spectroscopy of cell-bound CPS
For HR-MAS analysis, C. jejuni HS:1 cells were prepared
as according to Szymanski et al. [15]. Overnight growth
from one MH agar plate was harvested and placed in 1 mL
of 10 mm potassium-buffered 98% D
2
O (pD 7.0) (Cam-
bridge Isotopes Laboratories Inc, Andover, MA, USA)
containing 10% sodium azide (w ⁄ v) for 1 h at room tem-
perature to kill cells. Cells were then pelleted by centrifuga-
tion (8900 g for 2 min), and washed once with 10 mm
potassium-buffered D
2
O. Approximately 10 lLof1%
(w ⁄ v) TSP was then added as an internal standard
(0 p.p.m) to the cell suspension prior to being loaded into a
40 lL nano-NMR tube (Varian, Palo Alto, CA, USA)
using a long tipped pipette cut diagonally approximately
1 cm from the end. HR-MAS experiments were performed
using a Varian Inova 500 MHz spectrometer equipped with
a Varian 4 mm indirect detection gradient nano-NMR
probe with a broadband decoupling coil (Varian) as previ-
ously described [2,15,51]. Spectra from 40 lL cell samples
were spun at 3 kHz and recorded in ambient temperature
(23 °C), or at 10 °C to shift the HOD signal, and all experi-
ments were performed with suppression of the HOD signal.
1
H NMR spectra of bacterial cells were acquired using the
Carr-Purcell-Meiboom-Gill (CPMG) pulse sequence (90-(s-
180-s)
n
-acquisition) [52] to remove broad signals originating
from lipids and solid-like materials, and the total duration
of the CPMG pulse (n*2 s) was 10 ms with s set to
(1 ⁄ MAS spin rate).
1
H NMR spectra for cell-bound CPS
on bacterial cells were typically obtained using 256 tran-
sients (11 min). The 2D-NOESY spectrum for cell-bound
CPS was acquired using 16 transients ⁄ 256 increments and a
mixing time of 100 ms (3 h), and the 1D-NOESY spectrum
was acquired using 8100 transients ⁄ 64 increments and a
mixing time of 200 ms (14 h).
31
P-decoupled
31
P HSQC
spectra were acquired using 512 transients ⁄ 64 increments
and a coupling constant of 10 Hz (33 h).
High resolution NMR spectroscopy
To obtain the hydrolyzed defructosylated repeating unit of
HS:1 CPS (CPS-1), a 3 mg sample of enzyme purified CPS
was suspended in 150 lL of nonbuffered 99% D
2
O (pD
2.2) (Cambridge Isotopes Laboratories Inc) and placed in a
3 mm NMR tube (Wilmad, Buena, NJ, USA). The hydro-
lysis reaction, achieved using the natural acidity of HS:1
CPS, was then surveyed periodically over the course of four
days using NMR analysis at 600 MHz with an ultra-sensi-
tive, cryogenically cooled probe. Analysis of the repeating
unit and hydrolysis products over time was facilitated by
the high sensitivity of the cryoprobe as
13
C HSQC spectra
were typically acquired in approximately 1 h. For analysis
of hot water ⁄ phenol purified CPS and enzyme purified CPS
samples (CPS-2), a 3 mg sample of each was suspended in
150 lLofNH
4
HCO
3
buffered 99% D
2
O (54 mm, pD 8.6),
placed in 3 mm NMR tubes and analyzed by NMR.
For all CPS samples,
1
H NMR,
13
C HSQC, HMBC,
HMQCTOCSY, COSY, TOCSY, NOESY and selective
one-dimensional TOCSY, NOESY and NOESY-TOCSY.
NMR experiments were performed at 600 MHz (
1
H) using
a Varian 5 mm, Z-gradient triple resonance cryogenically
cooled probe (Varian). The methyl resonance of acetone
was used as an internal reference (d
H
2.225 p.p.m. and d
C
31.07 p.p.m.). The
31
P HSQC experiments were performed
using a Varian Inova 500 MHz spectrometer equipped with
a Varian Z-gradient 3 mm triple resonance (
1
H,
13
C,
31
P)
probe. The 1D
31
P spectra were acquired using a Varian
Mercury 200 MHz (
1
H) spectrometer and a Nalorac 5 mm
four nuclei probe. For all
31
P experiments, spectra were ref-
erenced to an external 85% (v ⁄ v) phosphoric acid standard
(d
P
0 p.p.m.). NMR experiments were typically performed
at 25 °C with suppression of the deuterated HOD reson-
ance at 4.78 p.p.m. Standard homo- and heteronuclear cor-
related two-dimensional pulse sequences from Varian were
used for general assignments, and selective one-dimensional
TOCSY and NOESY experiments with a Z-filter were used
for complete residue assignment and characterization of
individual spin systems [53,54].
Mass spectrometry analysis
CE-ESI-MS and CE-ESI-MS ⁄ MS analysis was performed
using a Crystal Model 310 Capillary Electrophoresis instru-
ment (ATI Unicam, Boston, MA, USA) coupled to a 4000
QTRAP mass spectrometer (Applied Biosystems ⁄ Sciex,
Concord, Canada) via a Turbo ‘V’ CE-MS probe. A sheath
solution (isopropanol ⁄ methanol, 2 : 1, v ⁄ v) was delivered at
a flow rate of 1 lLÆmin
)1
. Separations were achieved on
approximately 90 cm of bare fused-silica capillary (360 lm
outside diameter · 50 lm i.d., Polymicro Technologies,
Phoenix, AZ, USA) and 15 mm ammonium acetate ⁄ ammo-
nium hydroxide in deionized water (pH 9.0) containing 5%
(v ⁄ v) MeOH as mobile phase. A voltage of 20 kV was
D. J. McNally et al. Campylobacter jejuni HS:1 serostrain CPS
FEBS Journal 272 (2005) 4407–4422 ª 2005 FEBS 4419
typically applied during CE separation and )5 kV was used
as electrospray voltage. Mass spectra were acquired with
dwell times of 5.5 ms per step of 0.1 m ⁄ z
)1
unit in Q1 scan
mode. Tandem mass spectra were acquired in the enhanced
product ion scan (EPI) mode, using nitrogen as collision
gas. Fill time of the trap (Q3) was set to 20 ms and the
LIT scan rate was adjusted to 4000 amuÆs
)1
.
Molecular dynamics simulations
Molecular dynamics modeling was used to verify NOEs
observed for C. jejuni HS:1 CPS during NMR analyses.
CPS molecular models were constructed using the Biopoly-
mer module of the insight ii software package (Accelrys
Inc, San Diego, CA, USA), and then subjected to a 3000-
step energy minimization using a conjugate gradient
method. Atomic potentials were assigned automatically
using an extensible systematic forcefield, and glycosidic tor-
tions of energy-minimized structures were compared to a
potential energy map constructed using the same forcefield,
nonbond cutoff distance and dielectric value used for
molecular dynamics simulations. Molecular dynamics simu-
lations were then performed in vacuum for 500 ps, using
the discover-3 software running on an Insight II environ-
ment (Accelrys Inc) and data generated during the first
100 ps was discarded to allow the systems to reach equilib-
rium. A Verlet algorithm with a 2 fs timestep, extensible
systematic forcefield, group-based nonbond method with a
cutoff distance of 9.5 A
˚
and a distance-dependent dielectric
value of 4 was then used for the simulations with trajectory
frames being saved every 0.25 ps. The molecular model of
an energy minimized structure was drawn using vmd [55].
Acknowledgements
The authors thank Dr Hongbin Yan for helpful discus-
sions, Denis Brochu for technical assistance, Marc
Lamoureux for assistance in growing and harvesting
cells and the Natural Sciences and Engineering
Research Council of Canada (NSERC) for funding.
References
1 Ketley JM (1997) Pathogenesis of enteric infection by
Campylobacter. Microbiology 143, 5–21.
2 St Michael F, Szymanski CM, Li J, Chan KH, Khieu
NH, Larocque S, Wakarchuk WW, Brisson JR &
Monteiro MA (2002) The structures of the lipooligosac-
charide and capsule polysaccharide of Campylobacter
jejuni genome sequenced strain NCTC 11168. Eur J
Biochem 269, 5119–5136.
3 Rhodes KM & Tattersfield AE (1982) Guillain–Barre
´
syndrome associated with Campylobacter infection. Br
Med J Clin Res 285, 173–174.
4 Kaldor J & Speed BR (1984) Guillain–Barre
´
syndrome
and Campylobacter jejuni: a serological study. Br Med J
Clin Res 288, 1867–1870.
5 Jacobs BC, Endtz H, van der Meche FG, Hazenberg
MP, Achtereekte HA & van Doorn PA (1995) Serum
anti-GQ1b IgG antibodies recognize surface epitopes on
Campylobacter jejuni from patients with Miller Fisher
syndrome. Ann Neurol 37, 260–264.
6 Parkhill J, Wren BW, Mungall K, Ketley JM, Churcher
C, Basham D, Chillingworth T, Davies RM, Feltwell T,
Holroyd S, Jagels K, Karlyshev AV, Moule S, Pallen
MJ, Penn CW, Quail MA, Rajandream MA, Ruther-
ford KM, van Vliet AH, Whitehead S & Barrell BG
(2000) The genome sequence of the food-borne patho-
gen Campylobacter jejuni reveals hypervariable
sequences. Nature 403, 665–668.
7 Whitfield C & Roberts IS (1999) Structure, assembly
and regulation of expression of capsules in Escherichia
coli. Mol Microbiol 31, 1307–1319.
8 Karlyshev AV, Henderson J, Ketley JM & Wren BW
(1999) Procedure for the investigation of bacterial
genomes: random shot-gun cloning, sample sequencing
and mutagenesis of Campylobacter jejuni. Biotechniques
26, 50–52,54,56.
9 Penner JL & Hennessy JN (1980) Passive hemagglutina-
tion technique for serotyping Campylobacter fetus subsp.
jejuni on the basis of soluble heat-stable antigens. J Clin
Microbiol 12, 732–737.
10 Karlyshev AV, Linton D, Gregson NA, Lastovica AJ &
Wren BW (2000) Genetic and biochemical evidence of a
Campylobacter jejuni capsular polysaccharide that
accounts for Penner serotype specificity. Mol Microbiol
35, 529–541.
11 Bacon DJ, Szymanski CM, Burr DH, Silver RP,
Alm RA & Guerry P (2001) A phase-variable capsule is
involved in virulence of Campylobacter jejuni 81–176.
Mol Microbiol 40, 769–777.
12 Karlyshev AV & Wren BW (2001) Detection and initial
characterization of novel capsular polysaccharide among
diverse Campylobacter jejuni strains using alcian blue
dye. J Clin Microbiol 39, 279–284.
13 Karlyshev AV, McCrossan MV & Wren BW (2001)
Demonstration of polysaccharide capsule in Campylo-
bacter jejuni using electron microscopy. Infect Immun
69, 5921–5924.
14 Karlyshev AV, Champion OL, Churcher C, Brisson
JR, Jarrell HC, Gilbert M, Brochu D, St Michael F,
Li J, Wakarchuk WW, Goodhead I, Sanders M,
Stevens K, White B, Parkhill J, Wren BW &
Szymanski CM (2005) Analysis of Campylobacter
jejuni capsular loci reveals multiple mechanisms for
the generation of structural diversity and the
ability to form complex heptoses. Mol Microbiol 55,
90–103.
Campylobacter jejuni HS:1 serostrain CPS D. J. McNally et al.
4420 FEBS Journal 272 (2005) 4407–4422 ª 2005 FEBS
15 Szymanski CM, St Michael F, Jarrell HC, Li J, Gilbert
M, Larocque S, Vinogradov E & Brisson JR (2003)
Detection of conserved N-linked glycans and phase-vari-
able lipooligosaccharides and capsules from campylo-
bacter cells by mass spectrometry and high resolution
magic angle spinning NMR spectroscopy. J Biol Chem
278, 24509–24520.
16 Roberts IS (1996) The biochemistry and genetics of cap-
sular polysaccharide production in bacteria. Annu Rev
Microbiol 50, 285–315.
17 McDonald AG (1993) Lipopolysaccharides from Cam-
pylobacter. PhD Thesis, York University, North York,
Canada.
18 Moran, AP, Penner, JL & Aspinall, GO (2000)
Campylobacter lipopolysaccharides. In Campylobacter
(Nachamkin I & Blaser MJ, eds), pp. 241–257.
American Society for Microbiology, Washington, D.C.,
USA.
19 Westphal O & Jann K (1965) Bacterial lipopolysac-
charide. Extraction with phenol-water and further
applications of the procedure. Meth Carbohydr Chem
5, 88–91.
20 Darveau RP & Hancock RE (1983) Procedure for isola-
tion of bacterial lipopolysaccharides from both smooth
and rough Pseudomonas aeruginosa and Salmonella
typhimurium strains. J Bacteriol 155, 831–838.
21 Huebner J, Wang Y, Krueger WA, Madoff LC, Marti-
rosian G, Boisot S, Goldmann DA, Kasper DL, Tziana-
bos AO & Pier GB (1999) Isolation and chemical
characterization of a capsular polysaccharide antigen
shared by clinical isolates of Enterococcus faecalis and
vancomycin-resistant Enterococcus faecium. Infect
Immun 67, 1213–1219.
22 Hsieh YC, Liang SM, Tsai WL, Chen YH, Liu TY &
Liang CM (2003) Study of capsular polysaccharide from
Vibrio parahaemolyticus. Infect Immun 71, 3329–3336.
23 Li J, Wang Z & Altman E (2005) In-source fragmenta-
tion and analysis of polysaccharides by capillary electro-
phoresis ⁄ mass spectrometry. Rapid Commun Mass
Spectrom 19, 1305–1314.
24 Rundlof T & Widmalm G (1996) A method for deter-
mination of the absolute configuration of chiral glycerol
residues in natural products using TEMPO oxidation
and characterization of the glyceric acids formed. Anal
Biochem 243, 228–233.
25 van Wazer JR, Callis CF, Shoolery JN & Jones RC
(1956) Principles of phosphorus chemistry. II. Nuclear
magnetic resonance measurements. J Am Chem Soc 78,
5715–5726.
26 Nielsen ML, Pustinger JV & Strobel J (1964) Phospho-
rus-31 nuclear magnetic resonance chemical shifts of
phosphorus compounds. J Chem Eng Data 9, 167–170.
27 Bock K & Pedersen C (1983) Carbon-13 nuclear mag-
netic resonance spectroscopy of monosaccharides. Adv
Carbohydr Chem Biochem 41, 27–66.
28 Hofmann P, Jann B & Jann K (1985) Structure of the
fructose-containing K52 capsular polysaccharide of uro-
pathogenic Escherichia coli O4:K52:H Eur J Biochem
147, 601–609.
29 Rodriguez ML, Jann B & Jann K (1990) Structure and
serological properties of the capsular K11 antigen of
Escherichia coli O13:K11:H11. Carbohydr Res 196, 101–
109.
30 Guijarro JI, Gonzalez-Pastor JE, Baleux F, San Millan
JL, Castilla MA, Rico M, Moreno F & Delepierre M
(1995) Chemical structure and translation inhibition
studies of the antibiotic microcin C7. J Biol Chem 270,
23520–23532.
31 Aspinall GO, McDonald AG, Raju TS, Pang H, Moran
AP & Penner JL (1993) Chemical structures of the core
regions of Campylobacter jejuni serotypes O:1, O:4,
O:23, and O:36 lipopolysaccharides. Eur J Biochem 216,
880.
32 Volpi N (2003) Milligram-scale preparation and purifi-
cation of oligosaccharides of defined length possessing
the structure of chondroitin from defructosylated capsu-
lar polysaccharide K4. Glycobiology 13, 635–640.
33 Meng G & Futterer K (2003) Structural framework of
fructosyl transfer in Bacillus subtilis levansucrase. Nat
Struct Biol 10 , 935–941.
34 van der Kaaden A, van Doorn-van Wakeren J, Kamer-
ling JP, Vliegenthart JF & Tiesjema RH (1984) Struc-
ture of the capsular antigen of Neisseria meningitidis
serogroup H. Eur J Biochem 141, 513–519.
35 Fujimoto A & Smith RA (1962) Metabolism of phos-
phoramidates. II. Further studies on the Escherichia coli
phosphoramidate phosphoryl transfer enzyme. Biochim
Biophys Acta 56, 501–511.
36 Parvin R & Smith RA (1969) Phosphoramidates. V.
Probable identity of rat liver microsomal glucose 6-
phosphatase, phosphoramidase, and phosphoramidate-
hexose phosphotransferase. Biochemistry 8, 1748–1755.
37 Robinson VL & Stock AM (1999) High energy
exchange: proteins that make or break phosphoramidate
bonds. Structure Fold Des 7, R47–R53.
38 Zapf JW, Hoch JA & Whiteley JM (1996) A phospho-
transferase activity of the Bacillus subtilis sporulation
protein Spo0F that employs phosphoramidate sub-
strates. Biochemistry 35, 2926–2933.
39 Deretic V, Leveau JH, Mohr CD & Hibler NS (1992)
In vitro phosphorylation of AlgR, a regulator of
mucoidy in Pseudomonas aeruginosa, by a histidine
protein kinase and effects of small phospho-donor mole-
cules. Mol Microbiol 6, 2761–2767.
40 Lukat GS, McCleary WR, Stock AM & Stock JB
(1992) Phosphorylation of bacterial response regulator
proteins by low molecular weight phospho-donors. Proc
Natl Acad Sci USA 89, 718–722.
41 Welch M, Oosawa K, Aizawa S & Eisenbach M (1993)
Phosphorylation-dependent binding of a signal molecule
D. J. McNally et al. Campylobacter jejuni HS:1 serostrain CPS
FEBS Journal 272 (2005) 4407–4422 ª 2005 FEBS 4421
to the flagellar switch of bacteria. Proc Natl Acad Sci
USA 90, 8787–8791.
42 Amster-Choder O & Wright A (1997) BglG, the
response regulator of the Escherichia coli bgl operon, is
phosphorylated on a histidine residue. J Bacteriol 179,
5621–5624.
43 McEvoy MM & Dahlquist FW (1997) Phosphohisti-
dines in bacterial signaling. Curr Opin Struct Biol 7,
793–797.
44 Mayover TL, Halkides CJ & Stewart RC (1999) Kinetic
characterization of CheY phosphorylation reactions:
comparison of P-CheA and small-molecule phospho-
donors. Biochemistry 38 , 2259–2271.
45 Hoch JA (2000) Two-component and phosphorelay sig-
nal transduction. Curr Opin Microbiol 3, 165–170.
46 Silversmith RE, Appleby JL & Bourret RB (1997) Cata-
lytic mechanism of phosphorylation and dephosphoryla-
tion of CheY: kinetic characterization of imidazole
phosphates as phosphodonors and the role of acid cata-
lysis. Biochemistry 36, 14965–14974.
47 Bras A, Chatterjee S, Wren BW, Newell DG & Ketley
JM (1999) A novel Campylobacter jejuni two-component
regulatory system important for temperature-dependent
growth and colonization. J Bacteriol 181, 3298–3302.
48 Sawardeker JS, Sloneker JH & Jeanes A (1965) Quanti-
tative determination of monosaccharides as their alditol
acetates by gas liquid chromatography. Anal Chem 37,
1602–1604.
49 Loentein K, Lindberg B & Lonngren J (1978) Assign-
ment of absolute configuration of sugars by G.L.C. of
their acetylated glycosides formed from chiral alcohols.
Carbohydr Res 62 , 359–362.
50 Chaplin MF (1994) Monosaccharides. In Carbohydrate
Analysis. A Practical Approach (Chaplin MF & Ken-
nedy JF, eds), pp. 1–36. IRL Press, Oxford, UK.
51 Young NM, Brisson JR, Kelly J, Watson DC, Tessier
L, Lanthier PH, Jarrell HC, Cadotte N, St Michael F,
Aberg E & Szymanski CM (2002) Structure of the N-
linked glycan present on multiple glycoproteins in the
gram-negative bacterium, Campylobacter jejuni. J Biol
Chem 277, 42530–42539.
52 Meiboom S & Gill D (1958) Modified Spin-Echo
Method for Measuring Nuclear Relaxation Times. Rev
Scientific Instruments 29, 688–691.
53 Brisson JR, Sue SC, Wu WG, McManus G, Nghia PT
& Uhrin D (2002) NMR of carbohydrates: 1D homonu-
clear selective methods. In NMR Spectroscopy of Glyco-
conjugates (Jimenez-Barbero J & Peters T, eds), pp.
59–93. Wiley-VCH, Weinhem, Germany.
54 Uhrin D & Brisson JR (2000) Structure determination
of microbial polysaccharides by high resolution NMR
spectroscopy. In NMR in Microbiology: Theory and
Applications (Barbotin JN & Portais JC, eds), pp. 165–
190. Horizon Scientific Press, Wymondham, UK
55 Humphrey W, Dalke A & Schulten K (1996) VMD: vis-
ual molecular dynamics. J Mol Graph 14, 33–38.
Campylobacter jejuni HS:1 serostrain CPS D. J. McNally et al.
4422 FEBS Journal 272 (2005) 4407–4422 ª 2005 FEBS