Báo cáo khoa học: Development of a baculovirus-based fluorescence resonance energy transfer assay for measuring protein–protein interaction potx
Bạn đang xem bản rút gọn của tài liệu. Xem và tải ngay bản đầy đủ của tài liệu tại đây (340.71 KB, 9 trang )
Development of a baculovirus-based fluorescence resonance energy
transfer assay for measuring protein–protein interaction
Timothy C. Cheung and John P. Hearn
Developmental Biology Research Group, Research School of Biological Sciences, The Australian National University,
Canberra, Australia
A new baculovirus-based fluorescence resonance energy
transfer (Bv-FRET) assay for measuring multimerization of
cell surface molecules in living cells is described. It has been
demonstrated that gonadotropin-releasing hormone recep-
tor (GnRH-R) was capable of forming oligomeric com-
plexes in the plasma membrane under normal physiological
conditions. The mouse gonadotropin-releasing hormone
receptor GnRH-R was used to evaluate the efficiency and
potential applications of this assay. Two chimeric constructs
of GnRH-R were made, one with green fluorescent protein
as a donor fluorophore and the other with enhanced yellow
fluorescent protein as an acceptor fluorophore. These chi-
meric constructs were coexpressed in an insect cell line (BTI
Tn5 B1-4) using recombinant baculoviruses. Energy transfer
occurred from the excited donor to the acceptor when they
were in close proximity. The association of GnRH-R was
demonstrated through FRET and the fluorescence observed
using a Leica TSC-SPII confocal microscope. FRET was
enhanced by the addition of a GnRH agonist but not by an
antagonist. The Bv-FRET assay constitutes a highly effi-
cient, reliable and convenient method for measuring pro-
tein–protein interaction as the baculovirus expression system
is superior to other transfection-based methods. Addition-
ally, the same insect cell line can be used routinely for
expressing any recombinant proteins of interest, allowing
various combinations of molecules to be tested in a rapid
fashion for protein–protein interactions. The assay is a
valuable tool not only for the screening of new molecules
that interact with known bait molecules, but also for con-
firming interactions between other known molecules.
Keywords: FRET; baculovirus; membrane protein–protein
interaction; dimerization; GnRH receptor.
The dimerization of cell surface molecules represents one of
the most important phenomena in signal transduction
because it opens a new level of understanding of the basic
function and interactions of these molecules. Many mole-
cules that were thought to function as monomers are in fact
capable of forming dimeric or oligomeric complexes, and
many membrane proteins such as receptor tyrosine kinases
[1,2], membrane lymphotoxin-ab ligands [3–6], receptors for
growth hormone [7–10], and many G protein-coupled
receptors associate as functional oligomeric complexes
[11–14]. Consequently, there is an increasing demand for a
reliable and convenient assay for measuring protein–protein
interactions in living cells.
In the past few years, a number of different fluorescence
resonance energy transfer (FRET)-based assays have been
developed [15–20]. FRET is a useful method for investi-
gating the associations of molecules. It is based on the
transfer of energy from one fluorophore (the donor) to
another fluorophore (the acceptor) that usually emits
fluorescence of a different colour. As FRET efficiency
depends on the distance between the donor and acceptor
(usually less then 100 A
˚
apart) [21–25], it provides a useful
assessment for protein–protein interaction, especially the
dimerization of cell surface molecules.
So far, most FRET assays performed in vivo have been
performed primarily in transfected cells. A major disadvan-
tage of the transfection-based FRET assays lies in the
difficulty of controlling the level of individual recombinant
protein expression in transfected cell cultures. The expres-
sion of recombinant proteins in transient-transfected cells is
influenced by many factors, including transfection efficiency
of a given cell type, the quality of the DNA, the quantity of
DNA taken up by the cells, the cytotoxicity of the
transfection reagents, and the condition of the cells. For
example, low transfection efficiency results in having
insufficient cells that coexpress both donor and acceptor
fluorophores. In addition, a low level of protein expression
may result in insufficient amounts of donor and acceptor
fluorophores located in close vicinity, reducing the prob-
ability of their interaction. Furthermore, FRET efficiency
also depends on the ratio of coexpression between donor
and acceptor fluorophores (Table 1). To exclude artefacts
Correspondence to T. C. Cheung, Division of Molecular Immunology,
La Jolla Institute for Allergy and Immunology, 10355 Science Center
Drive, San Diego, CA 92121, USA.
Fax: + 1 858 558 3525, Tel.: + 1 858 558 3500,
E-mail:
Abbreviations: FRET, fluorescence resonance energy transfer;
Bv-FRET, baculovirus-based FRET; GnRH, gonadotropin-releasing
hormone; GnRH-R, GnRH receptor; GFP, green fluorescent protein;
EYFP, enhanced yellow fluorescent protein; Tn5 cells, BTI Tn5 B1-4
cells; MOI, multiplicity of infection; LTa,lymphotoxina;LTb,
lymphotoxin b;IL-2Ra, interleukin-2 receptor a-subunit.
(Received 11 August 2003, revised 21 October 2003,
accepted 24 October 2003)
Eur. J. Biochem. 270, 4973–4981 (2003) Ó FEBS 2003 doi:10.1046/j.1432-1033.2003.03899.x
due to aberrant donor to acceptor expression ratios and to
increase the FRET signal-to-noise ratio, an optimal level of
expression for both donor and acceptor is a basic require-
ment for FRET. Although some of the drawbacks associ-
ated with expressing recombinant proteins through
transient-transfected cells could be minimized by using
stable-transformed cells with the capability of coexpressing
multiple recombinant proteins at a desirable level and ratio,
these procedures are time consuming as well as labor
intensive. Therefore, FRET assays using stable-transformed
cells are unlikely to be a popular choice for many
researchers.
As the accuracy and sensitivity of FRET assays rely on
the ability to optimize protein expression in cell culture, it is
necessary to perform them using a reliable protein expres-
sion system. The baculovirus system has proven to be one of
the most powerful and reliable eukaryotic protein expres-
sion systems that can be used to express functionally active
recombinant proteins [26–32]. Many of the post-transla-
tional modification pathways, such as phosphorylation,
glycosylation, myristoylation and palmitoylation present in
mammalian systems are also utilized in insect cell lines,
allowing the production of recombinant protein that is
functionally similar to the native mammalian protein
[33,34]. Most importantly, the baculovirus system allows
one to achieve a fine control on the level of recombinant
protein expression, manipulating it by adjusting the multi-
plicity of infection (MOI).
By combining the merits of both FRET and the
baculovirus system, a new baculovirus-based FRET (Bv-
FRET) assay was developed for detecting protein–protein
interaction. This system offers all the advantages of FRET
assays but overcomes the shortcomings of the transfection-
based methods. The Bv-FRET assay has two major
advantages. Firstly, it allows protein–protein interactions
to be observed in living cells with confocal microscopy.
Secondly, it allows direct control of the level of individual
recombinant protein expression and coexpression of both
donor and acceptor fluorophores in a desirable ratio.
Lundin et al. reported a FRET-based assay for meas-
uring protein expression on the cell surface using a
baculovirus expression system. Their study used europium
as a donor attaching to the biotinylated cell surface of the
Sf9 cells. The human interleukin-2 receptor a-subunit (IL-
2Ra) was also expressed on the cell surface by infecting the
cells with recombinant baculoviruses. FRET was used as
an assessment for protein expression on the cell surface
through the Cy5-labeled antibody against IL-2Ra as
an acceptor fluorophore. Although their assay was not
designed to study protein dimerization, it demonstrated the
potential application of baculovirus in the FRET-based
assays [15].
GnRH-R is a member of the G protein-coupled receptors
superfamily, which represents the largest grouping of cell
surface receptors, mediating a wide variety of extracellular
stimuli, such as light, Ca
2+
, odors, pheromones, peptides
and proteins [35]. All G protein-coupled receptors have a
common central core, which is composed of seven trans-
membrane domains connected be three extracellular loops
and three intracellular loops [36]. Recent studies showed
that GnRH-R was capable of forming multimeric com-
plexes in the cell surface under normal physiological
conditions [37,38]. It has also been shown that functionally
active GnRH-R can be expressed in insect cells using
recombinant baculovirus [29,30]. In the present study, the
mouse GnRH-R was used to evaluate the efficiency of the
new Bv-FRET assay.
Materials and methods
Construction of expression plasmids
A mouse GnRH-R/green fluorescent protein (GFP) bacu-
lovirus expression plasmid was constructed by inserting
GnRH-R cDNA in multiple cloning sites upstream of the
GFP of a PVL1393 BioGreen vector (Pharmingen, San
Diego, CA, USA). The mouse GnRH-R insert was
synthesized by PCR using Pfu DNA polymerase (Promega,
Madison, WI, USA) and mouse GnRH-R cDNA (generous
gift of M. Perrin, Salk Institute, San Diego, CA, USA) as a
template. A BglII restriction site (bold) was introduced into
the forward primer (5¢-CCTGTCAGATCTCCGCCAT
GGCTAACAATGCATCTCT-3¢), and a BamHI site
(bold) was introduced into the reverse primer (5¢-TCTCC
CGGATCCAAAGAGAAATACCCATA-TA-3¢) to facili-
tate vector–insert ligation. Amplification conditions were
4 min at 92 °C, followed by 35 cycles of 1 min at 92 °C, 30 s
at 55 °C,and2 minand30 sat72 °C. A final extension was
carried out at 72 °C for 10 min. PCR products were purified
by QIAquick PCR purification columns (Qiagen, Hilden,
Germany), and a double digestion with BglII and BamHI
restriction enzymes was carried out. The PVL1393 Bio-
Green vector was linearized by BamHI digestion, and the
prepared GnRH-R insert was ligated into the prepared
vector. The ligation mixture was transformed into XL1-Blue
cells (Stratagene, San Diego, CA, USA) according to the
manufacturer’s protocol.
A mouse GnRH-R/enhanced yellow fluorescent protein
(EYFP) expression plasmid was made by removal and
replacement of GFP from the GnRH-R–GFP expression
plasmid with EYFP. GFP was removed by BamHI and
EcoRI digestions. The EYFP insert was synthesized by
PCR using Pfu DNA polymerase and pEYFP-N1 vector
(Clontech Laboratories, Palo Alto, CA, USA) as a
template. PCR was carried out as described above using
the forward primer (5¢-AATTCTGCAGTCGACGGT
AC-3¢) and the reverse primer (5¢-GATTATGAATTCG
AGTCGCGGCCGCTTTACTT-3¢). An EcoRI site (bold)
was introduced into the reverse primer. The PCR product
Table 1. The probability of formation of various complexes with refer-
ence to the ratios between molecules A and B. The Hardy–Weinberg law
was used as the mathematical model for calculating the frequency of
heterodimeric and homodimeric complexes formation.
A : B ratios
Probability (%)
AB AA BB
1 : 1 50.0 25.0 25.0
2 : 1 44.4 44.4 11.2
3 : 1 37.5 56.2 6.3
4 : 1 32.0 64.0 4.0
5 : 1 27.8 69.4 2.8
4974 T. C. Cheung and J. P. Hearn (Eur. J. Biochem. 270) Ó FEBS 2003
was purified, and a double digestion with BamHI and
EcoRI carried out. The GnRH-R–PVL1393 vector arm was
prepared by removal of GFP from the BamHI and EcoRI
sites, and the prepared EYFP insert was ligated into the
vector arm. The ligation mixture was transformed into
XL1-Blue cells according to the manufacturer’s protocol.
PVL1393 BioGreen expression plasmid was used for the
expression of cytosolic GFP. Cytosolic EYFP expression
plasmid was constructed by the removal and replacement of
GFP from the PVL1393 BioGreen vector with EYFP. GFP
was removed from the PVL1393 BioGreen vector by
BamHI and EcoRI digestions. The EYFP insert was
prepared as described above, then ligated in the prepared
vector. The ligation mixture was transformed into XL1-
Blue cells according to the manufacturer’s protocol.
Transfection and amplification of recombinant
baculoviruses
BTI Tn5 B1-4 cells (generous gift of S. Ford, Australian
National University, Canberra, Australia) were used for
expression of fusion proteins. BTI Tn5 B1-4 cells (Tn5 cells)
are a cell line derived from the Trichoplusia ni egg cells and
are commonly used for the expression of proteins using
recombinant baculoviruses. Tn5 cells (0.7 · 10
6
)were
seeded in a T25 tissue culture flask containing 5 mL of
Ex-Cell 405 medium (JRH Biosciences, Lenexa, KS, USA).
The sample was placed at room temperature and the cells
were allowed to attach firmly to flask (approximately
15 min). Transfection was performed using Lipofectin
reagent (Life Technologies, Gaithersburg, MD, USA).
The expression plasmids were cotransfected with the
BaculoGold baculovirus DNA (Pharmingen), according
to the manufacturer’s instructions. The transfected cells
were incubated at 27 °C for 4 days. Afterwards, culture
medium was collected and used to infect freshly prepared
cells for viral amplification. An end-point titration was
carried out to isolate a single clone. The recombinant
baculovirus was amplified to obtain a high titer stock
solution by infecting freshly seeded Tn5 cells at
MOI ¼ 0.5 UÆcell
)1
. The infected cells were incubated at
27 °C for 4 days before the medium was harvested. End-
point dilution was used to determine the viral titer.
GnRH-R–GFP and GnRH-R–EYFP expression
To examine the expression and subcellular localization of
the GnRH-R–GFP and GnRH-R–EYFP fusion proteins,
protein expression using recombinant baculovirus was
carried out by infecting freshly seeded Tn5 cells in a
Laboratory-Tek II chambered coverglass (Nalge Nunc
International, Naperville, IL, USA). The cells were infected
with GnRH-R–GFP or GnRH-R–EYFP recombinant
baculovirus at 3 MOIÆcell
)1
andincubatedat27°Cfor
2 days. Cells expressing the recombinant proteins were
detected with a Leica TCS-SPII confocal system (Leica,
Heidelberg, Germany) fitted to a DMIRBE microscope
(Leica) using a 63 · 1.2 numerical aperture water immersion
objective. The pinhole was set at 1 Airy disc unit, and an
appropriate dichroic beam-splitting mirror was used.
GnRH-R–GFP expressing cells were visualized by illumin-
ation using a Coherent Enterprise 651 Ar-UV laser (Coher-
ent, Santa Clara, CA, USA) with the laser line set at 364 nm,
and the fluorescence was detected at an emission window
of 480–602 nm. For the detection of GnRH-R–EYFP
fluorescence, the cells were illuminated by an Ar-visible laser
(JDS Uniphase, San Jose, CA, USA) with the laser line set at
514 nm, and the fluorescence was detected at an emission
window of 520–602 nm. The cells were illuminated with
minimum level of laser power, and images were recorded at a
frame-average of eight. To minimize photobleaching and
cell movement during imaging, the recording was completed
in approximately 5 s.
Spectral characterization of GFP and EYFP
For GFP, GnRH-R–GFP expressing cells were illuminated
with an Ar-UV laser and the laser line set at 364 nm.
Spectral scanning was carried with the interval of scanning
set at 2.24 nm. For EYFP, GnRH-R-EYFP expressing cells
were illuminated with an Ar-visible laser and the laser line
set at 488 nm. Spectral scanning was carried out as above.
FRET assay
Cell culture and expression of the GnRH-R–GFP, GnRH-
R–EYFP, cytosolic GFP and EYFP were performed as
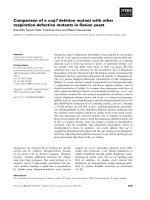
described above. The principle of the FRET assay is
illustrated in Fig. 1. GnRH agonist (pGlu-His-Trp-Ser-Tyr-
D
-Ala-N-methyl-Leu-Arg-Pro-Gly-NH
2
;Sigma,St.Louis,
MO, USA) was added to the culture at a final concentration
of 100 n
M
[37]. Five minutes after the addition of the GnRH
agonist, the prepared cells were visualized by illumination
with an Ar-UV laser and the laser line set at 364 nm. The
GnRH-R–GFP expressing cells were observed in the green
channel with the detection window at 484–512 nm. FRET,
GFP fluorescence bleed-through and EYFP emission
resulting from the Ar-UV excitation were detected at the
FRET channel with the detection window at 530–570 nm.
The net FRET image was obtained after subtracting the
GFP fluorescence bleed-through and the emission of EYFP
from Ar-UV laser excitation.
Fig. 1. Schematic illustrations of baculovirus-based fluorescence reson-
ance energy transfer (Bv-FRET) assay. GFP is fused at the C-terminal
end of the mouse GnRH-R as a donor fluorophore, and EYFP is fused
at the C-terminal end as an acceptor fluorophore and these fusion
proteins are coexpressed in a cell line (Tn5 cells). GFP is excited by an
Ar-UV laser at 364 nm, and energy transfer occurs from GFP to
EYFP that emits yellow fluorescence. The fluorescence is detected at
the FRET channel with the detection window at 530–570 nm using a
Leica TSC-SPII confocal microscope.
Ó FEBS 2003 Baculovirus-based FRET assay (Eur. J. Biochem. 270) 4975
The amount of GFP fluorescence bleed-through subtrac-
ted was derived from the fluorescence obtained from cells
only expressing GFP. To ensure the GFP fluorescence
bleed-through from the GFP and EYFP coexpressing cells
was fully subtracted, cells expressing GFP only should have
similar, preferably equal, levels of GFP expression com-
pared to that in the GFP and EYFP coexpressing cells.
Similarly, the value of the EYFP background fluorescence
(resulting from the Ar-UV laser excitation) subtracted was
based on the fluorescence obtained from cells only expres-
sing EYFP. To ensure this background fluorescence from
the GFP and EYFP coexpressing cell was fully subtracted,
the cells only expressing EYFP should have similar,
preferably equal, levels of EYFP expression compared that
in the GFP and EYFP coexpressing cells. The subtraction
(below) was carried out using the Leica
TCS
-
SPII
data
analysis software (version 2002).
FRET ¼ Total emission collection at 530À570nm
window À GFP flourescence bleed-through
À EYFP emission resulting from the
Ar-UV laser excitation:
In addition, GnRH-R–EYFP expressing cells were visual-
ized by illumination using an Ar-visible laser with the laser
line set at 514 nm. Although this excitation wavelength was
suboptimal for EYPE, it did not cause coexcitation of GFP.
EYFP expressing cells were detected in the yellow channel
with the detection window at 520–602 nm. Images were
recorded at a frame-average of eight. Each experiment was
repeated a minimum of three times.
For the time series experiment, the yellow to green
fluorescence ratio as an indicator of FRET was measured in
the presence or absence of GnRH analogues. Cell culture,
protein expression, excitation setting and emission channels
were the same as described above. A GnRH agonist (pGlu-
His-Trp-Ser-Tyr-
D
-Ala-N-methyl-Leu-Arg-Pro-Gly-NH
2
;
Sigma) or antagonist (pGlu-
D
-Phe-Trp-Ser-Tyr-
D
-Ala-Leu-
Arg-Pro-Gly-NH
2
; Sigma) was added to the cells at a final
concentration of 100 n
M
. Five minutes after the addition of
GnRH agonist or antagonist, images from the green and
FRET channels were recorded at a frame average of eight
every 2 min for up to 20 min. A minimum level of laser
power and duration of recording time were set for imaging
to minimize photobleaching and cell movement during
recording, respectively. The average intensity of the yellow
and green fluorescence in the membrane region was
measured at each time point, and values were normalized
to unity with reference to the set value at time zero. The
yellow to green ratio was calculated and the values were
plotted against time. Each assay was repeated at least three
times.
Results
Receptor expression and subcellular localization
Recent studies have shown that GnRH-R is capable of
forming stable oligomeric complexes in the plasma mem-
brane [37,38]. In this study, mouse GnRH-R was used to
examine the efficiency of our Bv-FRET assay. Two chimeric
constructs were made. One of them was fused at the
C-terminal end of the mouse GnRH-R with GFP and the
other one with EYFP. These fusion proteins were expressed
in Tn5 cells using a baculovirus expression system (Fig. 2A).
The subcellular localization of the recombinant receptors
was examined with confocal microscopy. In cells expressing
each of these receptor constructs, GFP and EYFP were
localized on the plasma membrane (Fig. 2B,C), showing
that the addition of GFP or EYFP to the C-terminal end of
GnRH-R did not affect its membrane localization.
Assay optimization
The assay was optimized in order to determine the optimal
infection intensity for individual recombinant protein
expression and conditions of measuring FRET. Protein
expression was optimized by a series titration on the
intensity of viral infection from 0.1 to 10 MOI per cell. The
results (data not shown) indicated that 2–5 MOI of each
recombinant virus per cell gave a sufficient level of protein
expression for the FRET assay while it still allowed some
cells expressing only GFP or EYFP to be found in the cell
culture. The presence of these single fluorophore-expressing
cells were essential for the FRET assay because the
fluorescence of these cells served as references for the
subtraction of background fluorescence (the GFP
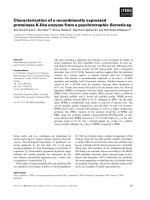
Fig. 2. Expression and subcellular localization of GnRH-R-GFP and
GnRH-R-EYFP fusion proteins. (A) Schematic diagrams of the
recombinant protein cassettes in the PVL1393 expression vector. (B)
Expression and subcellular localization of GnRH-R–GFP. GnRH-R–
GFP expressing cells were visualized using an Ar-UV laser with the
laser line set at 364 nm, and the fluorescence was detected at an
emission window of 480–602 nm. Fluorescence is coloured in green.
(C) Expression and subcellular localization of GnRH-R–EYFP in a
Tn5 cell. GnRH-R-EYFP expressing cells were illuminated by an
Ar-visible laser with the laser line set at 514 nm, and the fluorescence
was detected at an emission window of 520–602 nm. Fluorescence is
coloured in yellow. These images were recorded with a Leica TSC-SPII
confocal microscope in a frame-average of eight.
4976 T. C. Cheung and J. P. Hearn (Eur. J. Biochem. 270) Ó FEBS 2003
fluorescence bleed-through and the EYFP emission result-
ing from the Ar-UV laser excitation) of the GFP and EYFP
coexpressing cells. The assay was also optimized for the
measurement of FRET. Excitation was carried out using an
Ar-UV laser with the laser line set at 364 nm to minimize
coexcitation of EYFP, and a minimum energy level was
used for imaging to minimize photobleaching. Optimum
emission windows for both GFP and EYFP were deter-
mined with the spectral scanning program of a Leica TSC-
SPII confocal microscope. To minimize the bleed-through
of GFP fluorescence, FRET was measured at the emission
window of 530–570 nm (Fig. 3).
Dimerization of GnRH receptor
Tn5 cells were infected with both GnRH-R–GFP and
GnRH-R–EYFP recombinant baculoviruses. GnRH agon-
ist was added to the cells at a final concentration of 100 n
M
[37]. Five minutes after the addition of GnRH agonist, the
cells were illuminated using an Ar-UV laser with the laser
line set at 364 nm, and the GnRH-R–GFP expressing cells
were observed in the green channel with the detection
window at 484–512 nm. This channel is primarily for
detecting GFP expressing cells (Fig. 4A). For detection of
GnRH-R–EYFP expressing cells, EYFP was illuminated
with an Ar-visible laser with the laser line set at 514 nm, a
wavelength that did not cause coexcitation of GFP.
Fluorescence was detected in the yellow channel with the
detection window set at 520–602 nm (Fig. 4B).
Total fluorescence (FRET + GFP fluorescence bleed-
through + EYFP fluorescence resulting from the Ar-UV
laser excitation) under the Ar-UV laser excitation with the
laser line at 364 nm was measured at the FRET channel
with the detection window at 530–570 nm (Fig. 4C). The
fluorescence signal caused by FRET was obtained after
subtracting the GFP fluorescence bleed-through and the
emission of EYFP resulting from the Ar-UV laser excitation
at 364 nm (Fig. 4D). The remaining fluorescence was due to
FRET. The signal of FRET was observed under a confocal
microscope. Only in the GnRH-R–GFP and GnRH-R–
EYFP coexpressing cell did the results show the dimeriza-
tion of receptor in the plasma membrane.
Negative controls
To rule out the possibility that FRET observed in Fig. 4
might be due to protein–protein interaction between GFP
and EYFP, GFP and GnRH-R, or EYFP and GnRH-R,
two negative control experiments were designed. The
principles of these negative controls are illustrated in
Fig. 5. Tn5 cells were expressed with cytosolic GFP as well
as membrane-bound GnRH-R–EYFP, and FRET was
measured. Figure 6A shows the cytosolic GFP expressing
cells, and Fig. 6B shows the GnRH-R–EYFP expressing
cells. In cells coexpressing both GFP and GnRH-R–EYFP,
FRET was not seen after subtracting the GFP fluorescence
bleed-through and the emission of EYFP from Ar-UV laser
excitation as described in the FRET assay section
(Fig. 6C,D). These results indicate that GFP did not
interact with EYFP or GnRH-R.
An additional control experiment was carried out
using membrane-bound GnRH-R–GFP and cytosolic
Fig. 3. Spectral characterization of GnRH-R–GFP and GnRH-R–
EYFP fusion proteins. Emission spectra of both GnRH-R–GFP and
GnRH-R–EYFP were determined by the spectral scanning program of
Leica TSC-SPII confocal system. The peak of each emission curve was
normalized to a set value of 100 units. Bar lines show the range that the
detection windows were set for the FRET assay.
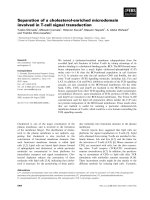
Fig. 4. Assessment of the association of GnRH-R using Bv-FRET
assay. (A) GnRH-R–GFP expressing cells. Tn5 cells were infected by
both GnRH-R–GFP and GnRH-R–EYFP recombinant baculo-
viruses. GnRH-R–GFP expressing cells were visualized by illumin-
ation using an Ar-UV laser with the laser line set at 364 nm, and the
cells were observed in the green channel with the detection window at
484–512 nm. Fluorescence is coloured in green. (B) GnRH-R–EYFP
expressing cells. Cells were visualized by illumination using an
Ar-visible laser with the laser line set at 514 nm. EYFP fluorescence
was detected in the yellow channel with the detection window at
520–602 nm. Fluorescence is coloured in yellow. (C) Fluorescence
observed in the FRET channel. FRET, GFP fluorescence bleed-
through and EYFP emission resulting form the Ar-UV excitation were
detected in the FRET channel with the emission window at
530–570 nm. Fluorescence is coloured in cyan. (D) Signal of FRET.
Net fluorescence resulting from FRET was obtained after subtracting
the GFP fluorescence bleed-through and the emission of EYFP
resulting from the Ar-UV laser excitation as observed in the FRET
channel. Fluorescence resulting from FRET is printed in shades of
gray. Calibration bar in A (20 lm) also refers to B–D.
Ó FEBS 2003 Baculovirus-based FRET assay (Eur. J. Biochem. 270) 4977
EYFP to exclude the possibility of any potential
interaction between EYFP and GnRH-R. Cells expres-
singGnRH-R-GFPandEYFPareshowninFig.6E,F,
respectively. In cells coexpressing both GnRH-R–GFP
and EYFP, FRET did not occur (Fig. 6G,H). Taken
together, these results indicate that protein–protein inter-
action did not occur between GFP and EYFP, GFP and
GnRH-R, or EYFP and GnRH-R. FRET observed in
Fig. 4D was a result of specific interaction between
GnRH-R molecules.
Fig. 5. Schematic illustrations of the negative
controls. (A) Coexpression of GnRH-R–
EYFP and cytosolic GFP in a Tn5 cell. (B)
Coexpression of GnRH-R–GFP and cytosolic
EYFP in a Tn5 cell.
Fig. 6. The results of FRET assays on the negative controls. To examine any potential interaction between GFP, EYFP and GnRH-R, FRET assay
was carried out in the GFP and GnRH-R–EYFP coexpressing cell culture. (A) Cyotsolic GFP expressing cells. GFP expressing cells were detected
by illumination using an Ar-UV laser with the laser line set at 364 nm, and the cells were observed in the green channel with the detection window at
484–512 nm. Fluorescence is coloured in green. Note the presence of GFP fluorescence in the cytoplasm. (B) GnRH-R–EYFP expressing cells.
Cells were visualized by illumination using an Ar-visible laser with the laser line set at 514 nm. EYFP fluorescence was detected in the yellow
channel with the detection window at 520–602 nm. Fluorescence is coloured in yellow. Note the presence of EYFP fluorscence only in the
membrane region. (C) Fluorescence recorded in the FRET channel. FRET (if any), GFP fluorescence bleed-through and EYFP emission resulting
from the Ar-UV excitation were detected in this channel with the emission window at 530–570 nm. Fluorescence is coloured in cyan. (D) Remaining
fluorescence after subtracting the GFP fluorescence bleed-through and EYFP emission resulted from the Ar-UV excitation. Fluorescence was not
seen after the subtraction. To examine any potential interaction between EYFP and GnRH-R, FRET assay was carried out in the GnRH-R-GFP
and EYFP coexpressing cell culture. (E) GnRH-R-GFP expressing cells. Fluorescence is coloured in green. Note green fluorescence in the
membrane region. (F) Cytosolic EYFP expressing cells. Fluorescence is coloured in yellow. Note yellow fluorescence in cytoplasm. (G) Fluores-
cence recorded in the FRET channel. Fluorescence is coloured in cyan. (H) Remaining fluorescence after subtracting the GFP bleed-through and
EYFP emission resulting from the Ar-UV excitation. Fluorescence was not seen after the subtraction. Calibration bar in A (40 lm) also refers to
B–D; bar in E (40 lm) also refers to F–H.
4978 T. C. Cheung and J. P. Hearn (Eur. J. Biochem. 270) Ó FEBS 2003
Effect of GnRH analogues on the association
of GnRH receptor
Recent data shows that GnRH agonists play a positive role
in rat GnRH-R multimerization [37,38]. The effect of a
GnRH agonist and antagonist on mouse GnRH-R dime-
rization has been examined. Tn5 cells expressing both
GnRH-R–GFP and GnRH-R–EYFP were prepared. A
GnRH agonist or antagonist was added to the cells 5 min
before measuring FRET. Images from the green and FRET
channels were recorded at intervals of 2 min up to 20 min
after the addition of the GnRH agonist or antagonist to the
final concentration of 100 n
M
[37]. The average intensity of
the yellow and green fluorescence in the membrane region
was measured at each time point, and the yellow to green
ratio was calculated. In the presence of 100 n
M
GnRH
agonist, there was an increase in the yellow to green ratio
(Fig. 7B) compared to the control (Fig. 7A). However, the
addition of an antagonist did not result in an increase of the
yellow to green ratio (Fig. 7C). These results showed that a
GnRH agonist enhanced the association of GnRH-R.
Discussion
The efficiency and potential applications of a new Bv-FRET
assay have been demonstrated by examining protein–
protein interaction between mouse GnRH-R molecules on
cell surfaces. Insect cells coexpressing GnRH-R–GFP and
GnRH-R–EYFP were prepared by infecting Tn5 cells with
recombinant baculoviruses. Additionally, cells coexpressing
GnRH-R–GFP and cytosolic EYFP, and cells coexpressing
GnRH-R–EYFP and cytosolic GFP were used as negative
controls. The association of GnRH-Rs in the plasma
membrane was demonstrated through FRET, and the
FRET signals were visualized with a confocal microscope
(Fig. 4). In contrast, when GFP or EYFP were not
membrane-anchored with GnRH-R, FRET did not occur,
as shown in the negative controls (Fig. 6). These observa-
tions indicated that FRET took place through the specific
interaction between GnRH-R molecules.
The effect of a GnRH agonist and antagonist on GnRH-
R association has also been examined. The data showed
that FRET was enhanced by the addition of a GnRH
agonist but not by an antagonist (Fig. 7), suggesting that
the GnRH agonist facilitates receptor association. Although
the molecular basis of this action has not yet been precisely
defined, it has been suggested that GnRH agonists provoke
microaggregation of the receptor [37].
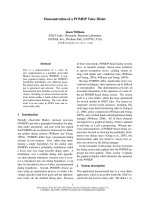
Fig. 7. Effect of GnRH analogues on the association of GnRH-R mole-
cules. Tn5 cells coexpressing both GnRH-R–GFP and GnRH-R–
EYFP were prepared. A GnRH agonist or antagonist was added to the
cells 5 min before the measurement of FRET was taken. Images from
the green channel (with detection window from 484 to 512 nm) and
FRET channel (with detection window from 530 to 570 nm) were
recorded at intervals of 2 min for up to 20 min after the addition of
GnRH agonist or antagonist in a final concentration of 100 n
M
.The
average intensity of the yellow and green fluorescence in the membrane
region was measured at each time point, and values were normalized to
unity with reference to the set value at time 0. The yellow to green
ratios were calculated and the values were plotted against time. (A)
Control experiment. A time series was taken in the absence of GnRH
analogues. (B) Cells with GnRH agonist. (C) Cells with GnRH
antagonist.
Ó FEBS 2003 Baculovirus-based FRET assay (Eur. J. Biochem. 270) 4979
The Bv-FRET assay has a number of advantages over the
transfection-based FRET assays. Firstly, the Bv-FRET
system constitutes a reliable method. It allows a researcher
to have direct control on the level of recombinant protein
expression. This not only enhances the possibility of having
a sufficient number of cells that coexpress both the donor
and acceptor fluorophores, but also to produce them in a
desirable ratio. Thus, it enhances the signal-to-noise ratio
and greatly increases the sensitivity of FRET assays.
The Bv-FRET system allows the achievement of a high
signal-to-noise ratio through protein expression. Since the
efficiency and sensitivity of FRET assays depend on certain
ratios between donor and acceptor fluorophores, the signal
to noise ratio decreases if donor to acceptor is in an
undesirable ratio. For the molecules that form homodimers
or oligomers, the ideal ratio between the two fluorophores is
1 : 1 (Table 1). Based on the Hardy–Weinberg law [39,40],
approximately 50% of the complexes would contain both
donor and acceptor fluorophores, which are essential for
FRET. However, when the ratio of the two fluorophores
becomes greater or less than 1, the chances of forming
complexes that contain both of the fluorophores will
decrease. At a ratio of 5 : 1, only around 28% of the
complexes may contain both of the fluorophores, and
approximately 72% of the complexes may contain only one
of the fluorophores. It is important to note that these single
fluorophore-forming complexes are not capable of partici-
pating in FRET. Instead, they increase the noise and reduce
the sensitivity of FRET assays. Therefore, the excess
amount of these complexes must be minimized.
Although baculovirus-infected cells eventually start to die
on the fourth or fifth day after infection, and there is a
possibility that some recombinant proteins might induce
apoptosis of cells [41], the baculovirus has proven its ability
to reconstitute functionally active cell surface multimeric
complexes in insect cells at an early stage of infection. A
well-known example is the reassembly of membrane
lymphotoxin-ab ligands (LTa1b2andLTa2b1) [32]. A
LTa1b2 complex is composed of one LTa and two LTbs,
and a LTa2b1 complex contains two LTas and one LTb.By
simply adjusting the relative ratio of infection between the
two recombinant baculoviruses (LTa and LTb), each of
these molecules was correctly reconstituted. A FRET assay
incorporating a baculovirus protein expression system is a
sophisticated method as it enables coexpression of both
donor and acceptor fluorophores in a desirable ratio with a
high signal-to-noise ratio.
Secondly, the Bv-FRET assay constitutes a highly
efficient and convenient method for measuring protein–
protein interaction. The same insect cell line can be routinely
used to express any recombinant proteins of interest,
allowing various combinations of molecules to be tested in
a rapid fashion for protein–protein interactions. Once
recombinant viral stocks are obtained, FRET measurement
can be performed 2 days after infection of the cells. Another
benefit of using recombinant baculoviruses is that they are
very stable when stored properly. Existing viral stocks can
be used for the screening of new molecules or confirming the
interaction between other known molecules. Furthermore,
the study on the effect of GnRH agonist and antagonist on
GnRH-R association shows that the Bv-FRET assay has
the potential to be further developed and used for
investigating the molecular mechanism involved in pro-
tein–protein interaction and for screening novel molecules
that might enhance or block the protein–protein inter-
actions of molecules of interest.
In summary, the Bv-FRET assay represents a powerful
method for studying protein–protein interactions. This
assay can reveal the interaction between GnRH-R mole-
cules and the effect of GnRH analogues on this association.
It is a convenient, reliable, accurate and sensitive method of
visualization of FRET and assessment of protein–protein
interactions. It can potentially allow for studying the
associations of molecules of any proteins of interest.
Acknowledgements
We acknowledge Dr Daryl Webb for his excellent technical assistance
with confocal microscopy; Professor Hiroto Naora, Professor Richard
Mark and Dr Lauren Marotte for their careful proof reading and
comments on the manuscript and Kristin Cheung for the graphic
illustrations in this paper.
References
1. Hubbard, S.R. (1999) Structural analysis of receptor tyrosine
kinases. Prog. Biophys. Mol Biol. 71, 343–358.
2. Schlessinger, J. (2000) Cell signaling by receptor tyrosine kinases.
Cell 103, 211–225.
3. Androlewicz, M.J., Browning, J.L. & Ware, C.F. (1992) Lym-
photoxin is expressed as a heteromeric complex with a distinct
33-kDa glycoprotein on the surface of an activated human T cell
hybridoma. J. Biol. Chem. 267, 2542–2547.
4. Browning, J.L., Androlewicz, M.J. & Ware, C.F. (1991) Lym-
photoxin and an associated 33-kDa glycoprotein are expressed on
the surface of an activated human T cell hybridoma. J. Immunol.
147, 1230–1237.
5. Browning, J.L., Ngam-ek, A., Lawton, P., DeMarinis, J., Tizard,
R., Chow, E.P., Hession, C., O’Brine-Greco, B., Foley, S.F. &
Ware, C.F. (1993) Lymphotoxin beta, a novel member of the TNF
family that forms a heteromeric complex with lymphotoxin on the
cell surface. Cell 72, 847–856.
6. Ware, C.F., Crowe, P.D., Grayson, M.H., Androlewicz, M.J. &
Browning, J.L. (1992) Expression of surface lymphotoxin and
tumor necrosis factor on activated T, B, and natural killer cells.
J. Immunol. 149, 3881–3888.
7. Bardsley, B., Cho, Y.R., Westwell, M.S. & Williams, D.H. (1998)
Induction of asymmetry into homodimers. Chirality 10, 14–23.
8. Frank, S.J. (2002) Receptor dimerization in GH and erythro-
poietin action – it takes two to tango, but how? Endocrinology 143,
2–10.
9. Waters, M.J., Shang, C.A., Behncken, S.N., Tam, S.P., Li, H.,
Shen, B. & Lobie, P.E. (1999) Growth hormone as a cytokine.
Clin. Exp. Pharmacol Physiol. 26, 760–764.
10. Wells, J.A. (1996) Binding in the growth hormone receptor com-
plex. Proc. Natl Acad. Sci. USA 93,1–6.
11. Angers, S., Salahpour, A. & Bouvier, M. (2002) Dimerization: an
emerging concept for G protein-coupled receptor ontogeny and
function. Annu. Rev. Pharmacol. Toxicol. 42, 409–435.
12. Cheng, Z.J. & Miller, L.J. (2001) Agonist-dependent dissociation
of oligomeric complexes of G protein-coupled cholecystokinin
receptors demonstrated in living cells using bioluminescence
resonance energy transfer. J. Biol. Chem. 276, 48040–48047.
13. Jordan, B.A., Trapaidze, N., Gomes, I., Nivarthi, R. & Devi, L.A.
(2001) Oligomerization of opioid receptors with beta 2-adrenergic
receptors: a role in trafficking and mitogen-activated protein
kinase activation. Proc. Natl Acad. Sci. USA 98, 343–348.
4980 T. C. Cheung and J. P. Hearn (Eur. J. Biochem. 270) Ó FEBS 2003
14. Rocheville, M., Lange, D.C., Kumar, U., Sasi, R., Patel, R.C. &
Patel, Y.C. (2000) Subtypes of the somatostatin receptor assemble
as functional homo- and heterodimers. J. Biol. Chem. 275, 7862–
7869.
15. Lundin, K., Blomberg, K., Nordstrom, T. & Lindqvist, C. (2001)
Development of a time-resolved fluorescence resonance energy
transfer assay (cell TR-FRET) for protein detection on intact cells.
Anal. Biochem. 299, 92–97.
16. Periasamy, A. & Day, R.N. (1999) Visualizing protein interactions
in living cells using digitized GFP imaging and FRET microscopy.
Methods Cell Biol. 58, 293–314.
17. Pollok, B.A. & Heim, R. (1999) Using GFP in FRET-based
applications. Trends Cell Biol. 9, 57–60.
18. Ruiz-Velasco, V. & Ikeda, S.R. (2001) Functional expression and
FRET analysis of green fluorescent proteins fused to G-protein
subunits in rat sympathetic neurons. J. Physiol. 537, 679–692.
19. Truong, K. & Ikura, M. (2001) The use of FRET imaging
microscopy to detect protein–protein interactions and protein
conformational changes in vivo. Curr. Opin. Struct. Biol. 11,573–
578.
20. van Thor, J.J. & Hellingwerf, K.J. (2002) Fluorescence resonance
energy transfer (FRET) applications using green fluorescent
protein. Energy transfer to the endogenous chromophores of
phycobilisome light-harvesting complexes. Methods Mol. Biol.
183, 101–119.
21. Clegg, R.M. (1995) Fluorescence resonance energy transfer. Curr.
Opin. Biotechnol. 6, 103–110.
22. Clegg, R.M. (2002) FRET tells us about proximities, distances,
orientations and dynamic properties. J. Biotechnol. 82, 177–179.
23. Hillisch, A., Lorenz, M. & Diekmann, S. (2001) Recent advances
in FRET: distance determination in protein-DNA complexes.
Curr. Opin. Struct. Biol. 11, 201–207.
24. Selvin, P.R. (1995) Fluorescence resonance energy transfer.
Methods Enzymol. 246, 300–334.
25. Wu, P. & Brand, L. (1994) Resonance energy transfer: methods
and applications. Anal. Biochem. 218, 1–13.
26. Carr, P.D., Gustin, S.E., Church, A.P., Murphy, J.M., Ford, S.C.,
Mann, D.A., Woltring, D.M., Walker, I., Ollis, D.L. & Young,
I.G. (2001) Structure of the complete extracellular domain of the
common beta subunit of the human GM-CSF, IL-3, and IL-5
receptors reveals a novel dimer configuration. Cell 104, 291–300.
27. Gustin, S.E., Church, A.P., Ford, S.C., Mann, D.A., Carr, P.D.,
Ollis, D.L. & Young, I.G. (2001) Expression, crystallization and
derivatization of the complete extracellular domain of the beta (c)
subunit of the human IL-5, IL-3 and GM-CSF receptors. Eur. J.
Biochem. 268, 2905–2911.
28. Ingley, E., Cutler, R.L., Fung, M.C., Sanderson, C.J. & Young,
I.G. (1991) Production and purification of recombinant human
interleukin-5 from yeast and baculovirus expression systems. Eur.
J. Biochem. 196, 623–629.
29. Marheineke, K., Lenhard, T., Haase, W., Beckers, T., Michel, H.
& Reilander, H. (1998) Characterization of the human gonado-
tropin-releasing hormone receptor heterologously produced using
the baculovirus/insect cell and the Semliki Forest virus systems.
Cell. Mol. Neurobiol. 18, 509–524.
30. Neill, J.D., Sellers, J.C., Musgrove, L.C. & Duck, L.W. (1997)
Epitope-tagged gonadotropin-releasing hormone receptors het-
erologously-expressed in mammalian (COS-1) and insect (Sf9)
cells. Mol. Cell. Endocrinol. 127, 143–154.
31. Rooney, I., Butrovich, K. & Ware, C.F. (2000) Expression of
lymphotoxins and their receptor-Fc fusion proteins by baculo-
virus. Methods Enzymol. 322, 345–363.
32. Williams-Abbott, L., Walter, B.N., Cheung, T.C., Goh, C.R.,
Porter, A.G. & Ware, C.F. (1997) The lymphotoxin-alpha
(LTalpha) subunit is essential for the assembly, but not for the
receptor specificity, of the membrane-anchored LTalpha1beta2
heterotrimeric ligand. J. Biol. Chem. 272, 19451–19456.
33. Busconi, L. & Michel, T. (1995) Recombinant endothelial nitric
oxide synthase: post-translational modifications in a baculovirus
expression system. Mol. Pharmacol. 47, 655–659.
34. Farazi, T.A., Waksman, G. & Gordon, J.I. (2001) The biology
and enzymology of protein N-myristoylation. J. Biol. Chem. 276,
39501–39504.
35. Bockaert, J. & Pin, J.P. (1999) Molecular tinkering of G protein-
coupled receptors: an evolutionary success. EMBO J. 18, 1723–
1729.
36. Baldwin, J.M. (1993) The probable arrangement of the helices in
G protein-coupled receptors. EMBO J. 12, 1693–1703.
37. Cornea,A.,Janovick,J.A.,Maya-Nunez,G.&Conn,P.M.(2001)
Gonadotropin-releasing hormone receptor microaggregation.
Rate monitored by fluorescence resonance energy transfer. J. Biol.
Chem. 276, 2153–2158.
38. Kroeger, K.M., Hanyaloglu, A.C., Seeber, R.M., Miles, L.E. &
Eidne, K.A. (2001) Constitutive and agonist-dependent homo-
oligomerization of the thyrotropin-releasing hormone receptor.
Detection in living cells using bioluminescence resonance energy
transfer. J. Biol. Chem. 276, 12736–12743.
39. Chapco, W. (1976) An exact test of the Hardy–Weinberg law.
Biometrics 32, 183–189.
40. Stark, A.E. (1976) Generalisation of the Hardy–Weinberg law.
Nature 259,44.
41. Ciccaglione, A.R., Marcantonio, C., Costantino, A., Equestre, M.
& Rapicetta, M. (2003) Expression of HCV E1 protein in bacu-
lovirus-infected cells: effects on cell viability and apoptosis
induction. Intervirology 46, 121–126.
Ó FEBS 2003 Baculovirus-based FRET assay (Eur. J. Biochem. 270) 4981