Báo cáo khoa học: Analysis of the contribution of changes in mRNA stability to the changes in steady-state levels of cyclin mRNA in the mammalian cell cycle doc
Bạn đang xem bản rút gọn của tài liệu. Xem và tải ngay bản đầy đủ của tài liệu tại đây (680.32 KB, 13 trang )
Analysis of the contribution of changes in mRNA stability
to the changes in steady-state levels of cyclin mRNA in the
mammalian cell cycle
Anna Penelova
1
, Larry Richman
1
, Barbara Neupert
1
, Viesturs Simanis
2
and Lukas C. Ku
¨
hn
1
1 Genetics Unit, Swiss Institute for Experimental Cancer Research (ISREC), Epalinges, Switzerland
2 Cell Cycle Control Laboratory, Swiss Institute for Experimental Cancer Research (ISREC), Epalinges, Switzerland
Introduction
Cyclin-dependent kinases (cdks) are central to the pro-
gression and control of the mammalian cell cycle [1–3].
Their activity is regulated positively by interaction with
cyclins and negatively by cdk-inhibitors that bind to
cdk-cyclin complexes. Cyclin-dependent kinases are
also regulated by phosphorylation. The protein levels
of cdk activators and inhibitors are tightly controlled
by the rate of their synthesis and by specific phos-
phorylation events that initiate ubiquitination and
degradation by proteasomes, thus limiting expression
to a specific cell cycle phase. D-type cyclins (D1, D2
and D3) are highest in early G
1
phase, when they acti-
vate cdk4 and cdk6. E-type cyclins (E1 and E2) peak
in late G
1
and associate with cdk2 to complete G
1
and
initiate S phase. Cyclin A2 accumulates during S phase
with highest levels in late S and G
2
. It associates with
cdk2 during S phase and subsequently with cdk1
(cdc2) to pass the S ⁄ G
2
boundary. Finally, progression
through G
2
and mitosis require cyclins B1 and B2 that
associate with cdk1.
Because the expression of cyclins plays a large part
in controlling cell cycle progression, it is important to
understand the transcriptional and post-transcriptional
mechanisms that influence cyclin levels. Indeed, recent
microarray data demonstrate significant variations of
cyclin mRNA levels in human fibroblasts after release
from serum starvation (G
0
phase) [4] or a double
thymidine block (late G
1
phase) [5]. Transcription of
Keywords
cell cycle; cyclin; elutriation; fluorescence
activated cell sorter; mRNA stability
Correspondence
L. C. Ku
¨
hn, Swiss Institute for Experimental
Cancer Research, Genetics Unit, Chemin
des Boveresses 155, CH-1066 Epalinges,
Switzerland
Fax: +4121 652 69 33
Tel: +4121 692 58 36
E-mail:
(Received 29 June 2005, accepted 16
August 2005)
doi:10.1111/j.1742-4658.2005.04918.x
Cyclins are the essential regulatory subunits of cyclin-dependent protein
kinases. They accumulate and disappear periodically at specific phases of
the cell cycle. Here we investigated whether variations in cyclin mRNA
levels in exponentially growing cells can be attributed to changes in mRNA
stability. Mouse EL4 lymphoma cells and 3T3 fibroblasts were synchron-
ized by elutriation or cell sorting. Steady-state levels and degradation of
cyclin mRNAs and some other cell cycle related mRNAs were measured at
early G
1
, late G
1
, S and G
2
⁄ M phases. In both cell lines mRNAs of cyclins
C, D1 and D3 remained unchanged throughout the cell cycle. In contrast,
cyclin A2 and B1 mRNAs accumulated 3.1- and 5.7-fold between early G
1
and G
2
⁄ M phase, whereas cyclin E1 mRNA decreased 1.7-fold. Mouse
cyclin A2 and B1 genes, by alternative polyadenylation, gave rise to more
than one transcript. In both cases, the longer transcripts were the minor
species but accumulated more strongly in G
2
⁄ M phase. All mRNAs were
rather stable with half-lives of 1.5–2 h for cyclin E1 mRNA and 3–4 h for
the others. Changes in mRNA stability accounted for the accumulation in
G
2
⁄ M phase of the short cyclin A2 and B1 mRNAs, but contributed only
partially to changes in levels of the other mRNAs.
Abbreviations
cdk, cyclin dependent kinase; DMEM, Dulbecco’s modified Eagle medium; DRB, 5,6-dichloro-1-b-
D-ribofuranosylbenzimidazole; FACS,
fluorescence activated cell sorter; FBS, fetal bovine serum; GAPDH, glyceraldehyde-3-phosphate dehydrogenase; UTR, untranslated region.
FEBS Journal 272 (2005) 5217–5229 ª 2005 FEBS 5217
D-type cyclin mRNA is certainly induced by mitogenic
signals that trigger G
0
⁄ G
1
transition [6], whereas tran-
scription of cyclin E1 starts in late G
1
[7]. Likewise,
A- and B-type cyclin mRNA were reported to be
induced in S and G
2
⁄ M phase as a consequence of
events in G
1
phase [4,8–10]. In addition, several studies
concluded that cyclin, cdk and cdk-inhibitor mRNA
stability can vary throughout the cell cycle [11–15]. Cer-
tain transacting proteins such as HuR were proposed
as regulators of changes in mRNA stability during the
cell cycle [15]. In this context it is of interest that during
vertebrate evolution many of the cyclin mRNAs show
a rather high phylogenetic conservation of their 3¢ un-
translated regions (3¢UTR) suggesting that specific ele-
ments in the 3¢UTR might contribute to control RNA
half-life [16]. On the other hand a recent study with
human MOLT-4 cells showed no change in cyclin
mRNA half-lives throughout the cell cycle [17].
While most studies on cyclin mRNA stability in the
cell cycle have been carried out with human cells,
essential regulatory steps are likely to be conserved in
evolution and thus amenable to genetic analysis in the
mouse. We therefore examined mRNA expression and
stability in synchronized mouse lymphoma EL4 cells
and 3T3 fibroblasts. We analyzed the mRNA steady-
state level and half-life of mouse cyclins and a selection
of other cell cycle related genes for which important
cell cycle-related changes were reported in microarray
studies [4,5]. We show that mRNAs for cks2, cyclin
A2, B1 and E1 vary in the cell cycle but that mRNA
half-life changes contribute only partially to these vari-
ations.
Results
Steady-state levels of cyclin mRNA in the cell
cycle
In a first series of experiments we determined whether
mRNA steady-state levels of cyclins and several cell
cycle-related mRNAs change at different positions in
the cell cycle. To achieve this, about 5 · 10
8
logarith-
mically dividing mouse EL4 lymphoma cells were sep-
arated by elutriation into 12–15 fractions. EL4 cells
are particularly well suited for this separation method
as they are not adherent and grow to high density. An
aliquot of each fraction was analysed on a fluorescence
activated cell sorter (FACS) for the profile of DNA
content after propidium iodide staining. Pooled frac-
tions of cells highly enriched in early G
1
, late G
1
,S
and G
2
⁄ M phase were selected for further analysis
(Fig. 1A). Steady-state mRNA levels were analysed by
real-time PCR. By taking the early G
1
cells as a refer-
ence, mRNA levels of cyclins C, D1 and D3, as well
as c-myc, RanGTPase and RanBP1 were unchanged
(Fig. 1B). Cyclin D2 was not expressed in EL4 cells.
Cyclin E1 mRNA increased slightly in late G
1
and
then diminished about 2-fold in G
2
⁄ M phase. The
clearest induction in G
2
⁄ M compared to early G
1
cells
was observed for cyclin A2 mRNA (3.1-fold) and
cyclin B1 mRNA (5.7-fold). Cks2 mRNA was three-
fold higher in S phase and 2.4-fold higher in G
2
⁄ M
and very similarly the control histone H4 mRNA
showed a threefold increase in S phase. Thus, changes
in mRNA occur parallel to changes in protein expres-
sion [18,19], but cannot account for strong differences
of cyclin protein levels that are modulated post-trans-
lationally [20,21]. Overall we observed smaller differ-
ences in RNA steady-state levels than those reported
by others for human cells [11,12,15].
The relatively small changes in mRNA levels made
us wonder whether there was any problem with the
separation procedure. To verify this, we separated EL4
cells in logarithmic growth by the FACS according to
cellular DNA content revealed by Hoechst 33342
(Fig. 1C). This method gave highly enriched cell popu-
lations with sufficient amount of mRNA for real-time
PCR measurements, but could not distinguish early
and late G
1
cells. The results were qualitatively very
similar to the measurements obtained with elutriated
cells, although somewhat less pronounced because we
took the average G
1
cells as a reference. We found
again that mRNA levels for cyclins C, D1 and D3 as
well as for c-myc, RanGTPase and RanBP1 showed
no changes in the cell cycle (Fig. 1D). Cyclin E1
mRNA decreased from G
1
to G
2
⁄ M by a factor of
1.7-fold, whereas the mRNA of cyclin A2, cyclin B1
and cks2 increased 1.9-, 3.2- and 2.4-fold, respectively.
We found similar results with mouse 3T3 cells that
were either sorted by the FACS or synchronized by a
double thymidine block. They showed no change in
steady-state levels for most mRNAs, with the excep-
tion of a two- to 2.5-fold increase between G
1
and
G
2
⁄ M for mRNAs of cks2, cyclins A2 and B1 (data
not shown).
Next we wanted to be sure that cells were fully
viable after elutriation. To test this, elutriated cell frac-
tions were brought back into cell culture for 2–8 h, at
which time their DNA content was analysed by the
FACScan (Fig. 2). EL4 cells advanced synchronously
in the cell cycle without significant delay (Fig. 2). The
first fractions of cells harvested in the elutriation pro-
tocol behaved like early G
1
cells. They enter S phase
only after about 4 h of culturing, whereas later frac-
tions comprise G
1
cells that resumed S phase almost
immediately and that we considered therefore as late
Cell cycle regulation of mouse cyclin mRNAs A. Penelova et al.
5218 FEBS Journal 272 (2005) 5217–5229 ª 2005 FEBS
G
1
cells. The FACS profiles allowed us to estimate the
total cycle to about 13 h of which about 6 h corres-
pond to G
1
phase, about 3.5 h to S phase and another
3.5 h to G
2
phase and mitosis. This correlated well
with the estimated doubling time of EL4 cells in log-
arithmic growth.
No major variation in the mRNA half-life of cyclin
mRNAs in the cell cycle
In order to test whether changes in mRNA steady-
state levels correlate with any changes in mRNA sta-
bility, we carried out half-life measurements on the
different elutriated cell fractions. Transcription was
inhibited with 5,6-dichloro-1-b-d-ribofuranosylbenzimi-
dazole (DRB) and mRNA measured at 0, 30, 60, 120
and 180 min by real-time PCR (Fig. 3). Half-life
measurements showed no strong differences in mRNA
degradation rates in the different cell cycle phases.
Only mRNA of cyclins A2 and B1 showed at most a
1.6-fold higher stability in S and G
2
⁄ M phases. As a
positive control, we found as expected a rapid degra-
dation with a half-life of less than 1 h for the unstable
c-myc mRNA, indicating that the transcription block
by DRB was effective. Similar data were also obtained
with actinomycin D or with EL4 cells enriched in spe-
cific cell cycle phases by the FACS (data not shown).
Northern blot analysis of mRNA from fractions
of elutriated EL4 cells
We needed to confirm the real-time PCR data by nor-
thern blots of RNA from elutriated cells. The cell cycle
distribution of the cell fractions is shown in Fig. 4.
AB
CD
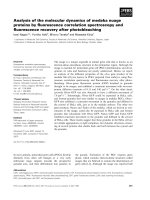
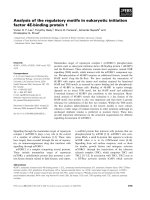
Fig. 1. Steady-state levels of cyclin mRNAs in enriched cell cycle fractions of mouse EL4 cells. Cells were separated either by elutriation or
by cell sorting into G
1
,SandG
2
⁄ M phase fractions. (A) Cells were separated by elutriation into about 15 fractions. The DNA content was
measured after Hoechst staining by the FACS. Representative fractions showed a strong enrichment for cells in early G
1
(a), late G
1
(b),
S (c) or G
2
⁄ M phase (d). (B) The mRNA content of these fractions was quantified by real-time PCR and normalized to mARP0 mRNA. Values
in early G
1
cells were set as 1. Results are the average of at least four experiments ± SD. (C) Typical FACS profile of the DNA content of
logarithmically growing EL4 cells stained by Hoechst 33342. Cells were separated by FACS sorting into three fractions as indicated. (D) In
each fraction, mRNAs were quantified by real-time PCR. Values are normalized to mARP0 mRNA. The amount of each mRNA in G
1
phase
cells is set as 1. Results are the average of two experiments.
A. Penelova et al. Cell cycle regulation of mouse cyclin mRNAs
FEBS Journal 272 (2005) 5217–5229 ª 2005 FEBS 5219
Northern blot hybridizations were carried out for
genes that had shown differences of steady-state levels
in the cell cycle (cyclin A2, B1 and E1). The invariant
mRNAs of cyclin D3 and glyceraldehyde-3-phosphate
dehydrogenase (GAPDH) were analysed as controls
(Fig. 4A). These blots revealed that there is more than
one transcript from mouse cyclin A2 and B1 genes. In
the case of mouse cyclin A2, besides the more abun-
dant mRNA of 1.8 kb, there is a minor species of
3.0 kb. For mouse cyclin B1 we see in addition to the
most abundant 1.7 kb mRNA, a 2.5 kb mRNA and a
very minor 2.1 kb mRNA. Based on EST database
searches taking into account all 5¢ and 3¢ ends of iden-
tified cDNAs, we concluded that these mRNA hetero-
geneities arise from alternative polyadenylation. This
was confirmed by control hybridizations with 3¢UTR
probes downstream of the first polyadenylation site
that consistently revealed only the longer transcripts
(Fig. 5). Longer transcripts of cyclins A2 and B1 were
also visible in mouse 3T3 cells and in mouse thymus
and spleen, but were less clearly detectable in tissues
with fewer proliferating cells (data not shown). In tes-
tes two cyclin A2 transcripts and only the shorter
cyclin B1 transcript were visible, in agreement with
previous reports [22,23]. The hybridizations with a
coding region probe, after normalization to GAPDH
expression, showed that the 1.8 kb cyclin A2 mRNA
accumulated about 1.8-fold in S and G
2
⁄ M phase com-
pared to early G
1
phase, while the 1.7 kb cyclin B1
mRNA increased at most threefold (Fig. 4B). More
strikingly, the longer mRNA variants of both cyclins
accumulated much more than the short ones and
reached 35–45% of the total amount in late S and
G
2
⁄ M cells. The 2.5 kb mRNA of cyclin B1 showed
reproducibly a strong, up to 10-fold increase, while the
magnitude of the 3.0 kb cyclin A2 mRNA increase
Fig. 2. Cell cultures of mouse EL4 cell fractions after elutriation. Immediately after elutriation selected cell fractions enriched in a given cell
cycle phase (as indicated) were put back into culture for 2, 4, 6 or 8 h. The cell cycle progression was analysed by FACS profiles of the DNA
content of propidium iodide stained aliquots of cells.
Cell cycle regulation of mouse cyclin mRNAs A. Penelova et al.
5220 FEBS Journal 272 (2005) 5217–5229 ª 2005 FEBS
showed some variation between experiments (Fig. 4
and Fig. 6A). The reason for this is unclear. At the
same time cyclin E1 declined 2.2-fold.
Based on northern blot analysis, as already deter-
mined by real-time PCR, changes in steady-state levels
were not associated with strong modifications in the
mRNA half-life in different cell cycle phases (Fig. 6B).
Half-lives were about 2 h for cyclin E1 mRNA and 3–
4.5 h for the other transcripts in most cell cycle phases.
These values are close to those obtained by real-time
PCR. Only in the case of the short cyclin A2 and B1
mRNAs were the half-lives significantly prolonged in
G
2
⁄ M phase. This change fully accounts for the accu-
mulation of these transcripts in G
2
⁄ M phase. For the
long cyclin A2 and B1 mRNAs we found also a minor
stability change that cannot account for their strong
accumulation in G
2
⁄ M phase.
Given the clear accumulation of cyclin A2 and B1
mRNAs in G
2
⁄ M compared to early G
1
and the
reports on human cells that demonstrated a strong dif-
ference in mRNA stability in these phases [11,12,15], it
seemed important to verify carefully mRNA half-lives
at the transition between G
2
⁄ M and early G
1
phase.
For this, EL4 cells were arrested in mitosis by noco-
dazole and then released for 0, 30, 60, 90, 120 or
180 min. At least 75% of the arrested cells completed
mitosis and divided within 3 h (Fig. 7A). mRNA half-
lives were measured at each time-point (Fig. 7B). The
results indicated no significant changes in mRNA half-
life for most transcripts except the long transcript of
cyclin B1 which appeared to decay quite rapidly at the
time of the release. Notably with the nocodazole arres-
ted cells we did not find the prolonged half-life seen
before for cyclin A2 and B1 mRNAs in enriched
G
2
⁄ M fractions. Based on these data it seems unlikely
that changes in steady-state levels can be attributed to
transient changes in half-life.
Discussion
The purpose of the present study was to analyse the
contribution of post-transcriptional mechanisms in the
cell cycle regulation of cyclin mRNAs. Previous studies
on HeLa cells [11,12] and colorectal carcinoma RKO
cells [15] had found strong mRNA stability changes.
We reasoned that such a feature, if it was physiologi-
cally important, should be conserved between human
and mouse. We therefore analysed the steady-state lev-
els and mRNA stability at different points in the cell
cycle of mouse 3T3 and EL4 cell lines. The general
conclusion of our analysis is that, in contrast to these
earlier studies, but in agreement with a recent publica-
tion on human MOLT 4 cells [17], most cyclin
A
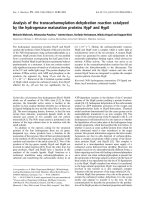
B
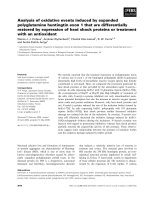
Fig. 3. Half-life of cyclin mRNAs in EL4 cell fractions enriched by
elutriation. Cell fractions were put back into cell culture for about
30 min and incubated for 0, 30, 60, 120 or 180 min with DRB prior
to the isolation of total mRNA. Remaining mRNA was measured by
real-time PCR and normalized to mARP0 mRNA. The short-lived
c-myc mRNA served as a control. (A) The mRNA half-life was calcu-
lated from linear regression on semi-logarithmic plots. Results are
the average of three to four experiments ± SD. (B) Alternatively,
data of decay of mRNAs showing the strongest changes in steady-
state levels (Fig. 1) were plotted on a semi-logarithmic scale and a
single regression line calculated. The intercept of the regression
line at log
10
of 50% ¼ 1.699, corresponds to the half-life. The lower
and upper 95% confidence limits were at 0.75 and 1.5 times the
half-life.
A. Penelova et al. Cell cycle regulation of mouse cyclin mRNAs
FEBS Journal 272 (2005) 5217–5229 ª 2005 FEBS 5221
mRNAs show relatively small changes in steady-state
levels and their degradation rates do not vary more
than twofold during the cell cycle.
The moderate regulation cannot be attributed to a
lack of cell synchronization or cell viability (Fig. 2).
Two independent methods, elutriation and cell sorting
gave excellent separation between G
1
, S and G
2
⁄ M
cells and indicate overall very similar changes in
mRNA steady-state levels (Fig. 1). We found similar
results for mouse EL4 lymphoma cells and 3T3 cells
derived from different tissue types, suggesting that
EL4 cells in spite of being tumour-derived with an
exceptionally rapid cell cycle show the same basic fea-
tures in terms of cyclin mRNA regulation as immortal-
ized 3T3 fibroblasts.
Several transcripts did not vary throughout the cell
cycle. This was the case for mRNAs of cyclins C, D1
and D3 which had a constant half-life at all stages of
the cell cycle of about 4 h, as well as c-myc, RanBP1
and RanGTPase mRNAs. This is consistent with
A
B
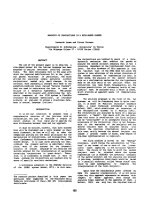
Fig. 4. Northern blot analysis of cyclin mRNAs in all fractions of a
typical elutriation experiment. (A) The content of G
1
,SandG
2
⁄ M
cells (in percentage on top panel) was determined for 12 consecu-
tive fractions by propidium iodide staining and FACS. mRNA of cyc-
lins A2, B1, E1 and D3 along with the control GAPDH mRNA were
quantified by northern blot hybridization with probes of the coding
regions. Numbers on the right indicate sizes of transcripts. (B)
Cyclin mRNA expression in different fractions was normalized to
GAPDH mRNA and is reported relative to the first cell fraction (arbi-
trarily set as 1).
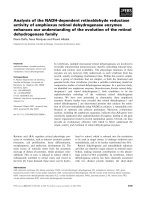
Fig. 5. Alternative polyadenylation in mouse cyclin A2 and B1
mRNA. mRNA of nonsynchronized EL4 cells was isolated at differ-
ent times indicated after transcription inhibition by DRB and
analysed by northern blot hybridization. The blot shown was
sequentially hybridized with probes of the cyclin A2 coding region,
cyclin B1 coding region, cyclin A2 3¢UTR, cyclin B1 3¢UTR and
finally the GAPDH coding region probe. The experiment shown is
representative for three experiments with similar results.
Cell cycle regulation of mouse cyclin mRNAs A. Penelova et al.
5222 FEBS Journal 272 (2005) 5217–5229 ª 2005 FEBS
previous studies [24,25]. cks2 mRNA showed an
increase in late S and G
2
⁄ M phase confirming previous
observations [26,27], but no cell cycle-dependent
change in stability. The cyclin E1 mRNA was
increased in the G
1
phase of the cell cycle, but this was
not accompanied by changes in mRNA half-life. This
result is similar to the one reported by others who
released cells from serum starvation [12] or synchron-
ized them by harvesting freshly divided cells [17]. We
saw a reproducible increase for mRNAs of cyclins A2
and B1 as cells moved from G
1
to G
2
⁄ M phase (Figs 1
and 4). However, northern blot hybridizations revealed
a more complex situation than in human cells, with
alternative transcripts produced by differences in
polyadenylation sites (Figs 4 and 5). The 1.8-kb tran-
script of cyclin A2 that corresponds to 60–90% of the
total cyclin A2 mRNA increased only about twofold,
whereas the 3.0 kb cyclin A2 mRNA was 2.5- to 7-fold
more expressed in G
2
⁄ M (Figs 4 and 6). This was
accompanied by about a twofold increased half-life in
G
2
⁄ M phase for both mRNAs (Fig. 6B). Similarly, the
1.7-kb cyclin B1 mRNA showed only a two- to three-
fold accumulation in G
2
⁄ M, whereas the 2.5-kb cyclin
B1 mRNA was increased about 10-fold in G
2
⁄ M
(Figs 4 and 6). The two mRNAs decayed with a half-
life that was similar and at most twofold prolonged in
A
B
C
Fig. 6. Half-life measurements of cyclin mRNAs by northern blot hybridizations. (A) Cell fractions of elutriated EL4 cells (see cell cycle distri-
bution on top) were incubated in the presence of the transcription inhibitor DRB for various lengths of time. Total mRNA was isolated and
analysed by northern blot hybridization. (B) The signal intensity was quantified by a phosphorimager and normalized to GAPDH mRNA. The
half-life of each mRNA in different cycle phases is reported. Results are the average of two independent experiments (for cyclin A2 meas-
ured each twice) ± SD. (C) Alternatively, results of long and short cyclin A2 and B1 mRNAs were plotted on semi-logarithmic graphs and a
single regression line calculated. The intercept of the regression line at log
10
of 50% ¼ 1.699, corresponds to the half-life. The lower and
upper 95% confidence limits were at 0.75 and 1.5 times the half-life.
A. Penelova et al. Cell cycle regulation of mouse cyclin mRNAs
FEBS Journal 272 (2005) 5217–5229 ª 2005 FEBS 5223
G
2
⁄ M phase. We conclude that the changes in mRNA
half-life may explain almost fully the accumulation of
the short A2 and B1 transcripts as well as partially the
3.0-kb A2 transcript. In contrast, the greater increase
of the 2.5-kb cyclin B1 transcript cannot be explained
by half-life changes. It is possible that the majority of
the regulation of these transcripts may reside in the
choice of polyadenylation site.
The lack of changes in mRNA stability for mRNAs,
which have quite long half-lives, raises the question of
how their levels decrease at the end of M-phase. We
have to assume a prolonged period of transcription
inhibition to explain the decay of an mRNA that fluc-
tuates 10-fold in the cycle. At present it is unclear
what triggers the decrease in the level of the 2.5-kb
cyclin B1 mRNA at the M⁄ G
1
transition. Mitotic
arrest and release experiments showed no systematic
acceleration in mRNA degradation near mitosis or
shortly after (Fig. 7). We found similar results with re-
cultured cells after elutriation (data not shown).
The relatively modest twofold changes for the half-
lives of mouse cyclin A2 and B1 mRNAs observed
here contrast with the large changes observed in earlier
analyses on human HeLa and colorectal carcinoma
RKO cells [11,12,15]. When HeLa cells were synchron-
ized after release from a thymidine ⁄ amphidicolin
block, the half-life of cyclin B1 mRNA measured after
actinomycin D addition increased from 1.2 h in early
G
1
to 12 h in G
2
⁄ M phase [11]. With the same method
the cyclin A mRNA half-life was reported to change
from 1.6 h in early G
1
to 12 h in late G
1
and 8 h in S
and G
2
⁄ M phase [12]. Similarly, cyclin A and B1
mRNA half-lives increased in RKO cells from about
2.5 h in G
1
to 18 h in S phase after release from serum
A
B
C
Fig. 7. Analysis of mRNA half-lives at the
transition between M and G
1
phase. Cells
were blocked with nocodazole in mitosis
and released for 0, 30, 60, 90, 120 and
180 min (A) The cell cycle distribution of
each cell population was determined by
flow cytometry. (B) At different times of
release cells were incubated with DRB and
mRNA decay was determined by northern
blot hybridization. (C) The mRNA half-life is
reported for the various mRNAs at different
time-points of the nocodazole release. The
results are the average of three experi-
ments ± SD.
Cell cycle regulation of mouse cyclin mRNAs A. Penelova et al.
5224 FEBS Journal 272 (2005) 5217–5229 ª 2005 FEBS
starvation [15]. However, no full return to the initial
rapid mRNA degradation rates in G
1
was observed
when cells were cultured for a full cell cycle [15]. The
overall conclusion from our study of no major changes
in cyclin mRNA degradation throughout the cell cycle
is consistent with a recent report on cyclin mRNA
half-lives in human MOLT-4 cells [17]. Introducing a
novel synchronization procedure of gently harvesting
freshly divided cells, which should be unperturbed in
their logarithmic growth, the authors reported that
cyclin A2 and B1 mRNA accumulated about 8-fold in
G
2
⁄ M compared to early G
1
phase, whereas mRNA
half-lives fluctuated between 1.5 and 2.5 h [17]. In this
study the small variations of stability did not account
for the relatively strong fluctuations of cyclin A2 and
B1 mRNA, while here we propose that 2-fold changes
in mRNA levels for the major, short cyclin A2 and B1
mRNAs can be accounted for by stability changes.
The discrepancies between the different studies may
be due to differences in cell lines or the techniques
used to synchronize them. It is noteworthy that both
EL4 and MOLT-4 cells are derived from T-cell
lymphomas, whereas HeLa and RKO cells are epithe-
lial carcinomas, and 3T3 cells are of fibroblast origin.
As is has been proposed that cyclin mRNA stabiliza-
tion depends on specific mRNA-binding proteins
interacting with AU-rich regions, notably HuR [15], it
is conceivable that different cell lines express these
proteins differently. Alternatively, HuR might be
induced only under certain conditions of stimulation
after a cell growth arrest, but not in the case of separ-
ation of cells during logarithmic growth. Concerning
the techniques alone we found for EL4 cells, that
elutriation was less perturbing than other methods,
including release after double thymidine block or
nocodazole arrest where usually a large fraction of
cells (sometimes up to 30%) were unable to resume
growth. It was reassuring that cell sorting gave results
similar to elutriation, as transcription inhibitor is
added to unperturbed logarithmically growing cells
and RNA isolated immediately after sorting elimin-
ating artefacts of cell culture.
The similarity of our conclusions concerning mRNA
half-life to those reached by others with MOLT-4 cells
[17] seems to exclude fundamental differences in cyclin
mRNA decay between species. However, there are dif-
ferences in the relative accumulation of cyclin A2 and
B1 mRNA, and the detection of multiple mRNA
species in the mouse was a surprise given previous
observations in human cells. Others have reported het-
erogeneity of A2 and B1 transcripts in rodent species
[28,29]. Human cyclin A mRNA shows mainly one
band [19] corresponding to the 2.7-kb mRNA in the
mouse, and human cyclin B1 mRNA is also a single
species [18] corresponding to the 1.7-kb transcript in
the mouse. We show that mouse transcripts differ only
in their 3¢UTR, but not the coding regions. Therefore,
the significance of 3¢UTR differences is unclear. They
may perhaps play a role in localizing the mRNA or
regulate its translation. Future studies will address
this.
In conclusion, our study shows that post-transcrip-
tional regulation contributes 2-fold to the short ver-
sions of cyclin A2 and B1 mRNA, whereas minor
fluctuations of mRNA levels in the other genes are
possibly transcriptionally controlled. The cyclic accu-
mulation of the longer mouse cyclin A2 and B1
mRNAs may result from a combination of changes in
alternative polyadenylation, transcription and minor
mRNA stabilization in G
2
⁄ M phase.
Experimental procedures
Cell culture
Mouse 3T3 fibroblasts kindly provided by A. Trumpp
(ISREC, Switzerland) were grown in Dulbecco’s modified
Eagle medium (DMEM; Invitrogen, Carlsbad, CA, USA)
supplemented with 10% (v ⁄ v) heat-inactivated fetal bovine
serum (FBS; Sigma, St Louis, MO, USA). Mouse EL4 lym-
phoma cells were grown in DMEM ⁄ 5% (v ⁄ v) FBS. Media
were supplemented with 1% (w ⁄ v) penicillin-streptomycin
(Invitrogen). Cells were grown at 37 °C in a humidified
atmosphere of 5% (v ⁄ v) CO
2
.
Cell synchronization protocols
Cell sorting
Mouse 3T3 fibroblasts or EL4 lymphoma cells were grown
in logarithmic cell cultures for 2 days. For mRNA steady-
state measurements, cells were stained with 5 lgÆmL
)1
Hoechst 33342 (Sigma, Franklin Lakes, NJ, USA) for
30 min, and separated into G
1
, S and G
2
⁄ M phase cells by
FACS (FACStar Plus Pulse Processor; Becton-Dickinson,
xxxx, xxxx). Alternatively, for mRNA half-life measure-
ments, cells were incubated with 6 lgÆmL
)1
actinomycin D
(Sigma) or 20 lgÆmL
)1
DRB (Sigma) for 0, 30, 60 or
120 min, then stained with 5 lgÆmL
)1
Hoechst 33342 for
30 min, and separated into G
1
, S and G
2
⁄ M phase cells by
FACS. Fractionated cells were collected in RLT buffer (Qi-
agen, Valencia, CA, USA) and stored at )70 °C until RNA
extraction.
Centrifugal elutriation
Centrifugal elutriation was performed in a Beckman JE 5.0
centrifuge and a JE-5S rotor equipped with the standard
A. Penelova et al. Cell cycle regulation of mouse cyclin mRNAs
FEBS Journal 272 (2005) 5217–5229 ª 2005 FEBS 5225
separation chamber. Logarithmically growing EL4 cells
(3 · 10
8
)6 · 10
8
) were introduced into the separation
chamber. Cells were elutriated at 4 °C in NaCl ⁄ P
i
contain-
ing 2% (v ⁄ v) FBS. Elutriation was executed at a constant
rotor speed of 2800 r.p.m. (755 g). The fractionation of
cells into cell cycle subpopulations was accomplished by
increasing the pump speed stepwise from the initial flow
rate of 20 mLÆmin
)1
to a maximum of 55 mL Æmin
)1
. Cell
fractions of 100 mL were harvested. The cell cycle distribu-
tion was determined on propidium iodide-stained aliquots
of cells. Enriched cell populations were cultured in fresh
DMEM ⁄ 5% (v ⁄ v) FBS for 2, 4, 6 or 8 h and aliquots re-
analysed for the cell cycle distribution.
Nocodazole block
Mouse EL4 cells (3 · 10
5
) were grown in 75-cm
2
flasks for
1 day. Then they were incubated with 40 ngÆmL
)1
nocodaz-
ole (Sigma) for 14 h and released from the block for 30, 60,
90, 120 or 180 min. To each fraction 20 lgÆmL
)1
DRB
(Sigma) was added for 0, 30, 60, 120 and 180 min. One-
tenth of each fraction was stained with propidium iodide
(Sigma) and analysed by FACS. The rest of the cells were
stored at )70 °C in RLT buffer (Qiagen) until RNA extrac-
tion.
Propidium iodide staining
To test the cell cycle distribution of cells, an aliquot of cells
was fixed with ethanol, stained with 50 lgÆmL
)1
propidium
iodide (Sigma) and 200 lgÆmL
)1
RNase A (Sigma), and
analysed by a Becton-Dickinson FACScan flow cytometer.
RNA extraction, RNA half-life measurements and
northern blot hybridization
Total cellular RNA was extracted with RNeasy Mini
Kit (Qiagen) following the manufacturer’s protocol. For
RNA half-life measurements, 6 lg Æ mL
)1
actinomycin D or
20 lgÆmL
)1
DRB was added 0, 30, 60, 120 and 180 min
before RNA extraction. Total RNA (10 lgÆsample
)1
) was
separated on a 1.2% agarose formaldehyde gel. RNA was
transferred by capillarity onto Immobilon
TM
-Ny
+
mem-
brane (Millipore, Billerica, MA, USA) and UV-crosslinked
in a Stratalinker (Stratagene, La Jolla, CA, USA) at
1.2 · 10
5
lJ.
The mouse cyclin A2, B1, D3, E1 and cks2 cDNA probes
were generated by PCR amplification of their coding
sequences. The GAPDH probe template was the EcoRI-
HindIII fragment of the coding region [30]. To detect long
transcripts of cyclins A2 and B1, we amplified by PCR the
3¢UTR of cyclin A2 at nucleotides 2129–2779 (GenBank
accession no. NM_009828) and of cyclin B1 at nucleotides
2011–2311 (GenBank accession no. NM_172301).
Fifty nanograms of DNA template was labelled by ran-
dom priming for 4 h at 37 °C in a 30-lL reaction volume
containing 50 mm Tris ⁄ HCl pH 8, 200 mm Hepes,
0.1 mgÆmL
)1
BSA, 5 mm MgCl
2
, 100 lm 2-mercaptoetha-
nol, 20 lm dATP, 20 lm dGTP, 20 lm dTTP and 50 lCi
[
32
P]dCTP (3000 CiÆ mmol
)1
), 2 U Klenow (Roche, Basel,
Switzerland) and 27 A
260
units hexanucleotide (Pharmacia,
Peapack, NJ, USA) for priming.
Membranes were prehybridized for at least 1 h at 42 °C
in hybridization buffer (50% formamide, 1% SDS,
4.8 · NaCl ⁄ Cit, 10% dextran sulfate) with 100 lgÆmL
)1
sal-
mon sperm DNA. Denatured probe was added to the
hybridization solution and allowed to hybridize to the
membrane at 42 °C overnight. Membranes were rinsed with
1 · NaCl ⁄ Cit, 0.1% SDS, washed twice for 30 min at
65 °Cin0.2· NaCl ⁄ Cit, 0.1% SDS and then visualized by
Imaging Plate BAS-MP 2040S (Fuji Photo Film, Tokyo,
Japan) and Kodak Biomax
TM
films (Rochester, NY, USA).
Images were quantified using a Bio-imaging analyser BAS-
1000 (Fuji) and advanced image data analyzer (aida
2.0) software. For additional hybridizations, the membranes
were stripped twice for 15 min in 250 mL of boiling
0.1 · NaCl ⁄ Cit, 0.5% SDS.
Reverse transcription and real-time PCR
To avoid amplification of residual genomic DNA, firstly
this was removed from total RNA on the RNeasy Mini Kit
column by treating with RNase-free DNase I Set (Qiagen)
according to the manufacturer’s protocol. We then used a
specific fluorogenic probe labelled with 5¢ 6-carboxy-fluor-
secein (FAM) and 3¢ 6-carboxy-tetraethyl-rhodamine
(TAMRA) for Taqman quantification. Almost all fluoro-
genic probes were chosen such as to hybridize to an exon–
exon junction (Table 1), except in the case of cks2 mRNA
where the reverse primer is at the intron–exon junction and
histone 4 mRNA that has no intron. To avoid cross-ampli-
fication of pseudogenes, we verified that primer sequences
did not appear elsewhere in the EST database. When
choosing a new primer set for real-time PCR we always
verified that there was no significant amplification product
in the absence of reverse transcriptase.
First-strand cDNA was synthesized using 1 lg RNA in a
20-lL reverse transcriptase reaction mixture, containing
1 · RT buffer, 0.01 m dithiothreitol, 0.5 mm of each dNTP,
1 lg random hexamer pd(N)
6
(Pharmacia), 2 U RNasin
(Amersham Biosciences, Piscataway, NJ, USA) and 200 U
M-MLV reverse transcriptase (Invitrogen). The reverse tran-
scriptase reaction was carried out at 42 °C for 90 min and
then inactivated for 5 min at 95 °C. The cDNA was diluted
at least 20-fold prior to PCR amplification. The PCR was
performed in the GeneAmpÒ5700 sequence detection sys-
tem (Applied Biosystems, Foster City, CA, USA). Taqman
PCR reactions were performed in a 25-lL volume contain-
Cell cycle regulation of mouse cyclin mRNAs A. Penelova et al.
5226 FEBS Journal 272 (2005) 5217–5229 ª 2005 FEBS
ing 10 lL cDNA, 1 · qPCR
TM
Core Kit (Eurogentec, Sera-
ing, Belgium), 0.25 U of uracil N-glycosylase (Eurogentec),
forward and reverse primers, and fluorogenic probe. The
reactions were performed in 96-well optical plates (Applied
Biosystems). The reactions were incubated for 2 min at
50 °C to activate the uracil N-glycosylase, then for 10 min
Table 1. Primers and fluorogenic probes used for real-time PCR.
Gene ⁄ accession number Orientation 5¢fi3¢ sequence Concentration [n
M]
ARP0
X15267 Forward CTTTGGGCATCACCACGAA 300
Reverse GCTGGCTCCCACCTTGTCT 300
Probe ATCAGCTGCACATCACTCAGAATTTCAATGGT 100
Cyclin A2
NM_009828 Forward CCTTCCACTTGGCTCTCTACACA 700
Reverse GACTCTCCAGGGTATATCCAGTCTGT 500
Probe TGCCAATGACTCAGGCCAGCTCTGT 150
Cyclin B1
NM_172301 Forward AGATGGAGATGAAGATTCTCAGAGTTCT 500
Reverse GACGTCAACCTCTCCGACTTTAG 500
Probe CCTCTGCCTCTGCACTTCCTCCGTAGA 150
Cyclin C
NM_016746 Forward GGACGGATCTCTGTCTGCTGTA 300
Reverse ACTGTCTAGCATCTTTCTGTTGTACGA 500
Probe TCCGTTCATGATCGCTTTAGCTTGCCTAC 150
Cyclin D1
NM_007631 Forward GTGCGTGCAGAAGGAGATTGT 500
Reverse CAGCGGGAAGACCTCCTCTT 700
Probe TCCTCACAGACCTCCAGCATCCAGGT 100
Cyclin D2
NM_009829 Forward CGTACATGCGCAGGATGGT 700
Reverse AATTCATGGCCAGAGGAAAGAC 300
Probe TTTGTTCCTCACAGACCTCTAGCATCCAGGT 100
Cyclin D3
NM_007632 Forward AAAGGAGATCAAGCCGCACAT 300
Reverse GTTCATAGCCAGAGGGAAGACATC 500
Probe CTCCTCACACACCTCCAGCATCCAGTATG 100
Cyclin E1
NM_007633 Forward TCTCCTCACTGGAGTTGATGCA 300
Reverse AACGGAACCATCCATTTGACA 500
Probe CTCTATGTCGCACCACTGATAACCTGAGACCTT 150
Cks2
NM_025415 Forward CCGAAGAGGAGTGGAGGAGACT 700
Reverse ATATGCGGTTCTGGCTCATGA 700
Probe CATGTAATGAACCCATCCTAGACTCTGTTGGACA 150
RanBP1
NM_011239 Forward TGAGGAGGGACAAAACCTTGAA 700
Reverse TCGGTCACTGCCAGCATTC 700
Probe CCAACCACTATATTACACCAATGATGGAGCTGAA 100
RanGTPase
S83456 Forward CAACAAAGTGGATATTAAAGACAGGAAAG 300
Reverse TGGCAGAAATGTCATAGTACTGAAGATT 700
Probe AAGGCAAAATCTATTGTCTTCCACCGGAAGAA 200
c-myc
NM_010849 Forward CTGGATTTCCTTTGGGCGTT 200
Reverse TGGTGAAGTTCACGTTGAGGG 200
Probe AAACCCCGCAGACAGCCACGAC 200
Histone 4
NM_175652 Forward GCATCTCCGGCCTCATCTAC 300
Reverse CGGATGACGTTCTCCAGGAA 500
Probe ACCTTCAGCACACCACGGGTCTCCT 150
A. Penelova et al. Cell cycle regulation of mouse cyclin mRNAs
FEBS Journal 272 (2005) 5217–5229 ª 2005 FEBS 5227
at 95 °C to inactivate the uracil N-glycosylase and activate
the HotStartTaq DNA polymerase, followed by 40 cycles of
15 s at 95 °C, 1 min at 60 °C. The generated data were ana-
lysed with the GeneAmpÒ5700 system software. The fold-
change or half-life of tested mRNAs relative to the mouse
acidic ribosomal phosphoprotein P0 (mARP0) [31] were
determined for both cell lines by using a standard curve
method.
Calculation of mRNA half-lives was carried out by plot-
ting data on a semilogarithmic graph and calculating the
first order decay slope using linear regression. Values of
independent experiments were used to calculate the average
half-lives ± SD. Alternatively, data of several experiments
were plotted on a single graph to calculate the linear regres-
sion slope and 95% confidence limits.
Acknowledgements
This work was supported by grants of the Swiss
National Science Foundation and the Swiss Cancer
League.
References
1 Morgan DO (1997) Cyclin-dependent kinases: engines,
clocks and microprocessors. Annu Rev Cell Dev Biol 13,
261–291.
2 Johnson D & Walker C (1999) Cyclins and cell cycle
checkpoints. Annu Rev Pharmacol Toxicol 39, 195–312.
3 Malumbres M & Barbacid M (2001) To cycle or not to
cycle: a critical decision in cancer. Nature Rev Cancer 1,
222–231.
4 Iyer VR, Eisen MB, Ross DT, Schuler G, Moore T, Lee
JCF, Trent JM, Staudt LM, Hudson J Jr, Boguski MS
et al. (1999) The transcriptional program in the response
of human fibroblasts to serum. Science 283, 83–87.
5 Cho RJ, Huang M, Campbell MJ, Dong H, Steinmetz
L, Sapinoso L, Hampton G, Elledge SJ, Davis RW &
Lockhart DJ (2001) Transcriptional regulation and
function during the human cell cycle. Nature Genet 27,
48–54.
6 Coqueret O (2002) Linking cyclins to transcriptional
control. Gene 299, 35–55.
7Mo
¨
ro
¨
y T & Geisen C (2004) Cyclin E. Int J Biochem
Cell Biol 36, 1424–1439.
8 Henglein B, Chenivesse X, Wang J, Eick D & Brechot
C (1994) Structure and cell cycle-regulated transcription
of the human cyclin A gene. Proc Natl Acad Sci USA
91, 5490–5494.
9 Hwang A, Maity A, McKenna WG & Muschel RJ
(1995) Cell cycle-dependent regulation of the cyclin B1
promoter. J Biol Chem 270, 28419–28424.
10 Hwang A, McKenna WG & Muschel RJ (1998) Cell
cycle-dependent usage of transcription start sites. A
novel mechanism of regulation of cyclin B1. J Biol
Chem 273, 31505–31509.
11 Maity A, McKenna WG & Muschel RJ (1995) Evidence
for post-transcriptional regulation of cyclin B1 mRNA
in the cell cycle and following irradiation in HeLa cells.
EMBO J 14, 603–609.
12 Maity A, McKenna WG & Muschel RJ (1997) Cyclin A
message stability varies with the cell cycle. Cell Growth
Diff 8, 311–318.
13 Oda S, Nishida J, Nakabeppu Y & Sekiguchi M (1995)
Stabilization of cyclin E and cdk2 mRNAs at G1 ⁄ S
transition in Rat-1A cells emerging from the G0 state.
Oncogene 10, 1343–1351.
14 Wang W, Furneaux H, Cheng H, Caldwell MC, Hutter
D, Liu Y, Holbrook N & Gorospe M (2000) HuR regu-
lates p21 mRNA stabilization by UV light. Mol Cell
Biol 20, 760–769.
15 Wang W, Caldwell MC, Lin S, Furneaux H & Gorospe
M (2000) HuR regulates cyclin A and cyclin B1 mRNA
stability during cell proliferation. EMBO J 19, 2340–
2350.
16 Duret L, Dorkeld F & Gautier C (1993) Strong conser-
vation of non-coding sequences during vertebrates evo-
lution: potential involvement in post-transcriptional
regulation of gene expression. Nucleic Acids Res 21,
2315–2322.
17 Eward KL, Van Ert MN, Thornton M & Helmstetter
CE (2004) Cyclin mRNA stability does not vary during
the cell cycle. Cell Cycle 3, 1057–1061.
18 Pines J & Hunter T (1989) Isolation of a human cyclin
cDNA: evidence for cyclin mRNA and protein regula-
tion in the cell cycle and for interaction with p34cdc2.
Cell 58, 833–846.
19 Pines J & Hunter T (1990) Human cyclin A is adeno-
virus E1A-associated protein p60 and behaves differ-
ently from cyclin B. Nature 346, 760–763.
20 King RW, Deshaies RJ, Peters JM & Kirschner MW
(1996) How proteolysis drives the cell cycle. Science
274, 1652–1659.
21 Koepp DM, Harper JW & Elledge SJ (1999) How the
cyclin became a cyclin: regulated proteolysis in the cell
cycle. Cell 97, 431–434.
22 Trembley JH, Kren BT & Steer CJ (1994) Posttranscrip-
tional regulation of cyclin B messenger RNA expression
in the regenerating liver. Cell Growth Differ 5, 99–108.
23 Ravnik SE & Wolgemuth DJ (1996) The developmen-
tally restricted pattern of expression in the male germ
line of a murine cyclin A, cyclin A2, suggests roles in
both mitotic and meiotic cell cycles. Dev Biol 173, 69–78.
24 Thompson CB, Challoner PB, Neiman PE & Groudine
M (1985) Levels of c-myc oncogene mRNA are invar-
iant throughout the cell cycle. Nature 314, 363–366.
25 Whitfield ML, Sherlock G, Saldanha AJ, Murray JI,
Ball CA, Alexander KE, Matese JC, Perou CM, Hurt
Cell cycle regulation of mouse cyclin mRNAs A. Penelova et al.
5228 FEBS Journal 272 (2005) 5217–5229 ª 2005 FEBS
MM, Brown PO & Botstein D (2002) Identification of
genes periodically expressed in the human cell cycle and
their expression in tumors. Mol Biol Cell 13, 1977–2000.
26 Richardson HE, Stueland CS, Thomas J, Russell P &
Reed SI (1990) Human cDNAs encoding homologs of
the small p34
Cdc28 ⁄ Cdc2
-associated protein of Saccharo-
myces cerevisiae and Schizosaccharomyces pombe. Genes
Dev 4, 1332–1344.
27 Urbanowicz-Kachnowicz I, Baghdassarian N, Nakache
C, Gracia D, Mekki Y, Bryon PA & Ffrench M (1999)
ckshs expression is linked to cell proliferation in normal
and malignant human lymphoid cells. Int J Cancer 82,
98–104.
28 Hanley-Hyde J, Mushinski JF, Sadofsky M, Huppi K,
Krall M, Kozak CA & Mock B (1992) Expression of
murine cyclin B1 mRNAs and genetic mapping related
genomic sequences. Genomics 13, 1018–1030.
29 Maity A, McKenna WG, Markiewicz DA, Kunig A &
Muschel RJ (1994) Alternate polyadenylation in rodent
cells results in two differentially expressed cyclin B1
mRNAs. Biochem Biophys Res Com 202, 908–914.
30 Sabath DE, Broome HE & Prystowsky MB (1990) Gly-
ceraldehyde-3-phosphate dehydrogenase mRNA is a
major interleukin 2-induced transcript in a cloned
T-helper lymphocyte. Gene 91, 185–191.
31 Krowczynska AM, Coutts M, Makrides S & Brawer-
man G (1989) The mouse homologue of the human
acidic ribosomal phosphoprotein PO: a highly conserved
polypeptide that is under translational control. Nucleic
Acids Res 17, 6408.
A. Penelova et al. Cell cycle regulation of mouse cyclin mRNAs
FEBS Journal 272 (2005) 5217–5229 ª 2005 FEBS 5229