Báo cáo khoa học: "A Re-examination on Features in Regression Based Approach to Automatic MT Evaluation" pdf
Bạn đang xem bản rút gọn của tài liệu. Xem và tải ngay bản đầy đủ của tài liệu tại đây (237.42 KB, 6 trang )
Proceedings of the ACL-08: HLT Student Research Workshop (Companion Volume), pages 25–30,
Columbus, June 2008.
c
2008 Association for Computational Linguistics
A Re-examination on Features in Regression Based Approach to Auto-
matic MT Evaluation
Shuqi Sun, Yin Chen and Jufeng Li
School of Computer Science and Technology
Harbin Institute of Technology, Harbin, China
{sqsun, chenyin, jfli}@mtlab.hit.edu.cn
Abstract
Machine learning methods have been exten-
sively employed in developing MT evaluation
metrics and several studies show that it can
help to achieve a better correlation with hu-
man assessments. Adopting the regression
SVM framework, this paper discusses the lin-
guistic motivated feature formulation strategy.
We argue that “blind” combination of avail-
able features does not yield a general metrics
with high correlation rate with human assess-
ments. Instead, certain simple intuitive fea-
tures serve better in establishing the
regression SVM evaluation model. With six
features selected, we show evidences to sup-
port our view through a few experiments in
this paper.
1 Introduction
The automatic evaluation of machine translation
(MT) system has become a hot research issue in
MT circle. Compared with the huge amount of
manpower cost and time cost of human evaluation,
the automatic evaluations have lower cost and re-
usability. Although the automatic evaluation met-
rics have succeeded in the system level, there are
still on-going investigations to get reference trans-
lation better (Russo-Lassner et al., 2005) or to deal
with sub-document level evaluation (Kulesza et al.,
2004; Leusch et al, 2006).
N-grams’ co-occurrence based metrics such as
BLEU and NIST can reach a fairly good correla-
tion with human judgments, but due to their con-
sideration for the capability of generalization
across multiple languages, they discard the inher-
ent linguistic knowledge of the sentence evaluated.
Actually, for a certain target language, one could
exploit this knowledge to help us developing a
more “human-like” metric. Giménez and Márquez
(2007) showed that compared with metrics limited
in lexical dimension, metrics integrating deep lin-
guistic information will be more reliable.
The introduction of machine learning methods
aimed at the improvement of MT evaluation met-
rics’ precision is a recent trend. Corston-Oliver et
al. (2001) treated the evaluation of MT outputs as
classification problem between human translation
and machine translation. Kulesza et al. (2004) pro-
posed a SVM classifier based on confidence score,
which takes the distance between feature vector
and the decision surface as the measure of the MT
system’s output. Joshua S. Albrecht et al. (2007)
adopted regression SVM to improve the evaluation
metric.
In the rest of this paper, we will first discuss
some pitfalls of the n-gram based metrics such as
BLEU and NIST, together with the intuition that
factors from the linguist knowledge can be used to
evaluate MT system’s outputs. Then, we will pro-
pose a MT evaluation metric based on SVM re-
gression using information from various linguistic
levels (lexical level, phrase level, syntax level and
sentence-level) as features. Finally, from empirical
studies, we will show that this metric, with less
simple linguistic motivated features, will result in a
better correlation with human judgments than pre-
vious regression-based methods.
2 N-gram Based vs Linguistic Motivated
Metrics
N-gram co-occurrence based metrics is the main
trend of MT evaluation. The basic idea is to com-
pute the similarity between MT system output and
25
several human reference translations through the
co-occurrence of n-grams. BLEU (Papineni et al.,
2002) is one of the most popular automatic evalua-
tion metrics currently used. Although with a good
correlation with human judgment, it still has some
defects:
● BLEU considers precision regardless of recall.
To avoid a low recall, BLEU introduces a brevity
penalty factor, but this is only an approximation.
● Though BLEU makes use of high order n-
grams to assess the fluency of a sentence, it does
not exploit information from inherent structures of
a sentence.
● BLEU is a “perfect matching only” metric.
This is a serious problem. Although it can be alle-
viated by adding more human reference transla-
tions, there may be still a number of informative
words that will be labeled as “unmatched”.
● BLEU lacks models determining each n-
gram’s own contribution to the meaning of the sen-
tence. Correct translations of the headwords which
express should be attached more importance to
than that of accessory words e.g.
● While computing geometric average of preci-
sions from unigram to n-gram, if a certain preci-
sion is zero, the whole score will be zero.
In the evaluation task of a MT system with cer-
tain target language, the intuition is that we can
fully exploit linguistic information, making the
evaluation progress more “human-like” while leav-
ing the capability of generalization across multiple
languages (just the case that BLEU considers) out
of account.
Following this intuition, from the plentiful lin-
guist information, we take the following factors in
to consideration:
● Content words are important to the semantic
meaning of a sentence. A better translation will
include more substantives translated from the
source sentence than worse ones. In a similar way,
a machine translation should be considered a better
one, if more content words in human reference
translations are included in it.
● At the phrase level, the situation above re-
mains the same, and what is more, real phrases are
used to measure the quality of the machine transla-
tions instead of merely using n-grams which are of
little semantic information.
● In addition, the length of translation is usually
in good proportion to the source language. We be-
lieve that a human reference translation sentence
has a moderate byte-length ratio to the source sen-
tence. So a machine translation will be depreciated
if it has a ratio considerably different from the ratio
calculated from reference sentences.
● Finally, a good translation must be a “well-
formed” sentence, which usually brings a high
probability score in language models, e.g. n-gram
model.
In the next section, using regression SVM, we
will build a MT evaluation metric for Chinese-
English translation with features selected from
above aspects.
3 A Regression SVM Approach Based on
Linguistic Motivated Features
Introducing machine learning methods to establish
MT evaluation metric is a recent trend. Provided
that we could get many factors of human judg-
ments, machine learning will be a good method to
combine these factors together. As proved in the
recent literature, learning from regression is of a
better quality than from classifier (Albrecht and
Hwa, 2007; Russo-Lassner et al., 2005; Quirk,
2004). In this paper, we choose regression support
vector machine (SVM) as the learning model.
3.1 Learning from human assessment data
The machine translated sentences for model train-
ing are provided with human assessment data score
together with several human references. Each sen-
tence is treated as a training example. We extract
feature vectors from training examples, and human
assessment score will act as the output of the target
function. The regression SVM will generate an
approximated function which maps multi-
dimensional feature vectors to a continuous real
value with a minimal error rate according to a loss
function. This value is the result of the evaluation
process.
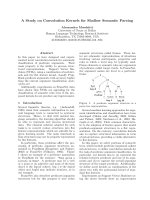
Figure 1 shows our general framework for re-
gression based learning, in which we train the
SVM with a number of sentences x
1
, x
2
, … with
human assessment scores y
1
, y
2
, … and use the
trained model to evaluate an test sentence x with
feature vector (f
1
, f
2
,…, f
n
). To determine which
indicators of a sentence are chosen as features is
research in progress, but we contend that “the more
features, the better quality” is not always true.
Large feature sets require more computation cost,
though maybe result in a metric with a better corre-
26
lation with human judgments, it can also be
achieved by introducing a much smaller feature set.
Moreover, features may conflict with each others,
and bring down the performance of the metric. We
will show this in the next section, using less than
10 features stated in section 3.2. Some details of
the implementation will also be described.
Figure 1: SVM based model of automatic MT evalua-
tion metric
3.2 Feature selection
A great deal of information can be extracted from
the MT systems’ output using linguistic knowledge.
Some of them can be very informative while easy
to obtain.
As considered in section 2, we choose factors
from lexical level, phrase level, syntax level and
sentence-level as features to train the SVM.
● Features based on translation quality of con-
tent words
The motivation is that content words are carry-
ing more important information of a sentence
compared with function words. In this paper, con-
tent words include nouns, verbs, adjectives, adver-
bials, pronouns and cardinal numerals. The
corresponding features are the precision of content
words defined in Eq. 1 and the recall defined in Eq.
2 where ref means reference translation.
()
#_ ___
#__
con
precision t
correctly translated cons in t
cons in t
=
(1)
()
#___ _ __
#___
con
recall t
cons in ref correctly translated in t
cons in the ref
=
(2)
● Features based on cognate words matching
English words have plenty of morphological
changes. So if a machine translation sentence
shares with a human reference sentence some cog-
nates, it contains at least some basic information
correct. And if we look at it in another way, words
that do not match in the original text maybe match
after morphological reduction. Thus, differences
between poor translations will be revealed. Simi-
larly, we here define the content word precision
and recall after morphological reduction in Eq. 3
and Eq. 4 where mr_cons means content words
after morphological reduction:
_
()
#_ ____
#_ __
mr con
precision t
correctly translated mr cons in t
mr cons in t
=
(3)
_
()
#_ __ _ _ __
#_ ___
mr con
recall t
mr cons in ref correctly translated in t
mr cons in the ref
=
(4)
● Features based on translation quality of
phrases
Phrases are baring the weight of semantic in-
formation more than words. In manual evaluation,
or rather, in a human’s mind, phrases are paid spe-
cial attention to. Here we parse every sentence
1
and
extract several types of phrases, then, compute the
precision and recall of each type of phrase accord-
ing to Eq. 5 and Eq. 6
2
:
tinphrs
tinphrstranslatedcorrectly
tprecision
phr
__#
____#
)( =
(5)
reftheinphr
tintranslatedcorrectlyrefinphr
trecall
phr
___#
______#
)( =
(6)
In practice, we found that if we compute these
two indicators by matching phrases case-
insensitive, we will receive a metric with higher
performance. We speculate that by doing this the
difference between poor translations is revealed
just like morphological reduction.
● Features based on byte-length ratio
Gale and Church (1991) noted that he byte-
length ratio of target sentence to source sentence is
normally distributed. We employ this observation
by computing the ratio of reference sentences to
1
The parser we used is proposed by Michael Collins in Col-
lins (1999).
2
Only precision and recall of NP are used so far. Other types
of phrase will be added in future study.
Machine
Translation Sentence
Feature extraction
x = (f
1
, f
2
,…, f
n
)
Regression SVM
y = g(x)
Assessmen
t
x
2
=(
f
1
,
f
2
,…,
f
n
), y = y
2
x
1
=(
f
1
,
f
2
,…,
f
n
), y = y
1
Training Se
t
…
27
source sentences, and then calculating the mean c
and variance s of this ratio. So if we take the ratio r
as a random variable, (r-c)/s has a normal distribu-
tion with mean 0 and variance 1. Then we compute
the same ratio of machine translation sentence to
source sentence, and take the output of p-norm
function as a feature:
)
__/__
()(
s
csrcoflengthtoflenght
Ptf
norm
−
=
(7)
● Features based on parse score
The usual practice to model the “well-
formedness” of a sentence is to employ the n-gram
language model or compute the syntactic structure
similarity (Liu and Gildea 2005). However, the
language model is widely adopted in MT, resulting
less discrimination power. And the present parser
is still not satisfactory, leading much noise in parse
structure matching.
To avoid these pitfalls in using LM and parser,
here we notice that the score of a parse by the
parser also reflects the quality of a sentence. It may
be regarded as a syntactic based language model
score as well as an approximate representation of
parse structure. Here we introduce the feature
based on parser’s score as:
parserbygiventofmark
t
s
core
p
ase
r
_____
100
)(
_
−
=
(8)
4 Experiments
We use SVM-Light (Joachims 1999) to train our
learning models. Our main dataset is NIST’s 2003
Chinese MT evaluations. There are 6×919=5514
sentences generated by six systems together with
human assessment data which contains a fluency
score and adequacy score marked by two human
judges. Because there is bias in the distributions of
the two judges’ assessment, we normalize the
scores following Blatz et al. (2003). The normal-
ized score is the average of the sum of the normal-
ized fluency score and the normalized adequacy
score.
To determine the quality of a metric, we use
Spearman rank correlation coefficient which is
distribution-independent between the score given
to the evaluative data and human assessment data.
The Spearman coefficient is a real number ranging
from -1 to +1, indicating perfect negative correla-
tions or perfect positive correlations. We take the
correlation rates of the metrics reported in Albrecht
and Hwa (2007) and a standard automatic metric
BLEU as a baseline comparison.
Among the features described in section 3.2, we
finally adopted 6 features:
● Content words precision and recall after mor-
phological reduction defined in Eq. 3 and Eq. 4.
● Noun-phrases’ case insensitive precision and
recall.
● P-norm (Eq. 7) function’s output.
● Rescaled parser score defined in Eq. 8. Our
first experiment will compare the correlation rate
between metric using rescaled parser score and that
using parser score directly.
4.1 Different kernels
Intuitively, features and the resulting assessment
are not in a linear correlation. We trained two
SVM, one with linear kernel and the other with
Gaussian kernel, using NIST 2003 Chinese dataset.
Then we apply the two metrics on NIST 2002 Chi-
nese Evaluation dataset which has 3×878=2634
sentences (3 systems total). The results are summa-
rized in Table 1. For comparison, the result from
BLEU is also included.
Feature Linear Gaussian BLEU
Rescale 0.320
0.329
Direct 0.317 0.224
0.244
Table 1: Spearman rank-correlation coefficients for re-
gression based metrics using linear and Gaussian kernel,
and using rescaled parser score or directly the parser
score. Coefficient for BLEU is also involved.
Table 1 shows that the metric with Gaussian
kernel using rescaled parser score gains the highest
correlation rate. That is to say, Gaussian kernel
function can capture characteristics of the relation
better, and rescaling the parser score can help to
increase the correlation with human judgments.
Moreover, as other features range from 0 to 1, we
can discover in the second row of Table 1 that
Gaussian kernel is suffering more seriously from
the parser score which is ranging distinctly. In fol-
lowing experiments, we will adopt Gaussian kernel
to train the SVM and rescaled parser score as a
feature.
4.2 Comparisons within the year 2003
We held out 1/6 of the assessment dataset for pa-
rameter turning, and on the other 5/6 of dataset, we
perform a five-fold cross validation to verify the
metric’s performance. In comparison we introduce
28
several metrics’ coefficients reported in Albrecht
and Hwa (2007) including smoothed BLEU (Lin
and Och, 2004), METEOR (Banerjee and Lavie,
2005), HWCM (Liu and Gildea 2005), and the me-
tric proposed in Albrecht and Hwa (2007) using
the full feature set. The results are summarized in
Table 2:
Metric Coefficient
Our Metric 0.515
Albrecht, 2007
0.520
Smoothed BLEU 0.272
METEOR 0.318
HWCM 0.288
Table 2: Comparison among various metrics. Learning-
based metrics are developed from NIST 2003 Chinese
Evaluation dataset and tested under five-fold cross vali-
dation.
Compared with reference based metrics such as
BLEU, the regression based metrics yield a higher
correlation rate. Generally speaking, for a given
source sentence, there is usually a lot of feasible
translations, but reference translations are always
limited though this can be eased by adding refer-
ences. On the other hand, regression based metrics
is independent of references and make the assess-
ment by mapping features to the score, so it can
make a better judgment even dealing with a trans-
lation that doesn’t match the reference well.
We can also see that our metric which uses only
6 features can reach a pretty high correlation rate
which is close to the metric proposed in Albrecht
and Hwa (2007) using 53 features. That confirms
our speculation that a small feature set can also
result in a metric having a good correlation with
human judgments.
4.3 Crossing years
Though the training set and test set in the experi-
ment described above are not overlapping, in the
last, they come from the same dataset (NIST 2003).
The content of this dataset are Xinhua news and
AFC news from Jan. 2003 to Feb. 2003 which has
an inherent correlation. To test the capability of
generalization of our metric, we trained a metric on
the whole NIST 2003 Chinese dataset (20% data
are held out for parameter tuning) and applied it
onto NIST 2002 Chinese Evaluation dataset. We
use the same metrics introduced in section 4.2 for
comparison. The results are summarized in Table 3:
Metric Coefficient
Our Metric
0.329
Albrecht, 2007 0.309
Smoothed BLEU 0.269
METEOR 0.290
HWCM 0.260
Table 3: Cross year experiment result. All the learning
based metrics are developed from NIST 2003.
The content of NIST 2002 Chinese dataset is
Xinhua news and Zaobao’s online news from Mar.
2002 to Apr. 2002. The most remarkable character-
istic of news is its timeliness. News come from the
year 2002 are nearly totally unrelated to that from
the year 2003. It can be seen from Table 3 that we
have got the expected results. Our metric can gen-
eralize well across years and yields a better corre-
lation with human judgments.
4.4 Discussions
Albrecht and Hwa (2007) and this paper both
adopted a regression-based learning method. In
fact, the preliminary experiment is strictly set ac-
cording to their paper. The most distinguishing
difference is that the features in Albrecht and Hwa
(2007) are collections of existing automatic evalua-
tion metrics. The total 53 features are computa-
tionally heavy (for the features from METEOR,
ROUGE, HWCM and STM). In comparison, our
metric made use of six features coming from lin-
guistic knowledge which can be easily obtained.
Moreover, the experiments show that our metric
can reach a correlation with human judgments
nearly as good as the metric described in Albrecht
and Hwa (2007), with a much lower computation
cost. And when we applied it to a different year’s
dataset, its correlation rate is much better than that
of the metric from Albrecht and Hwa (2007),
showing us a good capability of generalization.
To account for this, we deem that the regression
model is not resistant to data overfiting. If pro-
vided too much cross-dependent features for a lim-
ited training data, the model is prone to a less
generalized result. But, it is difficult in practice to
locate those key features in human perception of
translation quality because we are lack of explicit
evidences on what human actually use in transla-
tion evaluation. In such cases, this paper uses only
“simple feature in key linguistic aspects”, which
reduces the risk of overfitting and bring a more
generalized regression results.
29
Compared with the literature, the “byte-length
ratio between source and translation” and the
“parse score” are original in automatic MT evalua-
tion modeling. The parse score is proved to be a
good alternative to LM. And it helps to avoid the
errors of parser in parse structure (the experiment
to verify this claim is still on-going).
It should be noted that feature selection is ac-
complished by empirically exhaustive test on the
combination of the candidate features. In future
work, we will test if this strategy will help to get
better results for MT evaluation, e.g. try-on the
selection between the 53 features in Albrecht and
Hwa (2007). And, we will also test to see if lin-
guistic motivated feature augmentation would
bring further benefit.
5 Conclusion
For the metrics based on regressing, it is not al-
ways true that more features and complex features
will help in performance. If we choose features
elaborately, simple features are also effective. In
this paper we proposed a regression based metric
with a considerably small feature set that yield per-
formance of the same level to the metrics with a
large set of 53 features. And the experiment of the
cross-year validation proves that our metric bring a
more generalized evaluation results by correlating
with human judgments better.
Acknowledgements
This research is support by Natural Science Foun-
dation of China (Grant No. 60773066) and Na-
tional 863 Project (Grant No. 2006AA01Z150)
References
Joshua S. Albrecht and Rebecca Hwa. 2007. A Re-
examination of Machine Learning Approaches for
Sentence-Level MT Evaluation. In Proceedings of
the 45th Annual Meeting of the Association of Com-
putational Linguistics , pages 880-887, Prague,
Czech Republic, June.
Satanjeev Banerjee and Alon Lavie. 2005. METEOR:
An Automatic Metric for MT Evaluation with Im-
proved Correlation with Human Judgments. In Pro-
ceedings of the Workshop on Intrinsic and Extrinsic
Evaluation Measures for MT and/or Summarization
at the Association for Computational Linguistics
Conference 2005: 65-73. Ann Arbor, Michigan.
John Blatz, Erin Fitzgerald, George Foster, Simona
Gandrabur, Cyril Goutte, Alex Kulesza, Alberto San-
chis, and Nicola Ueffing. 2003. Confidence estima-
tion for machine translation. In Technical Report
Natural Language Engineering Workshop Final Re-
port, pages 97-100, Johns Hopkins University.
Simon Corston-Oliver, Michael Gamon, and Chris
Brockett. 2001. A machine learning approach to the
automatic evaluation of machine translation. In Pro-
ceedings of the 39th Annual Meeting of the Associa-
tion for Computational Linguistics, pages 140-147,
Toulouse, France, July.
W. Gale and K. W. Church. 1991. A Program for Align-
ing Sentences in Bilingual Corpora. In Proceedings
of the 29th Annual Meeting of the Association for
Computational Linguistics, pages 177-184, Berkeley.
Jesús Giménez and Lluís Màrquez. 2007. Linguistic
Features for Automatic Evaluation of Heterogenous
MT Systems. In Proceedings of the Second Work-
shop on Statistical Machine Translation, pages 256-
264, Prague, Czech Republic, June.
Thorsten Joachims. 1999. Making large-scale SVM
learning practical. In Bernhard Schöelkopf, Christo-
pher Burges, and Alexander Smola, editors, Ad-
vances in Kernel Methods - Support Vector Learning.
MIT Press.
Alex Kulesza and Stuart M. Shieber. 2004. A learning
approach to improving sentence-level MT evaluation.
In Proceedings of the 10th International Conference
on Theoretical and Methodological Issues in Ma-
chine Translation (TMI), pages 75-84, Baltimore,
MD, October.
Gregor Leusch, Nicola Ueffing, and Hermann Ney.
2006. CDER: Efficient MT evaluation using block
movements. In The Proceedings of the Thirteenth
Conference of the European Chapter of the Associa-
tion for Computational Linguistics, pages 241-248.
Chin-Yew Lin & Franz Josef Och. 2004. Automatic
Evaluation of Machine Translation Quality Using
Longest Common Subsequence and Skip-Bigram
Statistics. In Proceedings of the 42nd Annual Meet-
ing of the Association for Computational Linguistics,
pages 606-613, Barcelona, Spain, July.
Ding Liu and Daniel Gildea. 2005. Syntactic features
for evaluation of machine translation. In ACL 2005
Workshop on Intrinsic and Extrinsic Evaluation
Measures for Machine Translation and/or Summari-
zation, pages 25-32, June.
Christopher B. Quirk. 2004. Training a Sentence-Level
Machine Translation Confidence Measure, In Pro-
ceedings of LREC 2004, pages 825-828.
Grazia Russo-Lassner, Jimmy Lin, and Philip Resnik.
2005. A Paraphrase-Based Approach to Machine
Translation Evaluation. In Technical Report LAMP-
TR-125/CS-TR-4754/UMIACS-TR-2005-57, Univer-
sity of Maryland, College Park, August.
30