Báo cáo khoa học: Are UV-induced nonculturable Escherichia coli K-12 cells alive or dead? ppt
Bạn đang xem bản rút gọn của tài liệu. Xem và tải ngay bản đầy đủ của tài liệu tại đây (217.68 KB, 7 trang )
Are UV-induced nonculturable
Escherichia coli
K-12 cells alive or dead?
Andrea Villarino
1,2
, Marie-Noe¨ lle Rager
3
, Patrick A. D. Grimont
1,2
and Odile M. M. Bouvet
2
1
Aquabiolab and
2
Unite
´
de Biodiversite
´
des Bacte
´
ries Pathoge
`
nes E
´
mergentes, INSERM U389, Institut Pasteur, Paris, France;
3
Service de Re
´
sonance Magne
´
tique Nucle
´
aire UMR 7576, Ecole Nationale Supe
´
rieure de Chimie de Paris, France
Cells that have lost the ability to grow in culture could be
defined operationally as either alive or dead depending on
the method used to determine cell viability. As a conse-
quence, the interpretation of the state of ÔnonculturableÕ cells
is often ambiguous. Escherichia coli K12 cells inactivated by
UV-irradiation with a low (UV1) and a high (UV2) dose
were used as a model of nonculturable cells. Cells inactivated
by the UV1 dose lost ÔculturabilityÕ but they were not lysed
and maintained the capacity to respond to nutrient addition
by protein synthesis and cell wall synthesis. The cells also
retained both a high level of glucose transport and the
capacity for metabolizing glucose. Moreover, during glucose
incorporation, UV1-treated cells showed the capacity to
respond to aeration conditions modifying their metabolic
flux through the Embden–Meyerhof and pentose-phosphate
pathways. However, nonculturable cells obtained by irradi-
ation with the high UV2 dose showed several levels of
metabolic imbalance and retained only residual metabolic
activities. Nonculturable cells obtained by irradiation with
UV1 and UV2 doses were diagnosed as active and inactive
(dying) cells, respectively.
Keywords: NMR; radiation injury; viability; metabolism;
Escherichia coli.
Ultraviolet irradiation has been used in the disinfection of
drinking water, wastewater and in air disinfection [1–3].
After disinfection, microorganisms are not detectable in
standard culture media in which they have been previ-
ously found to proliferate [4]. Thus, a bacterium is
currently reported as dead when it does not yield visible
growth in bacteriological media for a given time [5].
However, it has been suggested that the bacterial
populations in water, when exposed to UV disinfection,
might show a decrease in ÔculturabilityÕ, but in fact they
could still be alive and able to cause disease [6].
Moreover, in aquatic systems among the various stresses
to which bacteria are submitted, solar radiation (UV-B,
290–320 nm) seems to be the most important in causing
the loss of culturability [7]. Wilber and Oliver [6] showed
that, although both UV-treated Salmonella serotype
Typhimurium and Escherichia coli lost culturability in
standard culture media upon irradiation, they retained the
capacity to respond to nutrients by cell elongation in the
direct viable count (DVC) method. On the other hand,
Caro et al. [8] observed that UV-treated Salmonella cells
lost the capacity of cell elongation in the DVC method
and lost culturability concomitantly with pathogenicity in
mice. However, these cells were also considered to be
alive because they retained respiratory activity, membrane
integrity and DNA integrity. In a previous study, we
considered that UV-treated E. coli cells that retained the
same activities described by Caro et al. were dead because
neither growth nor cell elongation or protein synthesis
were detected [9]. Cells could be defined operationally as
alive or dead depending on the method used to determine
cell viability. Moreover, each method is based on criteria
that reflect different levels of cellular integrity or
functionality. As a consequence, the interpretation of
the state of cells is often ambiguous [10,11]. Problems in
the interpretation of the state of cells that have lost
culturability are due, not only to the absence of consensus
on the definition of bacterial death but also, to the lack
of global studies showing their metabolic potential. The
aim of the present study was to analyze the metabolic
capacities of UV-induced nonculturable E. coli cells and
to determine whether the level of UV-irradiation affects
their metabolic potential and responsiveness. The capacity
of cells to respond to the addition of nutrients determined
by cell elongation, protein synthesis and glucose meta-
bolism was analysed, as well as the effect of different
aeration conditions on the regulation of metabolic fluxes
through the Embden–Meyerhof and pentose phosphate
pathways.
Experimental procedures
Bacterial strain and growth conditions
Escherichia coli K-12S sensitive to bacteriophage lambda
(strain CIP 54118) from the Collection de l’Institut Pasteur
(Paris, France) was used [12]. Overnight cultures of E. coli
K-12S were maintained long-term at )80 °CinTrypto
Casein Soy broth (Sanofi Diagnostics Pasteur, Marnes-la
Correspondence to O. M. M. Bouvet, Unite
´
des Pathoge
`
nes et
Fonctions des Cellules Epithe
´
liales Polarise
´
es, INSERM U510,
Faculte
´
de Pharmacie, Universite
´
Paris XI, F-92296 Chaˆ tenay-
Malabry, France. Fax: + 33 146835844, Tel.: + 33 146835843,
E-mail:
Abbreviations: UV1, low ultraviolet dose; UV2, high ultraviolet dose;
DVC method, direct viable count method; qDVC method, quantita-
tive direct viable count method; LB, Luria Bertani medium;
EM, Embden–Meyerhof pathway; PP, pentose phosphate pathway.
(Received 4 March 2003, revised 25 April 2003,
accepted 6 May 2003)
Eur. J. Biochem. 270, 2689–2695 (2003) Ó FEBS 2003 doi:10.1046/j.1432-1033.2003.03652.x
Coquette, France) supplemented with glycerol (40%, v/v).
Initially, cells were grown at 37 °C overnight in Luria–
Bertani (LB) broth [13] transferred to a fresh medium at a
dilution of 1 : 200 and grown to a late exponential phase
(D
600
¼ 0.6) in aerobic conditions. They were harvested by
centrifugation at 3800 g for 15 min at 9 °Candwashed
twice in phosphate buffer pH 7.4 (11 m
M
K
2
HPO
4
,5m
M
KH
2
PO
4
,120m
M
NaCl, 0.1 m
M
CaCl
2
,0.5m
M
MgSO
4
).
Finally, they were diluted in the same buffer to a cell density
of about 2 · 10
7
CFUÆmL
)1
and used immediately for UV
irradiation.
UV irradiation
To obtain nonculturable cells, a cell suspension containing
(2 · 10
7
CFUÆmL
)1
) was irradiated as described previously
[9]. Briefly, 6.5 mL of the cell suspension was placed in a
sterile glass Petri dish (11 cm diameter) and irradiated with
a 12-W (254 nm) germicidal lamp (Bioblock Scientific,
Illkirch, France) at 25 °C with mild agitation. The lamp, at
13 cm from the Petri dish, was switched on 1 h before
utilization and the intensity of radiation at the bottom of the
Petri dish was controlled with an ultraviolet intensity meter
(Bioblock Scientific). UV dose was calculated as the product
of exposure time and the intensity at the bottom of the Petri
dish (10 mJÆmin
)1
Æcm
)2
). Cells were irradiated by two UV
doses, UV1 dose (4 mJÆcm
)2
) corresponding to the first dose
sufficient to obtain at least a six-log. reduction (i.e.
20 CFUÆmL
)1
) in the initial colony count and UV2 dose
(80 mJÆcm
)2
) inducing about a seven-log. reduction (i.e.
2CFUÆmL
)1
). UV-treated bacteria were handled in dark-
ness. After UV irradiation, treated cells were concentrated
by centrifugation (3800 g) to a cell density of about
2 · 10
8
cellsÆmL
)1
and used immediately in further experi-
ments. For each experiment, a nonirradiated cell suspension
at the same cell density was used as an untreated control.
Culturability
Samples (2 mL) of untreated or UV-treated cell suspension
were incubated with or without 440 U of catalase
(220 UÆmL
)1
) (Sigma) at room temperature. Aliquots
(100 lL) were taken at different times and surface plated
in triplicate on LB agar supplemented with or without
catalase. Some experiments used both catalase and super-
oxide dismutase (Sigma). The enzyme solutions used were
filter-sterilized through 0.22 lm pore size membrane filter,
and 0.2 mL were aseptically spread on the surface of agar
media at a concentration of 2000 U per plate. Plates were
then incubated in aerobic and anaerobic conditions at
37 °C for 48 h.
Substrate responsiveness
Substrate responsiveness of cells was determined by the
direct viable count method (DVC) [14] in the conditions
described previously with some modifications [9]. Cell
samples were diluted (1/100, v/v) in LB medium containing
nalidixic acid (40 lgÆmL
)1
) (Sigma). Cells that exceeded at
least twice the mean length of cells before DVC were scored
as elongated. The proportion of DVC positive cells was
corrected by the proportion of elongated cells detected
before the DVC method. At the same time, cells incubated in
the same conditions but without nalidixic acid addition were
also analysed. A quantitative DVC (qDVC) method was
also used [15]. Elongated or nonelongated substrate-respon-
sive cells were selectively lysed by spheroplast formation
caused by incubation with nutrients, nalidixic acid and
glycine (2% final concentration). This glycine effect leads to
swollen cells with a very loose cell wall. The substrate-
responsive cells were then lysed easily by a single freeze-thaw
treatment. The number of cells responding to nutrients was
obtained by subtracting the number of remaining cells after
the qDVC procedure from the total cell number before the
qDVC incubation. Results were expressed as percentage of
substrate-responsive cells with respect to the original colony
count of untreated bacteria. Cell samples of DVC and
qDVC were incubated in the dark at 37 °Cfor5hwith
shaking (200 r.p.m). The cells were then fixed with 3%
formalin (final concentration) to be enumerated by epi-
fluorescence microscopy and analysed by flow cytometry.
Epifluorescence microscopy and flow cytometry
For cell enumeration, samples were filtered through poly-
carbonate membrane filters (pore size, 0.2 lm, 25-mm
diameter) (Milipore) and washed with phosphate buffer.
These cells were detected by staining with propidium iodide
(Sigma,StLouis,MO)at0.5lgÆmL
)1
(final concentration)
or by fluorescent in situ hybridization [16] with probe
EUB 338 labelled with fluorescein isothiocyanate [17].
Filters were washed and mounted with Vectashield mount-
ing medium (Vector, Burlingame, CA, USA) on glass
microscope slides and stored in the dark at 4 °C until
counted. Cells were counted with an Olympus BX-60
epifluorescence microscope (100-W mercury lamp) with a
· 100 oil immersion fluorescent objective. Cells in 24
microscopic fields per filter were enumerated and averaged
(about 400 cells for nonirradiated cells). For each sample,
three filters were examined and maximal deviations from
the mean were calculated.
Modifications of E. coli size and granularity of untreated
and UV-treated cells, before and after the DVC method
described above, were analysed by flow cytometry [18].
Duplicate samples were analysed with a Becton Dickinson
model FACScan cytometer equipped with a 15-mW, air-
cooled argon ion laser (488 nm) by using
CELL QUEST
3.3
software. The forward angle light scatter and side angle light
scatter amplifier gains were set to linear and logarithmic
mode, respectively. For each cell sample run, data for
10 000 events were collected.
Protein synthesis
Protein synthesis was analysed by incorporation of
[
35
S]methionine (Amersham Pharmacia Biotech) into pro-
teins as described earlier [9]. Proteins were precipitated after
5 h of incubation at 37 °C in aerobic conditions in LB
broth. The final concentration used for [
35
S]methionine was
0.1 m
M
at 100 lCi. The precipitate was collected onto
GF/C filters (0.45 lm), washed and radioactivity was
counted in a scintillation counter. Protein synthesis was
detected in duplicate samples and results were expressed as
nmol of [
35
S]methionine incorporated per lgofprotein.The
2690 A. Villarino et al. (Eur. J. Biochem. 270) Ó FEBS 2003
detection limit of this method was 0.01 nmol [
35
S]methio-
nine per lg protein, corresponding to protein synthesis of
about 10
6
CFUÆmL
)1
. The maximal deviation from the
mean of two independent experiments was calculated.
Glucose uptake
Duplicated samples of 2 mL of UV-treated and untreated
cell suspension were incubated with or without 440 U of
catalase (220 UÆmL
)1
). After 15 min of incubation at room
temperature, 5 m
M
of glucose (final concentration) spiked
with [
14
C]glucose (10 lCi in the 2 mL of mix) (Amersham
International) were added. The reaction mixtures were
incubated in aerobic conditions at 37 °C with shaking
(180 r.p.m). Aliquots were taken at different times, deposi-
ted on GF/C filters (pore size, 0.45 lm; 2.5 cm diameter;
Whatman, Maidstone, England) and then washed with
phosphate buffer to remove nonincorporated [
14
C]glucose.
Each filter was dried and radioactivity was measured in a
scintillation counter. Glucose uptake with catalase previ-
ously inactivated in water at 100 °C for 30 min was used as
a negative control. In order to avoid precipitation of heat-
inactivated catalase in negative control experiments, phos-
phate buffer without NaCl was used. The results obtained
were expressed as nmol [
14
C]glucose transported per lgof
protein. The detection limit of this method was 0.5 nmol
[
14
C]glucose per lg protein corresponding to glucose uptake
of about 10
7
CFUÆmL
)1
.Themaximaldeviationfromthe
mean of two independent experiments was calculated.
Metabolic flux by
13
C NMR spectroscopy
As in the case of glucose uptake, cell suspensions were
incubated with or without catalase. Here,
13
Cglucose
(Leman, St Quentin en Yvelines, France) labelled at C1 or
C6 was used and the reaction mixtures were incubated 4 h
in aerobic or anaerobic conditions. When glucose, labelled
isotopically either in position C1 or C6, is added to bacterial
suspension, the amount of label introduced in acetate C2
depends on the activity of the pentose phosphate (PP)
pathway. The equations used for estimating the relative
activities of the PP or Embden–Meyerhof (EM) pathway
were: y ) x ¼ PP, x ¼ EM, where x was the C2 enrich-
ment of the acetate measured from [1-
13
C]glucose and y the
C2 enrichment of the acetate measured from [6-
13
C]glucose.
Perchloric acid extraction was performed to prevent a
possible alteration of the secretion of the metabolites due to
the UV-treatment. The reaction was stopped by addition of
240 lL of perchloric acid at 4 °C. The samples were
vortexed for 2 min, placed in ice for 15 min, vortexed again
for 2 min and finally centrifuged at room temperature at
8000 g for 15 min. Acid extracts were neutralized to pH 7
withNaOHandstoredat)20 °C until NMR analysis. All
NMR data were recorded at 303K on a Bruker Avance 400
spectrometer using a 10-mm broad-band probe. Neutralized
extracts were introduced in a 8-mm NMR tube, itself
inserted in a 10-mm NMR tube containing D
2
O.
13
CNMR
spectra recorded at 100.13 MHz were acquired during 1 h
(2400 scans) with a composite pulse decoupling. Exponen-
tial filtering of 3 Hz was applied prior to Fourier transfor-
mation. Chemical shifts were referred to the a-C1 resonance
of
D
-glucose (93.1 p.p.m). The acetate concentration and
other metabolites formed (glucose, lactate, ethanol) were
determined by NMR analysis and enzymatic assays (Boeh-
ringer, Mannheim, Germany) as described previously [19].
Results
Loss of culturability after UV-treatment
The physiological state of nonculturable E. coli cells
obtained by irradiation with a low (UV1) and a high
(UV2) UV dose was examined. Immediately following the
UV treatment, no decrease in the total number of cells was
observed. The total cell count was 2.8 · 10
8
cellsÆmL
)1
(± 4%) for untreated and UV1- or UV2-treated cells. After
both UV treatments the great majority of the population
( 10
8
cellsÆmL
)1
) became nonculturable on LB agar plates
while a minor percentage remained culturable (0.001–
0.0001%). However, no interference from these few cultur-
able cells (UV survivors) was observed in further experi-
ments because their number remained much lower than the
detection limit of the method used. Loss of culturability on
nutrient media could be explained by direct and indirect
damage to nucleic acids produced by UV radiation [20].
Direct effects of UV radiation at 254 nm on nucleic acids
include, for example, photodimerization between adjacent
pyrimidine bases. Indirect effects result when reactive
oxygen species such as hydrogen peroxide are generated.
They also react with DNA, damaging bases, breaking
strands and cross-linking DNA and protein [2]. In our
experiments, catalase and superoxide dismutase were added
to the medium to enhance culturability by protecting
against the effects of free radicals. However, no increase in
colony count on LB agar plates of UV1- and UV2-treated
cells previously incubated in phosphate buffer containing
220 UÆmL
)1
of catalase for 2 h, 4 h, or 24 h was observed.
Furthermore, neither the addition of 2000 U catalase or
both catalase and superoxide dismutase on LB agar plates
nor incubation in anaerobic conditions reversed this result.
After prolonged incubation (5 days) no further colony
development could be observed.
During the first 24 h of incubation time without nutrients
after UV1-irradiation, the proportion of total and UV-
survivor cells remained constant. However, in the case of
cells treated with the UV2 dose, a decrease of about 30% in
the original total cell number indicated the existence of cell
lysis. This decrease in the total cell number was followed by
a small increase in the number of culturable cells, which,
after 24 h of incubation, reached almost 0.1% of the initial
value. The regrowth is most probably explained by growth
of the minor percentage of UV-survivors cells at the expense
of nutrients liberated by UV2 lysed cells. Cell lysis could be
explained by loss of the ability of UV2-treated cells to
modify their autolysins. Inhibition of murein synthesis and
loss of the electrical or pH gradient of cellular membranes
have been described as ways to trigger lysis due to the
uncontrolled autolytic action of murein hydrolases [21,22].
Response to nutrients
Epifluorescence microscopy was used to determine whether,
immediately after the UV-treatment, cells that lost cultura-
bility had the ability to produce cell elongation with the
Ó FEBS 2003 Are nonculturable E. coli cells alive or dead? (Eur. J. Biochem. 270) 2691
DVC method (incubation with nutrients and nalidixic acid).
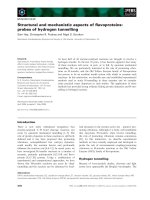
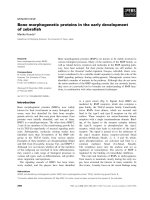
After DVC of UV1-treated cells, DVC positive cells that
exceeded at least twice the mean length of E. coli K-12 were
observed (Fig. 1, B1 and B2). Nevertheless, a few slightly
elongated cells were observed even without nalidixic addi-
tion. However, this change in cell size was not detectable or
quantifiable even after analysis of a great number of cells by
flow cytometry (data not shown). To determine whether
slightly elongated or nonelongated UV1-treated cells
responded to nutrient addition, an improved DVC method
(qDVC) was used. With this method, substrate-responsive
cells were selectively lysed by spheroplast formation caused
by incubation with nutrients, nalidixic acid and glycine. It is
known that glycine interferes with several steps in pepti-
doglycan synthesis for bacterial cell wall formation [23], and
this effect leads to swollen cells with a very loose cell wall.
The substrate-responsive cells were lysed easily by a freezing
treatment in liquid nitrogen and then thawed at room
temperature. With this method, the proportions of substrate
responsive cells obtained were 90% for untreated and 60%
for UV1-treated cells. Cell lysis was not observed in the
negative controls without glycine addition. When DVC
(Fig. 1, C1 and C2) and qDVC were performed using UV2-
treated cells, substrate responsive cells were not detected.
With these cells, no elongated cells were detected after DVC,
and after qDVC cell lysis was detected in both samples, with
or without glycine addition.
To obtain more evidence of the response to nutrients, the
incorporation of [
14
C]glucose into cells and the effect of
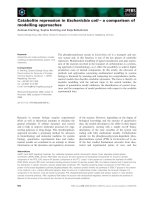
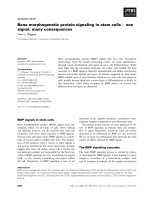
exogenous catalase on glucose uptake were studied (Fig. 2).
For untreated cells, glucose incorporation in the absence of
catalase reached a steady state level of about 3.6 lmol
[
14
C]glucose per lg protein after 4 h of incubation. UV1-
treated cells incorporated 2.5 lmol [
14
C]glucose per lg
protein corresponding to 69% of the glucose incorporated
by untreated cells. However, for UV2-treated cells, a large
decrease in the maximal glucose incorporation (0.6 lmol
[
14
C]glucose per lg protein) was observed, corresponding
to only 17% of the glucose incorporated by untreated cells
(Fig. 2A). When the same experiments were carried out in
the presence of catalase, an increase in glucose uptake of
about 60% was observed (Fig. 2B) in untreated and UV1
and UV2-treated cells. For UV2-treated cells this increase
was observed only during the first 4 h of glucose incorpor-
ation. After this time, glucose uptake with or without
catalase addition decreased (data not shown), undoubtedly
explained by the beginning of cell lysis described above. In
all cases, no increase in glucose uptake was observed when
experiments were carried out with catalase previously
inactivated at 100 °C. In nongrowth conditions, the
Fig. 1. Visualization of cells. Visualization by fluorescent in situ hybridization of untreated cells (A), UV1-treated cells (B) and UV2-treated cells
(C) before (A1, B1, C1) and after DVC method (A2, B2, C2).
Fig. 2. Glucose uptake. Glucose uptake in aerobic conditions (A), non
irradiated cells (
•
,NI),UV1-treatedcells(j, UV1) and UV2-treated
cells (m, UV2). Glucose uptake in aerobic conditions after 4 h of
incubation with or without exogenous catalase (B). The detection limit
of this method was 0.5 nmol [
14
C] glucose per g protein corresponding
to glucose uptake of about 10
7
CFUÆml
)1
(10% of the initial number
of cells).
2692 A. Villarino et al. (Eur. J. Biochem. 270) Ó FEBS 2003
imbalance during glucose uptake between cell metabolism
and the arrest of cell division could be favorable to peroxide
generation and accumulation. In E. coli,peroxidearises
primarily from the auto-oxidation of components of its
respiratory chain [24], and the presence of peroxide induces
membrane damage [25]. Thus, prevention by exogenus
catalase of peroxide damage could explain the observed
increase in glucose uptake. However, this effect was
observed indifferently in untreated and both UV1- and
UV2- treated cells, showing no relation with the degree of
UV-damage.
To obtain more information on the physiological state of
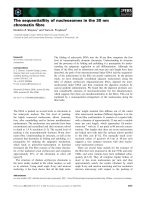
UV-treated cells, protein synthesis was analysed (Fig. 3).
After 1.5 h of incubation with [
35
S]methionine, UV1-treated
cells synthesized less protein than untreated cells. Then,
both untreated and UV1-treated cells reached a maximal
incorporation of about 1.5 nmol of [
35
S]methionine per lg
of protein. As expected, no [
35
S]methionine incorporation in
proteins for UV2-treated cells was detected.
Glucose metabolism under different aeration conditions
The capacity of E. coli cells to metabolize glucose was
investigated in whole cells using
13
C-NMR spectroscopy.
13
C-NMR studies were performed in untreated and UV-
treated cells incubated for 4 h in aerobic and anaerobic
conditions and the concentrations of fermentative products
were measured by enzymatic assays. Results with enriched
[1-
13
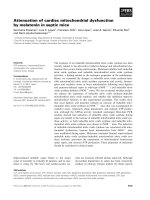
C]glucose are shown in Fig. 4. In anaerobic conditions
for untreated and UV1-treated cells, a similar NMR
spectrum was obtained. Acetate (A), lactate (L) and ethanol
(E) were the main products formed, at levels of about 20, 90
and 10 mol per 100 mol of metabolized glucose, respectively.
However, for UV2-treated cells, less glucose was consumed,
a lower concentration of lactate and acetate was observed
and no ethanol was detected (Fig. 4). The fact that ethanol is
not detected in UV2-treated cells could be explained by the
reduced glucose consumption or most probably by the
incapacity of these cells to synthesize proteins. In anaerobic
conditions, only cells that can synthesize the pyruvate
formate lyase de novo can form ethanol [26]. In aerobic
conditions, acetate was the only product detected in cellular
extracts, the concentration for untreated and UV1-treated
cells being about 90 mol per 100 mol of metabolized glucose.
For UV2-treated cells, 70 mol of acetate per 100 mol of
metabolized glucose were detected.
In E. coli, glucose is metabolized via the EM and PP
pathways [27,28]. In order to determine whether UV-treated
cells incubated in different aeration conditions were able to
modify their metabolic flux of glucose, the activities of the
EM and PP pathways were studied. Glucose metabolism
through these two pathways was quantified separately by
using glucose substrates with a
13
C label at different carbon
atoms. An easy and versatile method to determinate the
acetate concentration by NMR after incubation with
[6-
13
C]glucose or [1-
13
C]glucose was used to quantify
separately the EM and PP competing pathway contribution.
If glucose labelled isotopically either in C1 or C6 positions is
added to bacterial suspensions, the amount of label
introduced in acetate C2 will depend on the activity of
the PP pathway. In fact, when [1-
13
C]glucose is used as the
carbon source, part of the
13
C label is lost as CO
2
in the
phosphogluconate dehydrogenase step of the PP pathway,
whereas the other part of the
13
C label is incorporated into
acetate C2 via the EM pathway. On the other hand, when
[6-
13
C]glucose is used as the carbon source, all the
13
Clabel
is incorporated into acetate C2 via the EM and PP pathways
[29]. Even though the described procedure is a simplified
flux estimation because other possible CO
2
-liberating reac-
tions are neglected [30] it allowed a first estimation of the
flux differences between untreated and UV-treated cells. For
untreated and both UV1- and UV2-treated cells, the relative
activities of the EM and PP pathways in anaerobic
conditions were about 91% and 9%, respectively (Table 1).
In untreated cells, the initial rate of glucose consumption
was 7 nmol per lg protein per min and a similar rate was
observed in UV1- and UV2-treated cells. Considering
aerobic conditions, only untreated and UV1-treated cells
had the capacity to modify metabolic flux through both
pathways, the relative activity of the EM and PP pathways
Fig. 3. Protein synthesis. Protein synthesis of untreated cells (
•
),
UV1-treated cells (j), UV2-treated cells (m), detected by incorpor-
ation of [
35
S]methionine. The detection limit of this method was
0.01 nmol of [
35
S]methionine per g protein corresponding to protein
synthesis of about 10
6
CFUÆml
)1
(1% of the initial number of cells).
Fig. 4.
13
C-NMR spectra.
13
C-NMR spectra of untreated, UV1- and
UV2-treated cells after 4 h of incubation with [1–
13
C] glucose in
anaerobic conditions. The glucose anomers, a and b are visible as well
as three end products of glucose metabolism, acetate (A); lactate (L)
and ethanol (E).
Ó FEBS 2003 Are nonculturable E. coli cells alive or dead? (Eur. J. Biochem. 270) 2693
being 44% and 56% (Table 1), respectively. In these
cells, an increase of at least fourfold in the rate of glucose
consumption was observed (about 30 nmol per lg protein
per min). In contrast, UV2-treated cells were unable to
respond to variations in aeration conditions. These cells
showed a similar metabolic flux through both pathways
and rate of glucose consumption in aerobic and anaerobic
conditions. In this study, the flux estimation was deter-
mined by MNR in cells incubated in nongrowing condi-
tions. Nevertheless, the same method applied to E. coli
grown anaerobically gives similar flux values (22% by the
PP pathway) [31]. Using more comprehensive methods
such as GC-MS, it has been confirmed recently, that in
growing cells, the oxidative PP pathway is still active
under anaerobic conditions and decreases with decreasing
oxygen availability [32].
As described above, during glucose incorporation in
nongrowth conditions, peroxide was generated in cells. It
was expected that both the EM and PP pathway activity
would be affected by peroxide, which freely diffuses into
cells, harming cell proteins. Furthermore, in vitro assays
showed that peroxide inhibited the activity of several E. coli
K-12 enzymes such as phosphogluconate dehydrogenase,
alcohol dehydrogenase, lactate dehydrogenase and acetate
kinase (data not shown). However, we obtained the same
flux through the EM and PP pathways in experiments where
peroxide was degraded or not through the addition of
exogenous catalase. This result, along with the evidence of
retention of protein synthesis described above, might be
indicative of preservation in UV1-treated nonculturable
cells of intracellular catalase activity, which prevents intra-
cellular damage to cells. Indeed, a homeostatic regulation of
intracellular hydrogen peroxide concentration by the pro-
duction of intracellular catalase, but in culturable E. coli
cells, has already been observed [33].
Discussion
Cells were defined operationally as alive or dead depending
on the method used to determine cell viability. For example,
using the capacity of cell division or elongation as a criterion
for bacterial life, cells treated with UV1 and UV2 doses
could be diagnosed as dead cells. In contrast, if the capacity
to transport or metabolize glucose is used as a criterion of
bacterial life, cells treated with UV1 and UV2 doses could
be diagnosed as living cells. This study suggests that global
information on intracellular stability (protein synthesis,
metabolic flux) is needed to define with less ambiguity the
physiological state of nonculturable cells. However, in the
absence of consensus on the definition of bacteria death
(independent of culturability), UV1-treated cells could be
diagnosed as simply in a metabolically active state and not
as living cells. After addition of nutrients, nonculturable
cells obtained by UV1 irradiation maintained the capacity
to synthesize proteins and peptidoglycan. They also retained
both a high level of glucose transport and the capacity to
metabolize glucose at the same rates as those of nontreated
cells. Moreover, UV1-treated cells retained the capacity to
modify their metabolic flux through the EM and PP
pathways after variation of aeration conditions. On the
other hand, nonculturable cells obtained by irradiation with
the UV2 dose were clearly in a metabolically inactive state.
UV2-treated cells not only showed a gradual loss of cell
integrity, they also lost the capacity to respond to nutrient
addition by cell elongation or protein synthesis and the
capacity to modify their metabolic flux in glucose metabo-
lism after variation of aeration conditions. UV2-treated cells
retained only residual metabolic activity and showed several
levels of metabolic imbalance.
To clarify the medical significance (when pathogenic) of
bacteria that lose culturability, further studies should be
performed to examine the persistence of these active cells
and their capacity to repair their damage, to produce
important metabolites (e.g. toxins) and restart cell division.
Acknowledgement
Aquabiolab is supported by Anjou Recherche/Vivendi Water. Aqu-
abiolab supported the PhD scholarship of Andrea Villarino. We
acknowledge the technical assistance of Marie Christine Wagner,
Analytic and Preparative Cytometry Service, Institut Pasteur.
References
1. Lazarova, V., Savoye, P., Janex, M.L., Blatchley, E.R. & Pom-
mepuy, M. (1999) Advanced wastewater disinfection technologies:
State of the art and perspectives. Water Sci. Technol. 40, 203–213.
2. Russell, A.D. (1998) Preservation and Sterilization. In Principles
and Practice of Disinfection (Rusell, A.D., Hugo, W.B. & Ayliffe,
G.A.J., eds) pp. 630. Blackwell Science, Oxford.
3. Sommer, R., Haider, T., Cabaj, A., Pribil, W. & Lhotsky, M.
(1998) Time dose reciprocity in UV disinfection of water. Water
Sci. Technol. 38, 145–150.
4. Bruch, C.W. & Bruch, M.K. (1971) Sterilization. In Husa’s
Pharmaceutical Dispensing (Martin, E.W., ed.), pp. 592–623.
Mack Publishing, Easton, PA.
5. Postgate, J.R., Crumpton, J.E. & Hunter, J.R. (1961) The
measurement of bacteria viabilities by slide culture. J. General
Microbiol. 24, 15–24.
6. Wilber, L.A. & Oliver, J.D. (2000) Ultraviolet light induces the
VBNC state in Salmonella typhimurium and Escherichia coli.
Abstr. Gen. Meeting Am. Soc. Microbiol.,p.400.LosAngeles,CA,
USA.
7. Muela, A., Garcia-Bringas, J.M., Arana, I. & Barcina, I. (2000)
The effect of simulated solar radiation on Escherichia coli:the
relative roles of UV-B, UV-A, and photosynthetically active
radiation. Microb. Ecol. 39, 65–71.
8. Caro,A.,Got,P.,Lesne,J.,Binard,S.&Baleux,B.(1999)Via-
bility and virulence of experimentally stressed nonculturable Sal-
monella typhimurium. Appl. Environ. Microbiol. 65, 3229–3232.
9. Villarino, A., Bouvet, O.M.M., Regnault, B., Martin-Delautre, S.
& Grimont, P.A.D. (2000) Exploring the frontier between life and
death in Escherichia coli: Evaluation of different viability markers
in live and heat- or UV-killed cells. Res. Microbiol. 151, 755–768.
Table 1. Relative activity (%) of the Embden–Meyerhof (EM) and
pentose phosphate (PP) pathways of E. coli K-12 cells. Results are the
mean of at least two independent experiments.
Anaerobic Aerobic
EM PP EM PP
Untreated cells 90 ± 5 10 ± 5 43 ± 2 57 ± 2
UV1-treated cells 94 ± 5 6 ± 4 46 ± 6 54 ± 2
UV2-treated cells 88 ± 12 12 ± 12 79 ± 9 21 ± 9
2694 A. Villarino et al. (Eur. J. Biochem. 270) Ó FEBS 2003
10. Choi, J.W., Sherr, E.B. & Sherr, B.F. (1996) Relation between
presence-absence of a visible nucleoid and metabolic activity in
bacterioplankton cells. Limnol. Oceanogr. 41, 1161–1168.
11. Kell, D.B., Kaprelyants, A.S., Weichart, D.H., Harwood, C.R. &
Barer, M.R. (1998) Viability and activity in readily culturable
bacteria: a review and discussion of the practical issues. Antonie
Leeuwenhoek 73, 169–187.
12. Appleyard, R. & K. (1954) Segregation of new lysogenic types
during growth of a doubly lysogenic strain derived from Escher-
ichia coli K12. Genetics 39, 440–452.
13. Maniatis, T., Fritsch, E.F. & Sambrook, J. (1982) Molecular
Cloning: A laboratory manual. Cold Spring Harbor Laboratory
Press, Cold Spring Harbor, NY.
14. Kogure, K., Simidu, U. & Taga, N. (1979) A tentative direct
microscopic method for counting living marine bacteria. Can. J.
Microbiol. 25, 415–420.
15. Yokomaku, D., Yamaguchi, N. & Nasu, M. (2000) Improved
direct viable count procedure for quantitative estimation of bac-
terial viability in freshwater environments. Appl. Environ. Micro-
biol. 66, 5544–5548.
16. Regnault, B., Martin-Delautre, S., Lejay-Collin, M., Lefevre, M.
& Grimont, P.A.D. (2000) Oligonucleotide probe for the visuali-
zation of Escherichia coli/Escherichia fergusonii cells by in situ
hybridization: Specificity and potential applications. Res. Micro-
biol. 151, 521–533.
17. Amann, R.I., Binder, B.J., Olson, R.J., Chisholm, S.W., Devere-
ux, R. & Stahl, D.A. (1990) Combination of 16S ribosomal RNA-
targeted oligonucleotide probes with flow cytometry for analyzing
mixed microbial populations. Appl. Environ. Microbiol. 56,
1919–1925.
18. Davey, H.M. & Kell, D.B. (1996) Flow cytometry and cell sorting
of heterogeneous microbial populations: The importance of single-
cell analyses. Microbiol. Rev. 60, 641–696.
19. Rager, M N., Binet, M. & Bouvet, O.M.M. (1999)
31
Pand
13
C
nuclear magnetic resonance studies of metabolic pathways in
Pasteurella multocida: Characterization of a new mannitol-
producing metabolic pathway. Eur. J. Biochem. 263, 695–701.
20. Miller, R.V., Jeffrey, W., Mitchell, D. & Elasri, M. (1999) Bac-
terial responses to ultraviolet light. ASM News 56, 535–541.
21. Holtje, J.V. (1995) From growth to autolysis: the murein hydro-
lases in Escherichia coli. Arch. Microbiol. 164, 243–254.
22. Jolliffe, L.K., Doyle, R.J. & Streips, U.N. (1981) The energized
membrane and cellular autolysis in Bacillus subtilis. Cell 25,
753–764.
23. Hammes, W., Schleifer, K.H. & Kandler, O. (1973) Mode of
action of glycine on the biosynthesis of peptidoglycan. J. Bacteriol.
116, 1029–1053.
24. Messner, K.R. & Imlay, J.A. (1999) The identification of primary
sites of superoxide and hydrogen peroxide formation in the
aerobic respiratory chain and sulfite reductase complex of
Escherichia coli. J. Biol. Chem. 274, 10119–10128.
25. Hoshino, N., Kimura, T., Yamaji, A. & Ando, T. (1999) Damage
to the cytoplasmic membrane of Escherichia coli by catechin-
copper (II) complexes. Free Rad. Biol. Med. 27, 1245–1250.
26. Gottschalk, G., ed. (1985) Bacterial Metabolism. Springer-Verlag,
New York.
27. Neidhardt, F.C., Ingraham, J.L. & Schaechter, M. (1990) Bio-
synthesis and fueling. In Physiology of the Bacterial Cell: a
Molecular Approach (Neidhardt, F.C., Ingraham, J.L. &
Schaechter, M., eds), pp. 133–173. Sinauer Associates, Inc., MA.
28. Nystrom, T., Larsson, C. & Gustafsson, L. (1996) Bacterial
defense against aging: Role of the Escherichia coli ArcA regulator
in gene expression, readjusted energy flux and survival during
stasis. EMBO J. 15, 3219–3228.
29. Bouvet, O.M.M. & Rager, M N. (2000) Sugar transport and
metabolism in fermentative bacteria. In NMR in Microbiology:
Theory and Applications (Barbotin, J N. & Portais, J C., eds), pp.
349–361. Horizon Scientific Press, England.
30. Sauer. U., Lasko, D.R., Fiaux, J., Hochuli, M., Glaser, R., Szy-
persky, T., Wu
¨
thrich, K. & Bailey, J.E. (1999) Metabolic flux ratio
analysis of genetic and environmental modulations of Escherichia
coli central carbon metabolism. J. Bacteriol. 181, 6679–6688.
31. Ogino, T., Arata, Y. & Fujiwara, S. (1980) Proton correlation
nuclear magnetic resonance study of metabolic regulations and
pyruvate transport in anaerobic Escherichia coli cells. Biochemistry
19, 3684–3691.
32. Fisher, E. & Sauer, U. (2003) Metabolic flux profiling of
Escherichia coli mutants in central carbon metabolism using
GC-MS. Eur. J. Biochem. 270, 880–891.
33. Gonzalez-Flecha, B. & Demple, B. (1997) Homeostatic regulation
of intracellular hydrogen peroxide concentration in aerobically
growing Escherichia coli. J. Bacteriol. 179, 382–388.
Ó FEBS 2003 Are nonculturable E. coli cells alive or dead? (Eur. J. Biochem. 270) 2695