Báo cáo khoa học: The effect of ST2 gene product on anchorage-independent growth of a glioblastoma cell line, T98G doc
Bạn đang xem bản rút gọn của tài liệu. Xem và tải ngay bản đầy đủ của tài liệu tại đây (278.93 KB, 8 trang )
The effect of ST2 gene product on anchorage-independent growth
of a glioblastoma cell line, T98G
Yasushi Haga
1
, Ken Yanagisawa
2
, Hiromi Ohto-Ozaki
2
, Shin-ichi Tominaga
2
, Toshio Masuzawa
1
and Hiroyuki Iwahana
2
1
Department of Surgical Neurology and
2
Department of Biochemistry, Jichi Medical School, Minamikawachi-machi,
Kawachi-gun, Tochigi, Japan
The ST2 gene, which is specifically induced by growth sti-
mulation in fibroblasts, encodes interleukin-1 receptor-rela-
ted proteins and is widely expressed in hematopoietic, helper
T, and various cancer cells. However, the physiological as
well as pathological functions of the ST2 gene products are
not yet fully understood. In this study, we analyzed the
expression of the ST2 gene in human glioma cell lines and
human brain tumor samples with real-time polymerase
chain reaction method, the results of which revealed that the
expression level of the ST2 gene in glioma cell lines and
glioblastoma samples is significantly lower than that in a
fibroblastic cell line, TM12, and benign brain tumors, sug-
gesting the reverse relationship between malignancy and ST2
expression. As we could not detect the soluble ST2 protein
in the culture fluid of the T98G glioblastic cell line by
ELISA, we established stable transformants of T98G that
continuously produce and secrete the ST2 protein, in order
to study the effect of the ST2 protein on malignancy.
Although we could not detect a remarkable difference in
proliferation between transformants and control cells in
conventional tissue culture dishes, the efficiency of colony
formation in soft agar was significantly decreased in the
case of cells that continuously produce the ST2 protein.
Furthermore, inhibition of colony formation in soft agar
was observed in wild-type T98G cells when purified soluble
ST2 protein was added to the culture, in a dose-dependent
manner. Taken together, the results suggest that the
expression of ST2 suppressed the anchorage-independent
growth and malignancy.
Keywords: ST2; glioblastoma; anchorage-independent
growth; IL-1 receptor family; malignancy.
The ST2 gene, also known as T1, Fit-1, and DER4, was
originally found as a gene induced by growth stimulation
(hence the name ST2) in a murine fibroblastic cell line,
BALB/c-3T3 [1–6]. The subsequent structural analysis of
the ST2 protein, deduced from ST2 cDNA, revealed that it
was a soluble secreted protein very similar to the extracel-
lular portion of the interleukin (IL)-1 receptor [2]. To date,
we have identified at least three ST2 gene products,
generated by alternative splicing mechanisms. These prod-
ucts are ST2 (soluble secreted form), ST2L (transmembrane
receptor form), and ST2V (variant form of ST2) [2,7,8]. The
gene is also interesting in that it has two distinct noncoding
exon 1 regions and consequently two distinct promoters,
which are far apart from each other (for example, they are
25.4 kb apart in the case of human genes) [9]. Differential
usage of the two distinct promoters by cell type may be a
special means of regulation [10]. However, although the
structures of the ST2 gene products are very similar to that
of IL-1 receptor (IL-1R), these products never bind to
IL-1a,IL-1b, or receptor antagonist [11]. The ligands for the
receptor molecule are still unknown, thus leaving it as an
orphan receptor system.
A research breakthrough revealed that the ST2 gene
products were specifically expressed in type 2 helper T (Th2)
lymphocytes and not in Th1 cells [11–13]. The evidence of
suppression in eosinophilia by administrating anti-ST2 Ig or
modified soluble ST2 protein in asthma model mice [13] was
followed by discovery of the fact that the ST2 concentration
in serum of patients suffering from asthma attacks was
significantly higher than that in controls [14,15]. Elevated
serum ST2 was also detected in various autoimmune
diseases, such as systemic lupus erythematosus [16], suggest-
ing a significant relationship between ST2 and immunolo-
gical reactions. However, there is accumulating evidence that
the ST2 gene is expressed by various cancer cell lines, such as
those of hematological neoplasms [11,17,18], breast cancer
[19], and colon cancer (Tago, K. & Tominaga, S., unpub-
lished results). Furthermore, elevated ST2 protein concen-
tration in pleural effusions of lung cancer imply a
relationship between cancer and immunological responses
[20]. Therefore, the investigation of ST2 should be widely
based on both immunology and growth regulation.
Correspondence to S i. Tominaga, Department of Biochemistry,
Jichi Medical School, 3311-1 Yakushiji, Minamikawachi-machi,
Kawachi-gun, Tochigi 329-0498, Japan.
Fax: + 81 285 44 2158, Tel.: + 81 285 58 7323,
E-mail:
Abbreviations: IL, interleukin; MEM, minimum essential medium;
fetal bovine serum, fetal bovine serum; DMEM, Dulbecco’s modified
Eagle’s medium; GAPDH, glyceraldehyde-3-phosphate
dehydrogenase; ELISA, enzyme-linked immunosorbent assay;
HRP, horseradish peroxidase; FITC, fluorescein isothiocyanate;
TNF, tumor necrosis factor.
(Received 4 September 2002, revised 12 November 2002,
accepted 20 November 2002)
Eur. J. Biochem. 270, 163–170 (2003) Ó FEBS 2003 doi:10.1046/j.1432-1033.2003.03377.x
Although the brain has been considered to be an
immunologically privileged site, there is accumulating
evidence that the glia and brain tumors express several
cytokines [21–28]. Among them, IL-1 has been shown to
play an important role in the growth of glia [29,30]. The
gene expression of IL-1b andIL-6hasbeenshowninsome
gliomas [24–28]. Up-regulation of IL-1 receptor expression
has been observed in human glioblastoma cell lines after
incubation with glucocorticoid [24]. Furthermore, the serum
IL-1b levels were higher after radiation than those before
treatment in pediatric patients with astrocytoma [25]. The
expression of IL-6, which enhances the activity of natural
killer cells and cytotoxic T lymphocytes, has also been
shown to be induced in some glioblastoma cell lines after
treatment with IL-1b [28]. Taken together, cytokines and
their receptors are speculated to be regulating cell prolifer-
ation in the brain, but the mechanisms of their action are
still unclear.
The expression of cytokines and their receptors in the
brain prompted us to investigate ST2 expression and its
possible implications in brain tumors. Here we report the
mode of expression of the ST2 gene in malignant glioma cell
lines and brain tumor samples. Stable transformants of the
glioblastoma cell line T98G with cDNA for the ST2 protein
revealed that ST2 suppresses anchorage-independent
growth of the tumor cells in soft agar.
Materials and methods
Cell culture
T98G, A172, U251, U373Mg and T430 cells were derived
from human glioblastoma. Onda 11 cells were derived from
human anaplastic astrocytoma.
T98G cells (from T. Kasahara, Kyoritsu College of
Pharmacy, Tokyo, Japan) were cultured in minimum
essential medium (MEM) with 10% fetal bovine serum
and 1 m
M
sodium pyruvate. A172 and U251 cells (Japanese
Cancer Research Resources Bank, Tokyo, Japan)
were cultured in Dulbecco’s modified Eagle medium
(DMEM) with 10% fetal bovine serum. Onda11 cells (from
T. Kumanishi, Brain Research Institute, Niigata University,
Niigata, Japan) and U373Mg and T430 cells (from
T. Kasahara) were cultured in RPMI 1640 with 10% fetal
bovine serum. TM12 cells (from S. Yonehara, Kyoto
University, Japan) were cultured in DMEM with 10% fetal
bovine serum.
TM12 human fibroblastic cells were stimulated to
proliferate by changing the medium to DMEM with 10%
fetal bovine serum, after the cells were incubated in DMEM
with 0.5% fetal bovine serum for 48 h at 37 °Cin5%CO
2
in air, and total RNAs were extracted at 10 h after
stimulation for RT-PCR analysis.
Specimens of brain tumors
Tumor specimens were obtained from eight patients
suffering from meningioma and eight patients with gliob-
lastoma. The study protocol was ethically approved by our
Institutional Review Board for Human Studies, and
informed consent was obtained from all subjects before
enrollment. Histologically, all meningiomas consisted of
meningothelial meningiomas. The histological diagnosis
was confirmed by pathologists using portions of the
original tumor tissue.
RT-PCR
To synthesize the first-strand cDNA, 5 lgoftotalRNA
extracted from cells using ISOGEN (Nippon Gene, Tokyo,
Japan) was denatured with 4 l
M
of random hexamer
(Takara, Tokyo, Japan) at 70 °C for 10 min and immedi-
ately chilled on ice. Next, the denatured RNA was reverse-
transcribed with 10 l
M
each dNTPs, 200 U RNase
inhibitor (Toyobo, Osaka, Japan), and 200 U M-MLV
Reverse Transcriptase (Gibco BRL, Grand Island, NY,
USA) in a buffer containing 50 m
M
Tris/HCl (pH 8.3),
75 m
M
KCl, 3 m
M
MgCl
2
,and10m
M
dithiothreitol in a
total volume of 25 lLat37°C for 60 min. Then, the
reaction was terminated at 70 °Cfor10min.
PCR amplification was carried out using 1 lLofthe
first-strand cDNA as a template in a total volume of
20 lL containing 0.5 l
M
of each primer, 200 l
M
each of
dNTPs, 2.5 m
M
MgCl
2
,and0.1lL AmpliTaq Gold
TM
DNA Polymerase (Roche, Branchburg, NJ, USA) in the
buffer recommended by the manufacturer. The forward
primer, hST2-582F; 5¢-GACGGCGACCAGGTCCTT-3¢,
and the reverse primer, hST2-649R; 5¢-GGGCTCCG
ATTACTGGAAACA-3¢, were both derived from the
common region of human ST2 and ST2L [9,17]. After
treatment at 94 °C for 10 min, 30 cycles of 94 °Cfor
1min, 60°C for 1 min, and 72 °Cfor1minwere
performed in the DNA Thermal Cycler 480 (Takara).
The last polymerization step at 72 °C was extended to
10 min.
Real-time PCR
RT- and real-time PCR were carried out in an ABI Prism
7700 Sequence Detection System (Perkin-Elmer, Brauch-
burg, NJ, USA) using TaqMan
TM
Gold RT-PCR Kit with
controls (Perkin-Elmer) according to the manufacturer’s
protocol. The same primer set as described above, hST2-
528F and hST2-649R, and TaqMan probe, hST2C-TM1
[5¢-(Fam)-CGGTCAAGGATGAGCAAGGCTTTTCT-
(Tamra)-3¢] was used for amplification. Glyceraldehyde-
3-phosphate dehydrogenase (GAPDH) was used as an
internal control, and total RNA extracted from stimulated
TM12 cells was used as a positive control.
RT-PCR with Southern blotting analysis for detection
of promoter usage
The denatured RNA (5 lg) was reverse-transcribed with
10 l
M
each of dNTPs, 200 U RNase inhibitor (Toyobo),
and 200 U SuperScript
TM
II Reverse Transcriptase (Gibco
BRL) in a buffer containing 50 m
M
Tris/HCl (pH 8.3),
75 m
M
KCl, 3 m
M
MgCl
2
,and10m
M
dithiothreitol in a
total volume of 25 lLat40°C for 60 min. The first-strand
cDNA synthesized was precipitated by ethanol and dis-
solved in 10 lL of distilled water.
PCR amplification was carried out using 1 lL of the first-
strand cDNA as a template in a total volume of 20 lL
containing 0.4 l
M
of each primer for ST2 (oBC001,
164 Y. Haga et al. (Eur. J. Biochem. 270) Ó FEBS 2003
5¢-GAGGAATTCGCTTTCTGAGTTGTGAAACTGT
GGGC-3¢ or oBC009, 5¢-TCACTGACTCGAGGTTCAT
CCCCTCTGTCTTTCAG-3¢, and oBC010, 5¢-CTCTTG
GATCCACACTCCATTCTGCTTACACTTGC-3¢)or
ST2L (oBC001 or oBC009, and oBC011, 5¢-TCAAA
CTCGGATCCCTTTGCACATCACAGCAGGCA-3¢),
200 l
M
each of dNTPs, and 0.4 lL50· Advantage
cDNA Polymerase Mix (Clontech, Palo Alto, CA,
USA) in the buffer recommended by the manufacturer.
At first, the denaturation was performed at 95 °Cfor
1 min, and then 30 cycles of 94 °Cfor1minand70°C
for 3 min were carried out in the DNA Thermal Cycler
480 (Takara). The last polymerization at 70 °Cwas
extended to 5 min.
Southern blotting analysis was performed using DIG-
High Prime DNA Labeling and Detection Starter Kit II
(Roche, Mannheim, Germany) according to the manufac-
turer’s protocol. Five microliters of the PCR products was
separated by electrophoresis on a 1% (w/v) agarose gel and
transferred onto a nylon membrane (Hybond N
+
,Amer-
sham Pharmacia Biotech, Uppsala, Sweden). A 565-bp
fragment, hST2EPv, which was excised from the human
ST2 cDNA with EcoRI (Toyobo) and PvuII (Toyobo), was
used as a probe. Human leukemic cell line, UT-7, was used
as a positive control [10].
Isolation of stable transformants with human ST2
The entire coding region of human ST2 (hST2) cDNA was
subcloned into the pEF-BOS expression vector [17,18]. The
pEF-BOS vector containing hST2 cDNA (pEF-BOS-
ST2H) was introduced into T98G cells with pEF-BOS
vector containing the blasticidin resistance gene [9] for stable
transformation using Lipofectamine (Gibco BRL) accord-
ing to the manufacturer’s protocol. The transfected cells
were isolated in the presence of 3 lgÆmL
)1
blasticidin S
(Kaken Seiyaku, Tokyo, Japan). Among 91 blasticidin-
resistant clones, we could obtain only four clones that
expressed enough of the ST2 protein to be detectable by
enzyme linked immunosorbent assay (ELISA). Genomic
Southern blotting analysis was performed to confirm the
individuality of each clone.
ELISA
The concentration of the hST2 protein in the cell culture
supernatant was measured by the sandwich ELISA [14].
Microtiter plates containing 96 wells were coated with
1.75 lg per well of anti-human ST2 monoclonal Ig, FB9.
One hundred microliters of the supernatant from each of
the cell lines was added to the wells (run in duplicate), and
the wells were kept at room temperature for 1 h. After
washing with phosphate-buffered saline (NaCl/P
i
) con-
taining 0.05% (w/v) Tween 20, 100 lL of biotinylated
2A5 in NaCl/P
i
containing 0.1% (w/v) BSA was added to
each well, and the resulting mixtures were kept for 1 h at
room temperature. After washing, streptavidin–horse
radish peroxidase (HRP) containing solution was added
to the wells, and the plates were kept at room temperature
for 30 min. Finally, 140 lLof10m
M
o-phenylenediam-
ine-0.01% (v/v) H
2
O
2
in 100 m
M
sodium acetate buffer
(pH 5.0) was added to each well. After 20 min, the
absorbance of each well was determined using a micro-
plate reader (ImmunoMini NJ2300, Inter Medical, Tokyo,
Japan) at a wavelength of 450 nm against a reference
wavelength of 620 nm.
Production and purification of recombinant human ST2
protein
The pEF-BOS-ST2H was transfected into HEK293 cells
(from K. Tago, Jichi Medical School, Tochigi, Japan) as
described previously [11]. Next, the recombinant hST2
protein was purified from cell culture supernatant of
transfected HEK293 cells through a heparin-agarose col-
umn [11]. The final preparation of purified hST2 protein
showed a single band in silver staining after SDS/PAGE.
The hST2 concentration was measured by a sandwich
ELISA procedure [14].
Flow cytometry to assess binding of human ST2
protein to T98G cells
The purified hST2 protein was labeled with fluorescein
isothiocyanate (FITC, Molecular Probes, Eugene, OR,
USA) according to the manufacturer’s protocol. T98G cells
were washed with NaCl/P
i
containing 1% (w/v) BSA and
resuspended in 50 lLofNaCl/P
i
containing FITC-labeled
hST2 protein. Then the cells were left in the dark for 30 min
at room temperature. After being washed with NaCl/P
i
containing 1% (w/v) BSA, the cells were analyzed by flow
cytometry with a FACScan (Becton-Dickinson, Franklin
Lakes, NJ, USA). Raji cells were used as a negative control,
and RPMI 8226 cells were used as a positive control as
described previously [11].
Colony formation assay in soft agar
First, 0.8 mL of MEM containing 0.5% Agar Purified (BD
Diagnostic Systems, Sparks, MD, USA) and 10% (v/v) fetal
bovine serum was poured into each well of 12-well plates.
Then, the layer was covered with cell suspension (6 · 10
2
cells) in 1.2 mL of MEM containing 0.3% (w/v) agar and
10% (v/v) fetal bovine serum. Finally, the layer of MEM-
0.3% agar containing the cells was further covered with
1 mL of MEM containing 10% (v/v) fetal bovine serum.
Medium was exchanged every 96 h. On day 7 after plating,
the colonies were counted under a microscope.
Statistical analysis
Statistical evaluation of all data was by Student’s t-test.
P < 0.05 was accepted as statistically significant.
Results
Expression of ST2 in brain tumors
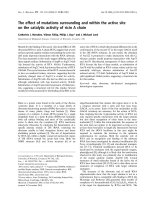
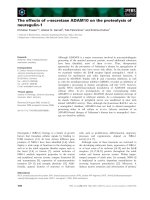
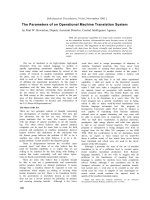
We studied the ST2 gene expression in six cell lines derived
from malignant glioma, A172, U251, U373Mg, T430,
T98G, and Onda11, using RT-PCR (Fig. 1A). The ST2
gene was expressed in all malignant glioma cell lines
examined. However, the expression levels of the ST2 gene
in the tumor cell lines compared to that in stimulated TM12
Ó FEBS 2003 Suppression of anchorage-independent growth by ST2 (Eur. J. Biochem. 270) 165
fibroblastic cells used as a positive control [10], were very
low in real-time PCR (Fig. 1B). The expression of the ST2
gene was lowest in T98G cells.
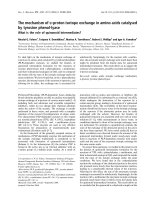
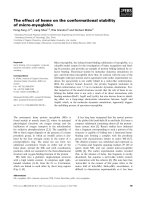
We next analyzed the expression of the ST2 gene in the
specimens of human brain tumors (Fig. 2) and found
expression levels to be higher in meningiomas than in
glioblastomas. Statistically, there was no significant dif-
ference between the quantity of ST2 mRNA in TM12
cells and that in meningiomas. On the other hand, the
expression level of the ST2 gene in glioblastomas was
significantly lower than that in TM12 cells and in menin-
giomas.
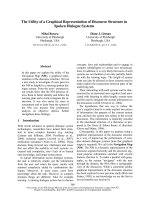
Promoter usage in human glioma cell lines
Four primers, described previously [10], were used to detect
transcripts of the human ST2 gene. The primer oBC001
corresponds to the distal exon 1a, and oBC009 corresponds
to the proximal exon 1b. The reverse primers, oBC010 and
oBC011, correspond to the unique 3¢-regions of cDNA for
hST2 and hST2L, respectively. RT-PCR with Southern
blotting analysis was carried out using 5 lgoftotalRNA
extracted from each human glioma cell line. As shown in
Fig. 3A, a DNA fragment of 1237 bp corresponding to the
human ST2 mRNA containing proximal exon 1b was
amplified with the primer pair oBC009 and oBC010 in five
of six malignant glioma cell lines. On the other hand, no
DNA fragment was amplified with the primer pairs oBC001
and oBC010, oBC001 and oBC011, or oBC009 and
oBC011 (Fig. 3B–D). These results indicated that the main
promoter for the expression of hST2 in malignant glioma
cell lines resides in the proximal region and, further, that the
transmembrane form of hST2L was not expressed in these
cell lines.
Fig. 1. Real-time quantitative PCR analysis of ST2 gene expression in
glioblastoma cell lines. (A) Real-time-PCR was performed using
primers corresponding to the common region of hST2 and hST2L,
with GAPDH as an internal control. PCR products were separated by
electrophoresis on 5% polyacrylamide gel. Lane 1, TM12; lane 2,
A172; lane 3, U251; lane 4, U373Mg; lane 5, T430; lane 6, T98G; lane
7, Onda11. (B) Relative quantities of ST2 mRNA to TM12 are shown.
All experiments were performed in duplicate and repeated three times.
The amount of the ST2 was normalized to the level of GAPDH. A
normalized ST2 value of TM12 was taken as the standard, and the
final relative quantity of ST2 mRNA was expressed relative to the
standard. Error bars designate the standard deviation.
Fig. 2. Real-time quantitative PCR analysis of ST2 gene expression in
meningiomas and glioblastomas. Distribution of the relative quantity of
ST2 mRNA of brain tumor samples of patients is presented. Total
RNA was prepared from tumor specimens, then real-time PCR was
performed using the TaqMan Gold RT-PCR Kit. The amount of ST2
mRNA was normalized to the level of GAPDH. The value of TM12
cells was taken as the standard, and final relative quantity of ST2
mRNA in meningioma (Mg) and glioblastoma (GB) was expressed
relative to the standard. All experiments were performed in duplicate.
Bars indicate the mean value in each group.
166 Y. Haga et al. (Eur. J. Biochem. 270) Ó FEBS 2003
Introduction of hST2 cDNA into T98G cells
To examine the effects of ST2 on proliferation and
malignancy of brain tumors, we introduced cDNA for
hST2 into the human glioblastoma cell line T98G, which
originally expressed very low levels of hST2. We isolated
four clones (C2.1, C8, C10, and C31) that stably expressed
the hST2 protein. The amount of the hST2 protein in the
culture supernatant was measured by ELISA (Fig. 4). The
hST2 protein was under the detectable level in the super-
natant of wild-type T98G cells. The expression level of the
hST2 protein was the highest in C2.1 and the lowest in C8.
To confirm that each ST2 transfectant was an independ-
ent clone, we performed genomic Southern blotting analy-
sis. Exogenous ST2 was detected in all clones, and the
lengths of the labeled fragments were different from one
another, showing the different integration sites (data not
shown).
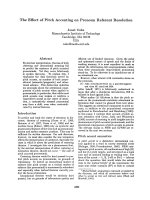
Binding of hST2 protein to T98G cells
In order to analyze the effect of hST2 on T98G cells, the first
important question is whether hST2 binds to the cells.
Therefore, purified hST2 protein was labeled with FITC
and used as a probe for flow cytometric analysis. As
described previously [11], Raji cells hardly shift in the profile
of flow cytometry; in contrast RPMI8226 cells showed a
remarkable shift (Fig. 5A and B). As shown in Fig. 5C, a
marked shift was also observed in T98G, suggesting that
hST2 protein strongly bound to T98G cells.
Effects of hST2 on anchorage-independent growth
of T98G cells
We examined growth properties of the stable transformants
that could be affected by hST2 in an autocrine fashion.
Direct cell counting and WST-1 colorimetric assay were
carried out in conventional culture conditions. In these
studies, we could not draw any significant conclusions about
the effect of ST2 expression on cell proliferation of T98G
(data not shown).
To evaluate the effects of hST2 protein on anchorage-
independent growth, we carried out colony formation assay
using T98G, transfectants with the empty vector, and
transfectants with hST2 cDNA, cultured in soft agar with
MEM containing 10% fetal bovine serum and 1 m
M
pyruvate. On day 7 after seeding in soft agar, 151 ± 16
(mean ± SD), 148 ± 11, 165 ± 22, and 130 ± 6 colonies
per well were observed in control cells, such as T98G, EV-4,
EV-5, and EV-7, respectively. In contrast, 32 ± 11, 70 ± 12,
and 56 ± 22 colonies per well were observed in C2.1, C8,
and C10 clones, respectively. The experiment was repeated
three times, and the results were reproducible. The numbers
of colonies of ST2 transfectants were significantly lower
than those of control cells (Fig. 6A).
The next question is whether this suppressive effect was
caused by the hST2 protein secreted by the transformed
cells to the culture environment or due to an internal
Fig. 3. RT-PCR and Southern blotting analysis of the ST2 transcripts in
human malignant glioma cell lines. RT-PCR was performed using
primers oBC009 and oBC010, which anneal specifically to the exon 1b
and the unique 3¢-regions of cDNA for ST2, respectively. The result of
Southern blotting analysis using primer pair oBC009-oBC010 is shown
(A). Using primer pairs of oBC001-oBC010 (B), oBC001-oBC011 (D),
and oBC009-oBC011 (C), the amplified cDNA was not detected. Lane
1, A172; lane 2, U251; lane 3, U373Mg; lane 4, T430; lane 5, T98G;
lane 6, Onda11; lane 7, UT-7 as a positive control [10]. Arrowheads
and arrows indicate the position of the amplified cDNA for ST2 and
ST2L, respectively.
Fig. 4. Level of the hST2 protein in the supernatant of ST2 trans-
formants measured by ELISA. The sandwich ELISA procedure was
performed as described in Materials and methods. Cell supernatant
was collected after every cell line had grown to confluency. ST2 protein
was detected in the supernatants of C2.1, C8, C10, and C31; however,
that of T98G, EV-4, EV-5, and EV-7 (data not shown) was under
the detectable level. All experiments were performed in duplicate and
repeated three times. Error bars represent the standard deviation.
Ó FEBS 2003 Suppression of anchorage-independent growth by ST2 (Eur. J. Biochem. 270) 167
effect in the cell as a result of the integration of the hST2
gene. Wild-type T98G cells were suspended in 1.2 mL of
MEM containing 0.3% agar and 10% fetal bovine
serum, and the cell suspension in MEM/0.3% agar was
overlaid above the layer of MEM/0.5% agar prepared in
each well beforehand. Then, 1 mL MEM containing
various amounts of hST2 protein was added. As shown
in Fig. 6B, on day 7 after plating, the inhibition of
colony formation in soft agar was observed to be dose-
dependent. The numbers of colonies of T98G cultured in
the medium containing 10 ngÆmL
)1
and 50 ngÆmL
)1
of
hST2 protein were significantly lower than those of T98G
cultured in the medium without hST2. The assay was
performed three times with reproducible results. The
experiments suggest a significant possibility that the
hST2 protein suppressed anchorage-independent growth
of T98G glioblastoma cells. Considered together with
the result of the binding experiment described above, the
effect was judged to be conveyed from outside of the
cells.
Discussion
The ST2 gene was revealed to be expressed in malignant
glioma cell lines as in the case of fibroblast (Fig. 1), and
usage of the proximal promoter to express the ST2 gene was
also common among these cell species (Fig. 3A) [10].
Because of the accumulated knowledge about the expres-
sion of the ST2 gene in fibroblasts, we carried out our study
using a TM12 human fibroblastic cell line as a control.
Higher expression of ST2 mRNA in benign tumors
compared to the scarce expression in malignant tumors
led us to construct a working hypothesis that induction of
ST2 is against malignancy. In fact, there are several
reports suggesting an antiproliferative action of cytokines.
Todo et al. have reported that the addition of recombin-
ant human IL-6 to meningioma cell cultures caused a
dose-dependent inhibition of basal DNA synthesis, and
the secretion of IL-6 by meningioma cells was powerfully
induced by both TNF-a and IL-1b [23]. The addition of
IL-1b has been reported to down-regulate IL-1R expres-
sion in a glioblastoma cell line [24]. Furthermore, the level
of IL-1b in the sera of pediatric patients with glioma has
been shown to increase after radiotherapy [25]. It should
be noted that tumor samples from patients are certainly
nonhomogeneous, containing other cell species. Conse-
quently, the expression of the ST2 gene in tumor samples
itself does not imply functional relevance of ST2 in
glioma. Therefore, the experiments using cell lines are of
importance.
To investigate the effect of ST2 on cell growth, we
established stable transformants that constitutively express
and secrete the human ST2 protein. Direct cell counting
and WST-1 colorimetric assay resulted in no detection
of a significant difference between the growth of the
ST2-transformants and control cells under conventional
culture conditions. However, a remarkable difference was
reproducibly observed in the colony formation in soft
agar plates. The ST2 transformants showed significantly
lower numbers in colony formation compared to wild-
type T98G cells as well as transformants with an empty
vector (Fig. 6A). The intensity of inhibition correlated
well with the concentration of ST2 protein in the culture
supernatant of each cell line, thus corresponding to the
efficiencies of the production of the ST2 protein (Figs 4
and 6A).
Fig. 5. Flow cytometric analysis of T98G cells
with FITC-hST2. Flow cytometric analysis
was performed on Raji (A) as a negative
control, RPMI8226 (B) as a positive control,
and T98G (C). The filled area corresponds to
the cells treated with FITC-hST2, and the
lucent area corresponds to the cells without
FITC-hST2 treatment.
168 Y. Haga et al. (Eur. J. Biochem. 270) Ó FEBS 2003
One of the possible explanations was that the suppression
was caused by the secreted ST2 protein, which may be at a
relatively high concentration in the microenvironment, via
cell surface attachment, in other words in an autocrine
fashion. By flow cytometric analysis, we confirmed the
binding of exogenous ST2 protein to T98G cells, supporting
the possibility of an autocrine mechanism for the suppres-
sion of colony formation (Fig. 5).
Finally, we confirmed the inhibitory effect of the ST2
protein on colony formation in soft agar by adding
exogenous purified recombinant human ST2 protein to
wild-type T98G cells. The inhibitory effect was dose
dependent and reproducible (Fig. 6B). It should be noted
that the concentration of added ST2 was from 2.5 to
50 ngÆmL
)1
, which is the pathophysiological range of the
ST2 concentration actually detected in sera of patients [14–
16]. In this possible mechanism, soluble ST2 is considered to
function as a ligand attaching to an unknown counter-
receptor on the cell surface. In fact, a recent report showing
an inhibitory effect of ST2 on Toll-like receptor 4 expression
suggests the same mechanism [31].
In conclusion, the ST2 protein suppresses anchorage-
independent growth of T98G glioblastoma, suggesting the
protein’s negative effect on malignancy. Further studies are
necessary to reveal the mechanisms of action of the ST2
protein as well as the target molecule of the ST2 protein on
the cell surface to convey the negative signal.
Acknowledgements
We are grateful to Dr H. Higashi of the Institute for Genetic Medicine,
Hokkaido University, for his valuable advice and discussion. We also
thank Mrs R. Izawa and Miss Y. Komine for excellent technical
assistance. This work was supported in part by a grant for the High-
Tech Research Center from the Ministry of Education, Culture, Sports,
Science and Technology of Japan.
References
1. Tominaga, S. (1988) Murine mRNA for the b-subunit of integrin
is increased in BALB/c-3T3 cells entering the G1 phase from the
Go state. FEBS Lett. 238, 315–319.
2. Tominaga, S. (1989) A putative protein of a growth specific cDNA
from BALB/c-3T3 cells is highly similar to the extracellular por-
tion of mouse interleukin 1 receptor. FEBS Lett. 258, 301–304.
3. Werenskiold, A.K., Hoffman, S. & Klemenz, R. (1989) Induction
of a mitogen-responsive gene after the expression of the Ha-ras
oncogene in NIH3T3 fibroblasts. Mol. Cell Biol. 9, 5207–5214.
4. Klemenz, R., Hoffmann, S. & Werenskiold, A.K. (1989) Serum
and oncoprotein-mediated induction of a gene with sequence
similarity to the gene encoding carcinoembryonic antigen. Proc.
NatlAcad.Sci.USA86, 5708–5712.
5. Bergers, G., Reikerstorfer, A., Braselmann, S., Graninger, P. &
Busslinger, M. (1994) Alternative promoter usage of the Fos-
responsive gene Fit-1 generates mRNA isoforms coding for either
secreted or membrane-bound proteins related to the IL-1 receptor.
EMBO J. 13, 1176–1188.
6. Lanahan, A., Williams, J.B., Sanders, L.K. & Nathans, D. (1992)
Growth factor-induced delayed early response gene. Mol. Cell.
Biol. 12, 3919–3929.
7.Yanagisawa,K.,Takagi,T.,Tsukamoto,T.,Tetsuka,T.&
Tominaga, S. (1993) Presence of a novel primary response gene
ST2L, encoding a product highly similar to the interleukin 1
receptor type 1. FEBS Lett. 318, 83–87.
8. Tominaga, S., Kuroiwa, K., Tago, K., Iwahana, H., Yanagisawa,
K. & Komatsu, N. (1999) Presence and expression of a novel
variant form of ST2 gene product in human leukemic cell line
UT-7/GM. Biochem. Biophys. Res. Commun. 264, 14–18.
9.Li,H.,Tago,K.,Io,K.,Kuroiwa,K.,Arai,T.,Iwahana,H.,
Tominaga, S. & Yanagisawa, K. (2000) The cloning and nucleo-
tide sequence of human ST2L cDNA. Genomics 67, 284–290.
10. Iwahana, H., Yanagisawa, K., Ito-Kosaka, A., Kuroiwa, K.,
Tago, K., Komatsu, N., Katashima, R., Itakura, M. & Tominaga,
S. (1999) Different promoter usage and multiple transcription
Fig. 6. Effects of ST2 on colony formation in soft agar. (A) T98G,
EV-4, EV-5, EV-7, C2.1, C8, and C10 cells were suspended in soft agar,
after which the layer of soft agar was covered with MEM containing
10% fetal bovine serum. (B) T98G cells were suspended in soft agar
and subsequently poured into each well. The layer of soft agar was
further covered with MEM containing 10% fetal bovine serum and
indicated amounts of ST2 protein. On day 7 after plating, colonies
were counted under a microscope. Measurements were made from
nine different fields in each well (the area of one field was 4 mm
2
;
magnification, 40 ·). All experiments were performed in triplicate. The
data represent the mean of total colonies per well. Error bars represent
the standard deviation. *P < 0.02 vs. control; **P < 0.005 vs. T98G;
***P < 0.001 vs. T98G.
Ó FEBS 2003 Suppression of anchorage-independent growth by ST2 (Eur. J. Biochem. 270) 169
initiation sites of the interleukin-1 receptor-related human ST2
gene in UT-7 and TM12 cells. Eur. J. Biochem. 264, 397–406.
11. Yanagisawa, K., Naito, Y., Kuroiwa, K., Arai, T., Furukawa, Y.,
Tomizuka,H.,Miura,Y.,Kasahara,T.,Tetsuka,T.&Tominaga,
S. (1997) The expression of ST2 gene in helper T cells and
the binding of ST2 protein to myeloma-derived RPMI8226 cells.
J. Biochem. 121, 95–103.
12. Xu, D., Chan, W.L., Leung, B.P., Huang, F.P., Wheeler, R.,
Pierdrafita,D.,Robinson,J.H.&Liew,F.Y.(1998)Selective
expression of a stable cell surface molecule on type 2 but not type 1
helper T cells. J. Exp. Med. 187, 787–795.
13. Lo
¨
hning, M., Stroemann, A., Coyle, A.J., Grogan, J.L., Lin, S.,
Gutierrez-Ramos, J C., Levinson, D., Radbruch, A. & Kamradt,
T. (1998) T1/ST2 is preferentially expressed on murine Th2 cells,
independent of interleukin 4, interleukin 5, and interleukin 10, and
important for Th2 effector function. Proc. Natl Acad. Sci. USA 95,
6930–6935.
14. Kuroiwa, K., Li, H., Tago, K., Iwahana, H., Yanagisawa, K.,
Komatsu, N., Oshikawa, K., Sugiyama, Y., Arai, T. & Tominaga,
S. (2000) Construction of ELISA system to quantify human ST2
protein in sera of patients. Hybridoma 19, 151–159.
15. Oshikawa, K., Kuroiwa, K., Tago, K., Iwahana, H., Yanagisawa,
K., Ohno, S., Tominaga, S. & Sugiyama, Y. (2001) Elevated
soluble ST2 protein levels in sera of patients with asthma with an
acute exacerbation. Am.J.Respir.Crit.CareMed.164, 277–281.
16. Kuroiwa, K., Arai, T., Okazaki, H., Minota, S. & Tominaga, S.
(2001) Identification of human ST2 protein in the sera of patients
with autoimmune diseases. Biochem. Biophys. Res. Commun. 284,
1104–1108.
17. Tominaga, S., Yokota, T., Yanagisawa, K., Tsukamoto, T.,
Takagi, T. & Tetsuka, T. (1992) Nucleotide sequence of a com-
plementary DNA for human ST2. Biochim. Biophys. Acta 1171,
215–218.
18.Yoshida,K.,Arai,T.,Yokota,T.,Komatsu,N.,Miura,Y.,
Yanagisawa,K.,Tetsuka,T.&Tominaga,S.(1995)Studieson
natural ST2 gene products in the human leukemic cell line UT-7
using monoclonal antihuman ST2 antibodies. Hybridoma 14, 419–
427.
19. Prechtel, D., Harbeck, N., Berger, U., Ho
¨
fler, H. & Werenskiold,
A.K. (2001) Clinical relevance of T1-S, an oncogene-inducible,
secreted glycoprotein of the immunoglobulin superfamily, in
node-negative breast cancer. Laboratory Invest. 81, 159–165.
20. Oshikawa, K., Yanagisawa, K., Ohno, S., Tominaga, S. &
Sugiyama, Y. (2002) Expression of ST2 in helper T lymphocytes of
malignant pleural effusions. Am.J.Respir.Crit.CareMed.165,
1005–1009.
21. Boyle-Walsh, E., Hashim, I.A., Speirs, V., Fraser, W.D. & White,
M.C. (1994) Interleukin-6 (IL-6) production and cell growth of
cultured human meningiomas: interactions with interleukin-1b
(IL-1b) and interleukin-4 (IL-4) in vitro. Neurosci. Lett. 170, 129–
132.
22. Levy, E.I., Paino, J.E., Sarin, P.S., Goldstein, A.L., Caputy, A.J.,
Wright, D.C. & Sekhar, L.N. (1996) Enzyme-linked immuno-
sorbent assay quantification of cytokine concentration in human
meningiomas. Neurosurgery 39, 823–829.
23. Todo, T., Adams, E.F., Rafferty, B., Fahlbusch, R., Dingermann,
T. & Werner, H. (1994) Secretion of interleukin-6 by human
meningioma cells: possible autocrine inhibitory regulation of
neoplastic cell growth. J. Neurosurg. 81, 394–401.
24. Gottschall, P.E., Koves, K., Mizuno, K., Tatsuno, I. & Arimura,
A. (1991) Glucocorticoid upregulation of interleukin 1 recep-
tor expression in a glioblastoma cell line. Am. J. Physiol. 261, 362–
368.
25. Gridley, D.S., Loredo, L.N., Slater, J.D., Archambeau, J.O.,
Bedros, A.A., Andres, M.L. & Slater, J.M. (1998) Pilot evaluation
of cytokine levels in patients undergoing radiotherapy for brain
tumor. Cancer Detect. Prev. 22, 20–29.
26. Jachimczak, P., Schwulera, U. & Bogdahn, U. (1994) In vitro
studies of cytokine–mediated interactions between malignant
glioma and autologous peripheral blood mononuclear cells.
J. Neurosurg. 81, 579–586.
27. Lichtor, T. & Libermann, T.A. (1994) Coexpression of inter-
leukin-1b and interleukin-6 in human brain tumor. Neurosurgery
34, 669–673.
28. Van Meir, E., Sawamura, Y., Diserens, A.C., Hamou, M.F. & de
Tribolet, N. (1990) Human glioblastoma cells release interleukin 6
in vitro and in vivo. Cancer Res. 50, 6683–6688.
29. Giulian, D. & Lachman, L.B. (1985) Interleukin-1 stimulation of
astroglial proliferation after brain injury. Science (Wash. DC)
228, 497–499.
30. Giulian, D., Young, D.G., Woodward, J., Brown, D.C. & Lach-
man, L.B. (1988) Interleukin-1 is an astroglial growth factor in the
developing brain. J. Neurosci. 8, 709–714.
31. Sweet, M.J., Leung, B.P., Kang, D., Sogaard, M., Schulz, K.,
Trajkovic, V., Campbell, C.C., Xu, D. & Liew, F.Y. (2001) A
novel pathway regulating lipopolysaccharide-induced shock
by ST2/T1 via inhibition of Toll-like receptor 4 expression.
J. Immunol. 166, 6633–6639.
170 Y. Haga et al. (Eur. J. Biochem. 270) Ó FEBS 2003