Báo cáo khoa học: The influence of temperature and osmolyte on the catalytic cycle of cytochrome c oxidase ppt
Bạn đang xem bản rút gọn của tài liệu. Xem và tải ngay bản đầy đủ của tài liệu tại đây (334.58 KB, 8 trang )
The influence of temperature and osmolyte on the catalytic cycle
of cytochrome
c
oxidase
Jack A. Kornblatt
1
, Bruce C. Hill
2
and Michael C. Marden
3
1
Enzyme Research Group, Concordia University, Montreal, Quebec, Canada;
2
Department of Biochemistry, Queen’s University,
Kingston, Ontario, Canada;
3
INSERM U473, Le Kremlin-Bice
ˆ
tre Cedex, France
The influence of temperature on cytochrome c oxidase
(CCO) catalytic activity was studied in the temperature
range 240–308 K. Temperatures below 273 K required the
inclusion of the osmolyte ethylene glycol. For steady-state
activity between 278 and 308 K the activation energy was
12 kcalÆmol
)1
; the molecular activity or turnover number
was 12 s
)1
at 280 K in the absence of ethylene glycol. CCO
activity was studied between 240 and 277 K in the presence
of ethylene glycol. The activation energy was 30 kcalÆmol
)1
;
the molecular activity was 1 s
)1
at 280 K. Ethylene glycol
inhibits CCO by lowering the activity of water. The rate
limitation in electron transfer (ET) was not associated with
ET into the CCO as cytochrome a was predominantly
reduced in the aerobic steady state. The activity of CCO in
flash-induced oxidation experiments was studied in the low
temperaturerangeinthepresenceofethyleneglycol.Flash
photolysis of the reduced CO complex in the presence of
oxygen resulted in three discernable processes. At 273 K the
rate constants were 1500 s
)1
,150s
)1
and 30 s
)1
and these
dropped to 220 s
)1
,27s
)1
and 3 s
)1
at 240 K. The acti-
vation energies were 5 kcalÆmol
)1
,7kcalÆmol
)1
,and
8kcalÆmol
)1
, respectively. The fastest rate we ascribe to the
oxidation of cytochrome a
3
, the intermediate rate to cyto-
chrome a oxidation and the slowest rate to the re-reduction
of cytochrome a followed by its oxidation. There are two
comparisons that are important: (a) with vs. without ethy-
lene glycol and (b) steady state vs. flash-induced oxidation.
When one makes these two comparisons it is clear that the
CCO only senses the presence of osmolyte during the
reductive portion of the catalytic cycle. In the present work
that would mean after a flash-induced oxidation and the
start of the next reduction/oxidation cycle.
Keywords: cytochrome coxidase; osmolytes; rate limitations.
Cytochrome c oxidase (CCO) is the terminal electron
transfer (ET) enzyme of the mitochondrial electron trans-
port chain and a site of energy transduction. During the
catalytic cycle, the enzyme accepts electrons one at a time
from cytochrome c; it stocks electrons in four metal centers
(Cu
A
, cytochrome a, cytochrome a
3
and Cu
B
) and finally
transfers four electrons to oxygen. The reduced oxygen
combines with four protons to form two molecules of water.
At the same time, protons are pumped from one side of the
protein to the other [1]. As the CCO is normally inserted in
the mitochondrial membrane, this pumping, added to the
consumption of protons in the mitochondrion, results in the
formation and maintenance of a transmembrane gradient of
protons. It, in conjunction with the membrane potential,
powers the synthesis of ATP as well as other energy
requiring functions [2].
The CCO from bovine heart contains 13 different protein
subunits, two hemes in the form of cytochromes a and a
3
,
two coppers in the form of Cu
A
with a third as Cu
B
;italso
contains Mg, Zn and some tightly bound phospholipid or
detergent. The three-dimensional structures of the bovine
heart CCO [3,4] and the Paracoccus denitrificans CCO [5]
are available from the protein data bank. The cytochrome c
binding site is on the side of the oxidase that faces the
cytosolic compartment of the cell. Electrons enter the
oxidase one at a time from cytochrome c; they enter via Cu
A
[6–8] which is contained within subunit II of the protein.
The groundwork for establishing the ET sequence was
performed by Chance et al. [9,10] and by Gibson and
Greenwood [11]. The sequence of electron transfers into,
out of, and within CCO is now more or less defined but
there is not universal agreement on the oxidation pathway
(see [8,12–14]). The initial ET is from cytochrome c into
Cu
A
[7] which rapidly equilibrates with cytochrome a [15].
The second electron rereduces Cu
A
thereby forming the
initial two-electron reduced oxidase. In the absence of
oxygen or the presence of CO, there is probably a two-
electron reduction of the cytochrome a
3
/Cu
B
site and this is
followed by rereduction of the Cu
A
/cytochrome a couple.
Our scheme for working with the oxidative pathway is
based on Hill’s analysis [8] but it is not critical for the data
reported here. The majority view for the oxidation
pathway is summarized in a recent paper by Morgan
et al. [14].
CCO acts as a proton pump [1]. It actively transfers about
one proton across the protein for each electron that is
transferred to oxygen. Under most conditions, there is no
Correspondence to J. A. Kornblatt, Enzyme Research Group,
Concordia University, 1455 de Maisonneuve, Montreal,
Quebec, CANADA H3G 1M8.
Fax: + 33 4 67 52 36 81 (until May 2003), + 1 514 848 2881
(after May 2003), Tel.: + 1 514 848 3404,
E-mail:
Abbreviations:CCO,cytochromec oxidase; TMPD, tetramethyl
phenylene diamine; ET, electron transfer.
(Received 2 October 2002, accepted 20 November 2002)
Eur. J. Biochem. 270, 253–260 (2003) Ó FEBS 2003 doi:10.1046/j.1432-1033.2003.03381.x
slippage. ET and proton transfer are tightly coupled [16].
This gives rise to the phenomenon of respiratory control. In
terms of the electron transfer reactions, proton transfer
occurs during the reduction of the binuclear center and
during the reduction of oxygen from the peroxy to the
oxyferryl intermediates [17].
A water cycle during turnover has been established
[18,19]. The application of hydrostatic-pressure influences
CCO only during turnover [20]; the current view is that
hydrostatic pressure exerts its effects on proteins by
influencing hydration. Reducing the activity of water also
influences CCO but only during turnover [18]. A series of
small hydrophilic molecules is capable of inhibiting CCO
activity and the inhibition scales with the size of the small
molecule effector [21]. The most potent inhibitor is that
whose size is closest to that of water. Based on a stochastic
model, the inhibitor studies indicate that around one water
molecule enters and leaves the oxidase for every proton that
is transported. Other techniques indicate that between one
and two water molecules enter and leave the CCO for every
proton transported [22]. The water cycle is coupled to ET
andprotontransfer.
The work presented here was based on the view that
pure ET reactions should be relatively insensitive to
temperature changes whereas combined ET, proton and
water transfer should be more sensitive. As temperatures
are reduced, the motions of waters internal to protein
structures, are reduced. To study enzyme catalysis at low
temperature, it is necessary to include ÔantifreezeÕ or
osmolyte in the enzyme mixture. This lowers water
activity and imposes a new rate limitation on catalytic
turnover. We use the term Ôrate limitationÕ to indicate
that it is the net effect of an unknown number of ÔslowÕ
steps and that it is not the effect of temperature on a
single rate constant. Northrop [23], Brown and Cooper
[24], and Ray [25] have shown that enzymes cannot
usually be analyzed in terms of a single, slowest, rate
determining step. All enzymes, though, are rate limited.
Temperature effects on the rate limitation have been
exploited over the years through the use of the Arrhenius
equation. Temperature sensitivity of the reaction rate
when that rate is not limited by substrate availability
yields an Arrhenius activation energy which is one among
many characteristics of the enzyme. For CCO which has
four well defined metal centers that act as electron
acceptors and donors, ET rates into and out of these
centers are influenced by temperature and can be
analyzed using the Arrhenius relation [26].
In this work we show, as have many other studies, that
steady state ET from cytochrome c to oxygen decreases as
temperature decreases. Furthermore, steady state sensiti-
vity at low temperature with osmolyte present is greater
than that exhibited for the internal ET reactions during
flash induced oxidations. This implies that the rate
limitation in the steady state, low temperature ET reaction
is developed only during the reductive phase of the
catalytic cycle. This idea is in keeping with the results of
other studies [12,27–32]. In terms of the comparisons
made in this work, it is only with the start of a second
cycle ) ET from cytochrome c to the oxidized oxid-
ase ) that low water activity causes this rate limitation
to shift from one set of steps to another.
Materials and methods
The purification of CCO has been described previously [33].
The protein is prepared using cholate, and then suspended
in 1% (v/v) Tween-80. Before use, the protein is mixed with
an equivalent weight of Tween-80, dialyzed to equilibrium
vs. 40 m
M
phosphate, pH 6.9 and then frozen. The
preparation is stable for a period of months.
Cytochrome c (prepared without trichloroacetic acid)
was purchased from Sigma. Tween-80, the detergent used
throughout the study, was from Fluka and was their highest
grade. Ethylene glycol, enzyme grade, was from Fisher. All
other chemicals were from Fluka and were the highest grade
available.
Steady state assays of CCO were carried out in 40 m
M
phosphate pH 6.9. The oxidation of cytochrome c was
monitored at 550 nm. The complete assay system contained
approximately 40 l
M
reduced cytochrome c and a variable
amount of CCO (with its equivalent weight of Tween-80)
depending on the temperature. Below 273 K, the assay
contained 44% (w/v) 40 m
M
phosphate and 56% (w/v)
ethylene glycol. The paH of this solution is 7.75 at 273 K
and 8.1 at 243 K; the term paH indicates that the activity of
hydrogen ions in the mixed solvent solution is known; when
no osmolyte is present, paH and pH are the same [34]. The
concentration of reduced cytochrome c was the same as in
the high temperature samples. Temperature inside the assay
cuvette was monitored continuously with a T-type thermo-
couple (Barrant Co., Barrington, IL, USA).
Flash photolysis at 532 nm was carried out with a
Quantel laser with a 10-ns pulse. The cuvette holder was
cooled with a double Peltier junction, the lower of which
was cooled with a refrigerated bath. It was relatively easy to
get as low as 240 K. The buffer system contained 44% (w/v)
40 m
M
phosphate pH 6.9 and 56% (w/v) ethylene glycol,
10 m
M
ascorbate and 50 l
M
tetramethyl phenylene diamine
(TMPD). The oxidase, final concentration 5 l
M
,was
added to the buffer system kept at about 270 K. The total
volume was 1 mL. The solution was gassed with CO and
allowed to sit on ice until such time as it was completely
reduced. The cuvette was placed in the refrigerated holder.
When the cuvette attained thermal equilibrium, 87 lLof
oxygenated solution of 44% (w/v) 40 m
M
phosphate/56%
(w/v) ethylene glycol was added with a chilled syringe; the
cuvette contents were mixed with the same syringe and the
CO flashed off. The temperature of the cuvette wall was
monitored before and after flashing. The samples were
monitored at a wavelength of 442 nm and the data stocked
in a LeCroy 9400 digital oscilloscope; they were treated as
described below.
Because these are single runoff experiments, it was not
possible to average multiple flash-induced events. A total of
32 000 data points were collected for each flash and these
were converted to fewer than 200, with the points at greater
times being the average of neighboring points centered at
the times indicated. For example, if the data are collected
at 1 ls per point, the total scan covers 32 ms. The data point
at 10 ms is the average of 64 points from 9.969 ms to
10.032 ms. Shorter times use fewer points to avoid a large
spread compared to the time after the flash [35]. An
equation containing the sum of three exponential terms was
fit to the data using
SIGMA PLOT
.
254 J. A. Kornblatt et al. (Eur. J. Biochem. 270) Ó FEBS 2003
Results
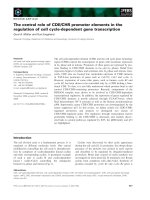
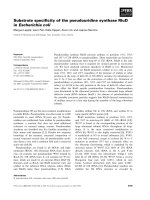
Figure 1 shows the response of CCO to temperature
changes. The assay used is spectrophotometric and meas-
ures the disappearance of reduced cytochrome c absorbance
at 550 nm. The assay consists of cytochrome c, CCO with
its equivalent weight of Tween-80, phosphate buffer and
oxygen. The data were collected from 280 to 306 K. Above
this value the slope of the Arrhenius plot started to change.
As we were not interested in the elevated temperatures, we
did not take data far above the straight portion of the
Arrhenius plot. We note that many other workers have
found a break in the curve at about the same temperature
[36,37]. In standard assays at 273 K, the oxidase turnover
number is close to 10 s
)1
which is similar to that found in
the older work. Kinetic and thermodynamic parameters are
summarized in Table 1. The Arrhenius activation energy
calculated from the data of Fig. 1 is 12 kcalÆmol
)1
,also
about the same as found in earlier work.
Under conditions similar to those of Fig. 1, there is little
indication that the rate limitation is a slow ET step between
cytochrome a and the binuclear center. In steady state
spectra in the presence of cytochrome c and TMPD/
ascorbate, the predominant form of the oxidase appears
to be a mixture of the pulsed form of the oxidized oxidase
and cytochrome a
2
a
3
3
.
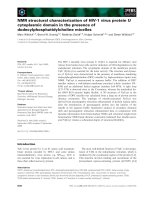
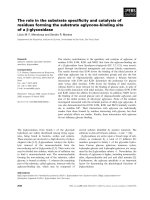
Figure 2 shows the spectral approach to the anaerobic
state as electrons are transferred from TMPD/ascorbate to
oxidase to oxygen. Qualitatively, the significant aspect of the
spectra is that there is only a minor peak that grows in at
443 nm between 2 min and 6 min. If cytochrome a were
completely reduced, the 443 nm peak would be consider-
ably higher as would the 605 nm peak (vida infra).
The addition of ethylene glycol to the buffers at 56%
(w/v) allows one to work at temperatures as low as 230 K.
Provided the phosphate concentration is kept < 0.1
M
,
there is no precipitation of phosphate even at the lowest
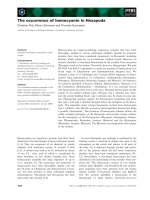
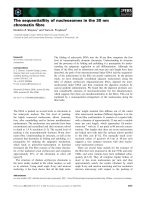
temperatures. At temperatures < 290 K the response of the
oxidase to changing temperature appears to follow a linear
Arrhenius relation (Fig. 3). Above 290 K there is a slow
(minute time scale) precipitation of the CCO which
complicates the kinetic analysis and prevents us from being
able to make a direct comparison between CCO at high
temperature (> 290 K) with and without ethylene glycol.
The bending of the curve in Fig. 3 at the higher temperatures
Fig. 1. CCO was assayed spectrophotometrically in 40 m
M
phosphate
pH 6.9. The initial reduced cytochrome c concentration was 40 l
M
;its
oxidation was followed at 550 nm. The temperature in the cuvette was
monitored during the assay with a T-type thermocouple; the tem-
perature was constant within ± 0.1 K over the course of the meas-
urement. The rate constant on the ordinate is a turnover number,
expressed on a per second time scale.
Table 1. Kinetic and thermodynamic constants for the steady state
activity and flash induced oxidation activity of cytochrome c oxidase.
No ethylene
glycol
56% ethylene
glycol
Steady state turnover
number at 280 K
12 s
)1
1s
)1
Steady state E
à
(T > 273 K) 12 kcalÆmol
)1
(T < 273 K) 30 kcalÆmol
)1
Single kinetic constants
for the three identified
kinetic processes
T ¼ 300 K
a
T ¼ 273 K
25 000 s
)1
1500 s
)1
10 000 s
)1
150 s
)1
800 s
)1
30 s
)1
Flash induced oxidation
E
à
for the three
distinguished processes
T > 273 K
a
T < 273 K
3 kcalÆmol
)1
5 kcalÆmol
)1
7 kcalÆmol
)1
7 kcalÆmol
)1
13 kcalÆmol
)1
8 kcalÆmol
)1
a
Data taken from Oliveberg et al. 1989 [26].
Fig. 2. The CCO aerobic steady state at 276 K. The oxidase concen-
tration was 5 l
M
, the cytochrome c was 3 l
M
. The buffer was
40 m
M
phosphate pH 6.9. Spectrum 1, before the addition of TMPD
and ascorbate; spectra 2–6, after the addition of 3 m
M
ascorbate and
300 l
M
TMPD; spectra 7–10, progression to the totally reduced
oxidase.
Ó FEBS 2003 Cytochrome c oxidase activity at low temperature (Eur. J. Biochem. 270) 255
reflects the fact that multiple processes are occurring. Below
290 K there is only one discernable process and it has an
activation energy of 30 kcalÆmol
)1
.
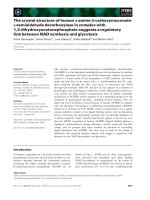
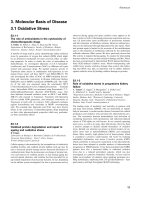
Qualitatively, the bottleneck that slows the catalytic
activity is between cytochrome a and cytochrome a
3
(Fig. 4) as was shown in earlier work [18]. The data were
collected at 250 K in the presence of low concentrations of
cytochrome c plus TMPD and ascorbate. As the concen-
tration of cytochrome c is increased, the fraction of
cytochrome a that is reduced increases. The fraction of
cytochrome a that is reduced is, in part, represented by the
peak that grows in at 443 nm and that which disappears at
416 nm. The spectra of Figs 2 and 4 are compared in Fig. 5
where the emphasis is on the changes occurring at 443 nm
and 605 nm.
The progression to and out of the steady state is shown in
Fig. 5. Both monitoring wavelengths show that the steady
state is reached within 5 min of TMPD/ascorbate addition
to either high or low temperature samples. The steady state
is then maintained over the course of 6 min (276 K) or
600 min (250 K) until the preparations become anaerobic.
The time course of the absorbance changes at 276 K (d)
and 250 K (s) are shown in (A) and (B) based on the data
of the absorption spectra of Figs 2 and 4. In both panels, the
data have been normalized to a concentration of 1 l
M
oxidase and have been corrected at 605 nm for the
absorbance contributed by oxidized cytochrome c
(< 5%). Figure 5A shows the time course of the absorb-
ance change at 443 nm. The difference between the steady
state values of the 276 K sample and the totally reduced
sample at 276 K are clearly much larger than the compar-
able difference seen for the 250 K sample. This difference
reflects the extent to which cytochrome a is reduced; it is
more reduced in the 250 K sample than in the 276 K
sample. An approximation [38] of the extent to which
cytochrome a is reduced can be obtained from the data of
(B) which shows the time course of changes at 605 nm. This
approximation is based on the fact that the 605 nm band is
almost exclusively the result of cytochrome a absorption.
Under the conditions used here the extinction coefficient for
the oxidized oxidase is 26 m
M
)1
Æcm
)1
; this is the pulsed
form. The extinction coefficient for the totally reduced
oxidase at605nm is 40m
M
)1
Æcm
)1
. A
605
for the 276 K
sample starts at 0.034 in the steady state and yields a value
of 0.042 for the totally reduced oxidase. This corresponds to
50% reduction of cytochrome a in the steady state at
276 K. At 250 K, in the presence of ethylene glycol, A
605
is
0.038 in the steady state and is 0.042 when the sample
goes totally reduced. This corresponds to 75% of the
cytochrome a reduced in the steady state. The presence of
ethylene glycol inhibits the oxidase by reducing electron
flow between cytochrome a and cytochrome a
3
.
In order to study the nature of the block, we carried out
flash induced oxidation experiments in the presence of 56%
(w/v) ethylene glycol at temperatures below 273 K.
Reduced CO oxidase was mixed with oxygen and the CO
flashed off with a 10-ns pulse (532 nm). Fig. 6 shows the
evolution of absorption changes at 442 nm as a function of
time. Two typical data sets are shown. One was collected at
268 K (s) and the second at 238 K. An equation containing
the sum of three exponential rates was fit to the data thereby
yielding three rate constants at each temperature. The fitted
lines are included in the figure. The typical R
2
was 0.998.
The three sets of rate constants from temperatures
between 278 and 240 K were plotted as shown in Fig. 7.
The Arrhenius energies (Table 1) are 5 kcalÆmol
)1
(fastest
Fig. 4. The CCO aerobic steady state at 250 K. The oxidase concen-
tration was 6.3 l
M
,thecytochrome c was 3 l
M
. The buffer was 44%
(w/v) 40 m
M
phosphate pH 6.9, 56% (w/v) ethylene glycol. Spectrum
1, before the addition of TMPD and ascorbate; spectra 2–19, after the
addition of 3 m
M
ascorbate and 300 l
M
TMPD; spectra 20–30, pro-
gression to the totally reduced oxidase.
Fig. 3. CCO was assayed spectrophotometrically in a mixed solvent
system consisting of 44% (w/v) 40 m
M
phosphate, pH 6.9 and 56%
(w/v) ethylene glycol. The initial reduced cytochrome c concentration
was 40 l
M
; its oxidation was followed at 550 nm. The temperature in
the cuvette was monitored during the assay with a T-type thermo-
couple and was constant within ± 0.1 K over the course of the
measurement. The rate constant on the ordinate is a turnover number,
based on a per minute time scale.
256 J. A. Kornblatt et al. (Eur. J. Biochem. 270) Ó FEBS 2003
process), 7 kcalÆmol
)1
and 8 kcalÆmol
)1
(slowest process).
These numbers are much smaller than those obtained in the
steady state assay; the activation energies obtained in the
flash induced oxidation experiments cannot account for
the rate limitation in the steady state.
Discussion
The catalytic activity of CCO varies from preparation to
preparation and from laboratory to laboratory. It is a
function of ionic strength, pH, detergent and detergent
concentration, temperature, cosolvents, hydrostatic pres-
sure, osmotic pressure and probably other factors. None-
theless, catalytic activity is still one of the few characteristics
that reflect the actual role of the oxidase in the tissues.
What is that role? The oxidase catalyzes the transfer of
electrons from cytochrome c to oxygen. It couples the
energy liberated in the process to the generation of an
electrochemical gradient of protons. The two appear to be
tightly coupled under most circumstances. Even under
conditions where the oxidase is not contained within a
membrane, protons are still pumped from one side of the
protein to the other. There is also a water cycle that is
coupled to electron and proton transfer. Water must enter
and leave the protein for the oxidase to turnover [18,21]. The
function of this last cycle is unknown but it may be part of
the proton transfer machinery.
The overall rate constant for any process is determined by
all the rate constants that contribute to the reaction [23–25].
InthecaseofETfromcytochrome c to oxygen catalyzed by
CCO, rate constants as a function of temperature have been
Fig. 6. Flash photolysis of Cu
1
A
a
2
Cu
1
B
a
2
3
CO + O
2
. Five l
M
reduced
CO CCO was in 44% (w/v) 40 m
M
phosphate pH 6.9, 56% (w/v)
ethylene glycol. The temperature was 268 K (s)or238 K(d). Oxygen
was added with a prechilled syringe and the CO was flashed off with a
10-ns pulse at 532 nm; 32 000 data points were collected and treated as
detailed in Materials and methods. An equation containing the sum of
three exponentials was fit to the data. The R
2
forthefitwasbetterthan
0.998; the fit is shown as the solid line through each set of data points.
Fig. 5. The time course of the absorbance changes at (A) 276 K (d)and
(B) 250 K (s). These data are taken from the absorption spectra of
Figs 2 and 4. In both panels, the data have been normalized to a
concentration of 1 l
M
oxidase and have been corrected for the
absorbance contributed by cytochrome c (< 5%). (A) Time course of
the absorbance change at 443 nm. (B) Time course of absorbance
changesat605nm.Thedatain(B)canbeusedtoapproximatethe
extent of cytochrome a reduction during the steady state. It is 50%
reduced at 276 K and 75% reduced at 250 K.
Fig. 7. Evaluation of Arrhenius activation energies of the three processes
discernible in the low temperature flash photolysis experiments. The
activation energies are: k1, 5 kcalÆmol
)1
(d); k2, 7 kcalÆmol
)1
(s); k3:
8.0 kcalÆmol
)1
(.) based on the assumption that the individual data
sets could be fit to straight lines.
Ó FEBS 2003 Cytochrome c oxidase activity at low temperature (Eur. J. Biochem. 270) 257
measured several times. An early study by Smith and
Newton [37] showed that simple Arrhenius behavior was
not followed over an extended temperature range. Two
processes were evident with a break at about 30°C. At
temperatures above the break, the activation energy was
8kcalÆmol
)1
; at temperatures below the break the acti-
vation energy was 12.5 kcalÆmol
)1
. The Smith/Newton
data was not substantially different from that collected
earlier by Minnaert (quoted in [36]). Other workers have
subsequently reported similar activation energies in the
same temperature range [39,40]. Under similar conditions,
we find 12 kcalÆmol
)1
at temperatures < 30 °C. The
turnover numbers determined in the above mentioned
papers and ours are about the same. Interestingly, the acti-
vation energies for the bimolecular rate constants between
cytochrome c and CCO are also about 16 kcalÆmol
)1
for the
temperature range < 20 °C[41].
The inclusion of high concentrations of the cryoprotec-
tant, ethylene glycol, inhibits the catalytic activity of CCO
[18]. In order to work at temperatures as low as 235 K, it
was necessary to include 56% (w/v) ethylene glycol in the
solution; this results in 90% inhibition of the overall
activity of the cytochrome c oxidase, an energetic difference
of 1.2 kcalÆmol
)1
. Part of the inhibition probably stems
from a slight weakening of the interaction between
cytochrome c and the oxidase [42]; however, halving the
cytochrome c concentration in the steady state assays had
no effect on the measured activity. Ethylene glycol and low
temperature also increase the viscosity of the medium; if
there are large conformational changes that occur in the
oxidase during the catalytic cycle, these would be influenced
by the increased viscosity. Certainly, there are conforma-
tional changes that occur here. Lowering temperature
increases both the dielectric coefficient of the medium and
the dielectric coefficient ÔinsideÕ the protein: both can be
expected to influence catalytic activity. The majority of the
inhibition arises from blocking an internal ET step located
between cytochrome a and cytochrome a
3
[18]; this is
clearly shown in Figs 4 and 5.
The influence of temperature on the ethylene glycol-
inhibited protein was studied in both the steady state
condition and the flash induced oxidation condition.
Steady state condition. During steady state turnover, the
activation energy for ET from cytochrome c to oxygen is
30 kcalÆmol
)1
(Fig. 3), 2.5 times the value found in the
temperature range between 273 and 300 K in the absence
of ethylene glycol. The block is not at the delivery of
electrons into Cu
A
as the steady state spectrum of the
cytochrome a shows it to be about 75% reduced (Figs 4
and 5). Low temperature that results in freezing is capable
of inducing the same inhibition. Nicholls and Kimelberg
[43] showed that a solution of oxidase and TMPD/
ascorbate would yield a mixed valence oxidase (cyto-
chrome a reduced, cytochrome a
3
oxidized) at 77 K. It
took between 40 and 240 s for the samples to freeze;
during the freezing process, the sample undergoes osmotic
stress. The vapor pressure of the ice surrounding the
oxidase is lower than the vapor pressure of water in the
protein. The Nicholls/Kimelberg experiment is therefore
similar to the ones carried out here using ethlyene glycol
as the osmotic stress agent [44].
Flash induced oxidation condition. During the oxidative
phase of CCO, three processes can be easily seen after
flash induction of oxidation. The three steps have energy
barriers which are substantial (5–8 kcalÆmol
)1
). These
energy barriers are relatively independent of the presence
or absence of ethylene glycol and the temperature at
which the measurements are made (Table 1). The reac-
tions occurring during the oxidative phase cannot account
for the increased energy barrier occurring during steady
state turnover.
The influence of temperature and ethylene glycol on the
three rate constants was also studied. The rate constants
decrease by > 90% when ethylene glycol is added [8,28] an
energetic difference of about 1.5 kcalÆmol
)1
These decrease
by another 80% as the temperature is lowered from 273 to
248 K [45] or 240 K (this work).
Our rate constants for the oxidation phase are still faster
than the overall rate constant during the steady state. As the
latter is the complex function of all the internal and
intermolecular rate constants, the difference between the
two sets of numbers is expected.
In summary, at room temperature when no osmolyte is
present, the activation energies of the individual steps in ET
are comparable to the activation energy for the overall
reaction. The limitation on the steady state, catalytic rate, is
a reasonably fast reaction associated with ET. The inclusion
of 56% (w/v) ethylene glycol changes that. The individual
ET steps are slowed by the imposition of low temperature.
The activation energies are about the same as they are in the
absence of ethylene glycol but the activation energy for
steady state turnover is far higher than it is for any of the
individual oxidative steps. This can only mean that a new
rate limitation has been introduced into the catalytic cycle
and that this new rate limitation occurs only after the
completion of the flash induced oxidation of the reduced
oxidase.
The situation is somewhat, but not quite, analogous to
that seen by Karpefors et al. [46] when they found that the
onset of a large deuterium isotope effect was not seen
immediately after mixing with D
2
O but rather occurred only
after a lag time. It is more in keeping with the idea that
something rate limiting occurs at the onset of a second
catalytic cycle of reduction of CCO by cytochrome c.
Mitchell and Rich [47] proposed that two protons were
taken up on reduction of CCO and that these were taken up
concomitantly with reduction of the binuclear cytochrome
a
3
-Cu
B
site. Our results could also be explained by proton
uptake during reduction of the cytochrome a-Cu
A
site as
proposed by Capitano et al.[48].
Ethylene glycol is a cryoprotectant. It acts by influen-
cing the colligative properties of water. The inclusion of
ethylene glycol in our solutions lowers not only the
freezing point of our solutions, but also the activity of
water. If water entry and exit are necessary for catalytic
ET to occur, then we have shown here that this cycle is
initiated only during the reductive phase of the catalytic
cycle. Reduced oxidase would therefore start as a
hydrated molecule. There would be no impediment to
ET within the oxidase nor from the oxidase to oxygen.
The rate limitation in the overall steady state process
would be the entry of water accompanying reduction and
ET within the protein.
258 J. A. Kornblatt et al. (Eur. J. Biochem. 270) Ó FEBS 2003
Acknowledgements
We wish to thank M. J. Kornblatt for helpful discussions. This work
was generously supported by Natural Sciences and Engineering
Research Council (Canada) and the Institut National de la Sante
´
et
la Recherche Medicale (France).
References
1. Wikstrom, M.K. (1977) Proton pump coupled to cytochrome c
oxidase in mitochondria. Nature 266, 271–273.
2. Mitchell, P. (1979) Keilin’s respiratory chain concept and its
chemiosmotic consequences. Science 206, 1148–1159.
3. Tsukihara, T., Aoyama, H., Yamashita, E., Tomizaki, T., Yam-
aguchi, H., Shinzawa-Itoh, K., Nakashima, R., Yaono, R. &
Yoshikawa, S. (1996) The whole structure of the 13-subunit
oxidized cytochrome c oxidase at 2.8A
˚
. Science 272, 1136–1144.
4. Yoshikawa, S., Shinzawa-Itoh, K., Nakashima, R., Yaono, R.,
Yamashita,E.,Inoue,N.,Yao,M.,Fei,M.J.,Libeu,C.P.,
Mizushima,T.,Yamaguchi,H.,Tomizaki,T.&Tsukihara,T.
(1998) Redox-coupled crystal structural changes in bovine heart
cytochrome c oxidase. Science 280, 1723–1729.
5. Ostermeier, C., Harrenga, A., Ermler, U. & Michel, H. (1997)
Structure at 2.7 A
˚
resolution of the Paracoccus denitrificans two-
subunit cytochrome c oxidase complexed with an antibody FV
fragment. Proc. Natl Acad. Sci. USA 94, 10547–10553.
6. Hill, B.C. (1988) Electron transfer from cytochrome c to O2. Ann.
NY Acad. Sci. 550, 98–104.
7. Hill, B.C. (1991) The reaction of the electrostatic cytochrome
c-cytochrome oxidase complex with oxygen. J. Biol. Chem. 266,
2219–2226.
8. Hill, B.C. (1994) Modeling the sequence of electron transfer
reactions in the single turnover of reduced, mammalian
cytochrome c oxidase with oxygen. J. Biol. Chem. 269, 2419–
2425.
9. Chance, B., Saronio, C. & Leigh, J.S. Jr (1975) Functional inter-
mediates in reaction of cytochrome oxidase with oxygen. Proc.
NatlAcad.Sci.USA72, 1635–1640.
10. Chance, B., Saronio, C., Leigh, J.S. Jr, Ingledew, W.J. &
King, T.E. (1978) Low-temperature kinetics of the reaction
of oxygen and solubilized cytochrome oxidase. Biochem. J. 171,
787–798.
11. Gibson, Q.H. & Greenwood, C. (1963) Reactions of cytochrome c
oxidase with oxygen and carbon monoxide. Biochem. J. 86,541–
555.
12. Branden, M., Tomson, F., Gennis, R.B. & Brzezinski, P. (2002)
The entry point of the k-proton-transfer pathway in cytochrome c
oxidase. Biochemistry 41, 10794–10798.
13. Einarsdottir, O. (1995) Fast reactions of cytochrome oxidase.
Biochim. Biophys. Acta 1229, 129–147.
14. Morgan, J.E., Verkhovsky, M.I., Palmer, G. & Wikstrom, M.
(2001) Role of the PR intermediate in the reaction of cytochrome c
oxidase with O2. Biochemistry 40, 6882–6892.
15. Antalis, T.M. & Palmer, G. (1982) Kinetic characterization of the
interaction between cytochrome oxidase and cytochrome c. J. Biol.
Chem. 257, 6194–6206.
16. Chance, B., & Williams, G.R. (1956) The respiratory chain and
oxidative phosphorylation. Adv. Enzymol. 17, 65–134.
17. Fabian, M. & Palmer, G. (2001) Proton involvement in the tran-
sition from the ÔperoxyÕ to the ferryl intermediate of cytochrome c
oxidase. Biochemistry 40, 1867–1874.
18. Kornblatt, J.A. & Hoa, G.H. (1990) A nontraditional role
for water in the cytochrome c oxidase reaction. Biochemistry 29,
9370–9376.
19. Kornblatt, J.A., Kornblatt, M.J., Rajotte, I., Hoa, G.H. & Kahn,
P.C. (1998) Thermodynamic Volume cycles for electron transfer in
the cytochrome c oxidase and for the binding of cytochrome c to
cytochrome c oxidase. Biophys. J. 75, 435–444.
20. Kornblatt, J.A., Hui Bon, H.G. & Heremans, K. (1988) Pressure-
induced effects on cytochrome oxidase: the aerobic steady state.
Biochemistry 27, 5122–5128.
21. Kornblatt, J.A. (1998) The water channel of cytochrome c oxidase:
inferences from inhibitor studies. Biophys. J. 75, 3127–3134.
22. Kornblatt, J.A. & Kornblatt, M.J. (1992) Cytochrome c oxidase:
the presumptive channel holds at least four waters. Biochim. Bio-
phys. Acta 1099, 182–184.
23. Northrop, D.B. (1981) Minimal kinetic mechanism and general
equation for deuterium isotope effects on enzymic reactions:
uncertainty in detecting a rate-limiting step. Biochemistry 20,
4056–4061.
24. Brown, G.C. & Cooper, C.E. (1993) Control analysis applied to
single enzymes: can an isolated enzyme have a unique rate-limiting
step? Biochem. J. 294, 87–94.
25. Ray, W.J. Jr (1983) Rate-limiting step: a quantitative definition.
Application to steady-state enzymic reactions. Biochemistry 22,
4625–4637.
26. Oliveberg, M., Brzezinski, P. & Malmstrom, B.G. (1989) The ef-
fect of pH and temperature on the reaction of fully reduced and
mixed-valence cytochrome c oxidase with dioxygen. Biochim.
Biophys. Acta 977, 322–328.
27. Adelroth, P., Gennis, R.B. & Brzezinski, P. (1998) Role of the
pathway through K (I-362) in proton transfer in cytochrome c
oxidase from R. sphaeroides. Biochemistry 37, 2470–2476.
28. Adelroth, P., Karpefors, M., Gilderson, G., Tomson, F.L.,
Gennis, R.B. & Brzezinski, P. (2000) Proton transfer from glu-
tamate 286 determines the transition rates between oxygen inter-
mediates in cytochrome c oxidase. Biochim. Biophys. Acta 1459,
533–539.
29. Ruitenberg, M., Kannt, A., Bamberg, E., Ludwig, B., Michel, H.
& Fendler, K. (2000) Single-electron reduction of the oxidized
state is coupled to proton uptake via the K pathway in Paracoccus
denitrificans cytochrome c oxidase. Proc. Natl Acad. Sci. USA 97,
4632–4636.
30. Junemann, S., Meunier, B., Gennis, R.B. & Rich, P.R. (1997)
Effects of mutation of the conserved lysine-362 in cytochrome c
oxidase from Rhodobacter sphaeroides. Biochemistry 36, 14456–
14464.
31. Konstantinov, A.A., Siletsky, S., Mitchell, D., Kaulen, A. &
Gennis, R.B. (1997) The roles of the two proton input channels in
cytochrome c oxidase from Rhodobacter sphaeroides probed by the
effects of site-directed mutations on time-resolved electrogenic
intraprotein proton transfer. Proc. Natl Acad. Sci. USA 94, 9085–
9090.
32. Namslauer, A., Branden, M. & Brzezinski, P. (2002) The rate of
internal heme-heme electron transfer in cytochrome c oxidase.
Biochemistry 41, 10369–10374.
33. Yonetani, T. Cytochrome oxidase from beef heart. Biochemical
Preparations 11, 14–20 (1966).
34. Douzou, P. (1977) Cryobiochemistry. Academic Press, New York,
USA.
35. Marden,M.C.,Kister,J.,Bohn,B.&Poyart,C.(1988)T-state
hemoglobin with four ligands bound. Biochemistry 27, 1659–1664.
36. Minneart, K. (1961) The kinetics of cytochrome c oxidase. Bio-
chim. Biophys. Acta 50, 23–34.
37. Smith, L. & Newton, N. (1968) Structure and Function of Cyto-
chromes. University of Tokyo Press, Tokyo, Japan.
38. Kornblatt, J.A. & Luu, H.A. (1986) The interactions of cyto-
chrome c and porphyrin cytochrome c with cytochrome c oxidase.
The resting, reduced and pulsed enzymes. Eur. J. Biochem. 159,
407–413.
39. Malatesta,F.,Sarti,P.,Antonini,G.,Vallone,B.&Brunori,M.
(1990) Electron transfer to the binuclear center in cytochrome
Ó FEBS 2003 Cytochrome c oxidase activity at low temperature (Eur. J. Biochem. 270) 259
oxidase: catalytic significance and evidence for an additional
intermediate. Proc. Natl Acad. Sci. USA 87, 7410–7413.
40. Wilms, J., Dekker, H.L., Boelens, R. & van Gelder, B.F. (1981)
The effect of pH and ionic strength on the pre-steady-state reac-
tion of cytochrome c and cytochrome aa3. Biochim. Biophys. Acta
637, 168–176.
41. Veerman, E.C., Wilms, J., Dekker, H.L., Muijsers, A.O., van
Buuren, K.J., van Gelder, B.F., Osheroff, N., Speck, S.H. &
Margoliash, E. (1983) The presteady state reaction of chemically
modified cytochromes c with cytochrome oxidase. J. Biol. Chem.
258, 5739–5745.
42.Kornblatt,J.A.,Kornblatt,M.J.,Hoa,G.H.&Mauk,A.G.
(1993) Responses of two protein-protein complexes to solvent
stress: does water play a role at the interface? Biophys. J. 65, 1059–
1065.
43. Nicholls, P. & Kimelberg, H.K. (1968) Cytochromes a and a3.
Catalytic activity and spectral shifts in situ and in solution.
Biochim. Biophys. Acta 162, 11–21.
44. Parsegian, V.A., Rand, R.P., Fuller, N.L. & Rau, D.C. (1986)
Osmotic stress for the direct measurement of intermolecular for-
ces. Methods Enzymol. 127, 400–416.
45. Morgan, J.E., Verkhovsky, M.I. & Wikstrom, M. (1996)
Observation and assignment of peroxy and ferryl intermediates
in the reduction of dioxygen to water by cytochrome c oxidase.
Biochemistry 35, 12235–12240.
46. Karpefors, M., Adelroth, P. & Brzezinski, P. (2000) The onset of
the deuterium isotope effect in cytochrome c oxidase. Biochemistry
39, 5045–5050.
47. Mitchell, R. & Rich, P.R. (1994) Proton uptake by cytochrome c
oxidaseonreductionandonligandbinding.Biochim. Biophys.
Acta 1186, 19–26.
48. Capitanio, N., Capitanio, G., Minuto, M., De Nitto, E., Palese,
L.L., Nicholls, P. & Papa, S. (2000) Coupling of electron transfer
with proton transfer at heme a and Cu(A) (redox Bohr effects) in
cytochrome c oxidase. Studies with the carbon monoxide inhibited
enzyme. Biochemistry 39, 6373–6379.
260 J. A. Kornblatt et al. (Eur. J. Biochem. 270) Ó FEBS 2003