Báo cáo khoa học: The heterogeneity of mast cell tryptase from human lung and skin Differences in size, charge and substrate affinity ppt
Bạn đang xem bản rút gọn của tài liệu. Xem và tải ngay bản đầy đủ của tài liệu tại đây (404.23 KB, 14 trang )
The heterogeneity of mast cell tryptase from human lung and skin
Differences in size, charge and substrate affinity
Qi Peng
1
, Alan R. McEuen
1
, R. Christopher Benyon
2
and Andrew F. Walls
1
1
Immunopharmacology Group and
2
Tissue Remodelling and Repair, University of Southampton School of Medicine,
Southampton General Hospital, Southampton, UK
There has long been conjecture over the degree to which there
may be structural and functional heterogeneity in the tetra-
mericserineproteasetryptase(EC3.4.21.59),amajor
mediator of allergic inflammation. We have applied 2D gel
electrophoresis to analyze the extent, nature, and variability
of this heterogeneity in lysates of mast cells isolated from lung
and skin, and in preparations of purified tryptase. Gels were
silver stained, or the proteins transferred to nitrocellulose
blots and probed with either tryptase-specific monoclonal
antibodies or various lectins. Tryptase was the major protein
constituent in mast cell lysates, and presented as an array of
9–12 diffuse immunoreactive spots with molecular masses
ranging from 29 to 40 kDa, and pI values from 5.1 to 6.3.
Although the patterns obtained for lung and skin tryptase
were broadly similar, differences were observed between
tissues and between individual donors. Lectin binding studies
indicated the presence of mono-antennary or bi-antennary
complex-type oligosaccharide with varying degrees of
sialylation. Deglycosylation with protein-N-glycosidase
F (PNGase F) reduced the size of both lung and skin
tryptase, while incubation with PNGase F or neuramini-
dase narrowed the pI range, indicating variable degrees of
glycosylation as a major contributor to the size and
charge heterogeneity. Comparison of different purified
preparations of lung and skin tryptase revealed no significant
difference in pH profiles, but differences were seen in
reactivity towards a range of chromogenic substrates, with
substantial differences in K
m
, k
cat
and degree of coopera-
tivity. Mathematical modeling indicated that the variety in
kinetics parameters could not result solely from the sum of
varying amounts of isoforms obeying Michaelis–Menten
kinetics but with different values of K
m
and k
cat
.The
heterogeneity demonstrated for tryptase in these studies
suggests that there are important differences in tryptase
function in different tissues.
Keywords: mast cell; tryptase; glycosylation; lectin; 2D gel
electrophoresis.
Tryptase (EC 3.4.21.59) is a serine protease of mast cell
origin with trypsin-like substrate specificity [1,2]. Upon
activation of these cells with allergen or other stimuli, it is
released along with other potent mediators of inflammation
including other neutral proteases, histamine, proteoglycans,
eicosanoids and cytokines. Its actions on peptides [3,4],
proteins [5,6], cells [7–11] and tissues [12,13] are consistent
with a pro-inflammatory role in allergic disease, and
inhibitors of tryptase have proved efficacious in animal
and human models of asthma [14,15].
Although tryptase is generally referred to as a single
enzyme, heterogeneity has been observed at both the
structural [16–20] and functional [21,22] level of the protein.
Unusually for a serine protease, tryptase exists as a tetramer
of approximately 130 kDa [23]. The earliest reports on this
enzyme indicated microheterogeneity of the subunits, with
molecular masses ranging from 31 to 38 kDa on SDS/
PAGE gels, sometimes as a broad, diffuse band, sometimes
as discrete bands. Both high and low molecular mass forms
have been found to possess an enzymatically active site
capable of being labeled by [
3
H]diisopropyl fluoro-
phosphate ([
3
H]DFP) [17], while Western blotting with
various antibodies has demonstrated extensive antigenic
similarities [19,24]. Treatment with protein-N-glycosidase F
(PNGase F) reduced the apparent molecular mass of the
subunits in tryptase purified from pituitary [18] and from
skin [20], but not from lung [16,18]. Differences in reactivity
towards synthetic peptide substrates and inhibitors have
been reported between tryptase purified from lung and that
purified from skin [21] (although a subsequent comparison
has failed to confirm such differences [25]). Functional
differences were also noticed between two isoforms of lung
tryptase which cleaved high molecular weight kininogen and
vasoactive intestinal peptide at different sites and at different
rates [22].
Correspondence to A. F. Walls, Immunopharmacology Group,
Mailpoint 837, F Level South Block, Southampton General Hospital,
Southampton SO16 6YD, UK.
Fax: +44 23 80796979, Tel.: +44 23 80796151,
E-mail:
Abbreviations: Con A, concanavalin A; DFP, diisopropyl fluoro-
phosphate; FBS, fetal bovine serum; <Glu-,
L
-pyroglutamyl-; MAA,
Maackia amurensis agglutinin; MEM, minimal essential medium;
MeOCO-, N
a
-methoxycarbonyl-; MUGB, 4-methylumbelliferyl-p-
guanidinobenzoate; PHA-L, phytohemagglutinin-L; Pip-, pipecolyl-;
PNGase F, protein-N-glycosidase F; SNA, Sambucus nigra agglutinin;
SNP, single nucleotide polymorphism; Suc-, N
a
-succinyl-;
WGA, wheat germ agglutinin.
Enzyme: serine protease tryptase (EC 3.4.21.59).
Note: a web site is available at />rcmb/groups/mast-baso.htm
(Received 16 April 2002, revised 12 November 2002,
accepted 21 November 2002)
Eur. J. Biochem. 270, 270–283 (2003) Ó FEBS 2003 doi:10.1046/j.1432-1033.2003.03385.x
Initially, four different cDNA sequences were identified,
a-andb-tryptase from a human lung mast cell library
[26,27] and tryptases I, II and III, from a skin library [28].
Tryptase II and b-tryptase were found to be identical and to
share 98% identity with tryptases I and III, but only 90%
with a-tryptase. Consequently, tryptases I, II, and III have
been considered together as the b-tryptases but distin-
guished as bI, bII, and bIII. Subsequent genomic sequencing
has identified additional tryptase-like genes which have been
designated c-, d-, and e-tryptases [29–32], but these do not
appear to be secreted by mast cells: c-tryptase (also known
as trans-membrane tryptase) is membrane-bound [30,31],
d-tryptase (also known as mMCP-7-like protease) appears
to be a pseudogene [30,33,34], and e-tryptase is a product of
fetal lung epithelial cells [32]. In contrast, most preparations
of tissue mast cells contain ample mRNA encoding both
a-andb-tryptases [35]. a-Tryptase appears to be released
constitutively from mast cells as the pro-form while the
b-tryptases are stored and subsequently released in the
mature form on anaphylactic degranulation [36,37]. Data
accruing from the Human Genome Project indicate that the
four secreted mast cell tryptases, a, bI, bII, and bIII, are
confined to two genetic loci with a and bI competing
allelically at one locus and bII and bIII competing allelically
at the other [30,34].
All four deduced amino acid sequences predict a poly-
peptide chain of approximately 27.5 kDa, so the experi-
mentally observed subunit molecular masses of 30–38 kDa
are indicative of extensive post-translational modification.
Consistent with these observations is the presence of two
consensus N-glycosylation sites in a-andbI-tryptase, and
one such site in bII- and bIII-tryptase [27,28]. Interestingly,
a single nucleotide polymorphism (SNP) has been reported
for bII-tryptase which would result in two glycosylation
sites in a significant proportion of the population [38]. The
application of 2D gel electrophoresis and subsequent
Western blotting to lysates of purified skin mast cells
revealed multiple forms of tryptase with major differences in
size and charge, together with evidence for variable
glycosylation [20]. However, this sensitive analytical proce-
dure has not been employed to characterize tryptase from
the lung or other sources, or to compare tryptase from
different tissues or donors.
The importance of tryptase as a major mediator of allergic
disease, and its potential value as a target for therapeutic
intervention call for a more detailed understanding of the
forms of tryptase in human tissues. In the present studies we
have applied 2D gel electrophoresis with Western blotting to
examine the size and charge heterogeneity of tryptase from
lysates of purified lung and skin mast cells and have
employed lectin binding studies to investigate the nature of
glycosylation. In addition, we have purified tryptase from
both lung and skin tissues, and have compared the kinetics
of cleavage of a range of chromogenic substrates.
Materials and methods
Isolation of lung mast cells
Human lung mast cells were isolated as described previously
[39]. Briefly, cells from macroscopically normal human lung
tissue (obtained through surgical resection for lung cancer)
were dispersed using collagenase (type 1A, 1.0 mgÆmL
)1
),
hyaluronidase (type 1, 0.75 mgÆmL
)1
), protease (type A,
0.5 mgÆmL
)1
), bovine serum albumin (BSA, 25 mgÆmL
)1
)
and penicillin/streptomycin solution (25 lLÆmL
)1
;allfrom
Sigma, Poole, UK) at 37 °C for 75 min with agitation,
suspended in MEM/FBS (minimal essential medium/fetal
bovine serum; Gibco BRL, Paisley, UK), and centrifuged
on 65% isotonic Percoll (Sigma) at 750 g for 20 min at 4 °C
to remove erythrocytes. Cells were harvested above the
erythrocyte pellet, and further purified using affinity mag-
netic selection with an antibody (YB5.B8) specific for a mast
cell-specific surface marker (c-kit) coupled to Dynabeads
(Dynal). Kimura staining indicated that the purity of mast
cells thus obtained ranged from 65% to 95% of all
nucleated cells.
Isolation of skin mast cells
Mast cells were isolated as described previously from infant
foreskin tissue obtained at circumcision of children [39,40].
Cells were dispersed enzymatically in MEM/FBS and mast
cells were purified by density sedimentation through a
discontinuous gradient of 60, 70 and 80% isotonic Percoll
(density 1.076–1.100 gÆmL
)1
)at500g for 20 min at 4 °C.
Cells were pooled from the bottom of the gradient and the
70–80% interface. These suspensions consisted of 70–98%
mast cells.
Enzyme purification
Tryptase was purified from high salt extracts of homo-
genized human lung tissue (obtained post mortem), or skin
tissue (removed from amputated limbs) using cetylpyridi-
nium chloride precipitation, heparin-agarose affinity chro-
matography, and gel filtration as described previously [41].
Tryptase activity was monitored during purification by the
hydrolysis of N
a
-benzoyl-
DL
-Arg-4-nitroanilide (Bz-Arg-
NH-Np) [19]. Some preparations of lung tryptase were
purified using immunoaffinity chromatography as described
previously [12]. The concentration of the purified tryptase
was determined by active site titration with 4-methyl-
umbelliferyl-p-guanidinobenzoate (MUGB) in a Hitachi
F-2000 fluorescence spectrophotometer (excitation k ¼
365 nm, emission k ¼ 445 nm, 10 nm band width), and
expressed as moles of active site [17].
1D and 2D gel electrophoresis
SDS/PAGE (1D) was performed on 10% polyacrylamide
slab gels on a mini-Protean II Cell (Bio-Rad, Hemel
Hempstead). Procedures for 2D gel electrophoresis on this
apparatus were modified from the method reported previ-
ously [20,42]. Isoelectric focusing gels were prepared in glass
tubes from a degassed solution of 8.5
M
urea, 4% (w/v)
acrylamide/bisacrylamide (Bio-Rad), 2% (v/v) Chaps
detergent, 3.2% (w/v) Biolyte 5/7, 0.8% (w/v) Biolyte 3/7
(both ampholines from Bio-Rad). Mast cell preparations
which had been sonicated for 5 min or purified tryptase
were incubated in urea sample buffer [9
M
urea, 4% (w/v)
Biolyte 3/10, 2% (v/v) Chaps, 6.5 m
M
dithiothreitol,
pH 3.5] for 45 min at 20 °C, and clarified by centrifugation
at 42 000 g for 60 min at 20 °C, before loading onto gels.
Ó FEBS 2003 Heterogeneity of human mast cell tryptase (Eur. J. Biochem. 270) 271
The anolyte solution was 20 m
ML
-glutamic acid, and
50 m
ML
-arginine was the catholyte solution. Electro-
phoresis was conducted at a constant voltage of 500 V for
10 min and then at 750 V for 3.5 h. The pH gradient
established in the gel was measured using a surface pH
electrode (Unicam) placed at 5 mm intervals along the
length of the gels. The gels were extruded from the tubes
into an equilibration buffer [62.5 m
M
Tris/HCl, 10% (v/v)
glycerol, 3 m
M
dithiothreitol, 2.3% (w/v) SDS, pH 6.8] and
incubated for 10 min at 20 °C. The gels were placed on 10%
(w/v) polyacrylamide slab gels, and electrophoresis in the
second dimension was performed at a constant voltage of
175–200 V for 35–40 min. Molecular mass standards
employed were hen egg white lysozyme (14.4 kDa), soybean
trypsin inhibitor (21.5 kDa), bovine carbonic anhydrase
(31 kDa), hen egg white ovalbumin (45 kDa), bovine
serum albumin (66 kDa), rabbit muscle phosphorylase
b (97.4 kDa; all from Bio-Rad). Gels were stained with
silver stain (Bio-Rad) or were subjected to blotting.
Western blotting
Western blotting was carried out in a wet transfer system
and after blocking with 1.0% (w/v) skimmed milk power or
2% (w/v) BSA in Tris-buffered saline (TBS; 500 m
M
NaCl,
20 m
M
Tris/HCl, pH 7.5) for 1 h, blots were probed with
the antitryptase monoclonal antibody AA5 (produced as
previously described [19]) and followed by treatment with
biotinylated rabbit anti-mouse IgG (Dako, High Wycombe,
UK) and avidin–biotin peroxidase complex (Dako). Color
was developed with diaminobenzidine and hydrogen
peroxide.
Lectin binding studies
Following the standard blotting procedure, filters were
heated and blocked at 56 °C for 30 min in 100 mL TBS
containing 2% (w/v) BSA, then 0.2 mL Tween 20 was
added and incubation continued for 1 h. Horseradish
peroxidase-conjugated lectins concanavalin A (Con A),
wheat germ agglutinin (WGA), and phytohemagglutinin-L
(PHA-L; all from Sigma), were incubated with the filters for
45 min at a concentration of 5 lgÆmL
)1
,andtheblots
washed and incubated with diaminobenzidine and hydrogen
peroxide. A combination of the biotinylated lectins Sambu-
cus nigra agglutinin (SNA; 10 lgÆmL
)1
)andMaackia
amurensis agglutinin (MAA; 10 lgÆmL
)1
; both from Boeh-
ringer Mannheim) was incubated with filter for 45 min,
followed by incubation with avidin-biotin peroxidase com-
plex and color development allowed to proceed with
diaminobenzidine.
Deglycosylation
Oligosaccharides were removed from unseparated mast cell
proteins by treatment with PNGase F or neuraminidase
(both from Boehringer Mannheim) as previously described
[20]. Briefly, mast cell preparations (approximately 10
6
cells)
were heated at 95 °C for 5 min in 100 lL3m
M
EDTA,
0.2% (w/v) SDS and 2 m
M
phenylmethanesulfonyl fluoride,
10 m
M
Tris/HCl, pH 7.0. Samples were cooled and divided
into two 50 lL aliquots. To one was added 6 U PNGase F
or 0.3 U neuraminidase in 60 lL digestion buffer (3 m
M
dithiothreitol, 2% Chaps, 2 m
M
phenylmethanesulfonyl
fluoride, 100 lgÆmL
)1
hen trypsin inhibitor (type III; Sigma)
5m
M
EDTA, 10 m
M
Tris/HCl, pH 8.5), and to the other
was added 60 lL digestion buffer alone. Samples were
incubated for 8 h at 37 °C, after which proteins were
precipitated with 1 mL of 10% (v/v) trichloroacetic acid,
washed with 1% (v/v) trichloroacetic acid, redissolved in
Tris/HCl, heated at 95 °C for 5 min, and analyzed on 1D or
2D electrophoresis gels.
Substrate profile
The chromogenic substrates MeOCO-Nle-Gly-Arg-NH-
Np, tosyl-Gly-Pro-Arg-NH-Np and tosyl-Gly-Pro-Lys-
NH-Np were purchased from Boehringer; <Glu-Gly-
Arg-NH-Np, <Glu-Pro-Arg-NH-Np, Z-
D
-Arg-Gly-Arg-
NH-Np,
D
-Phe-Pip-Arg-NH-Np,
D
-Val-Leu-Arg-NH-Np,
D
-Pro-Phe-Arg-NH-Np and MeO-Suc-Arg-Pro-Tyr-NH-
Np from Chromogenix (Sweden); Bz-Arg-NH-Np and
Suc-Ala-Ala-Pro-Phe-NH-Np from Sigma. Substrates were
dissolved in dimethyl sulfoxide to 88.8 m
M
, and diluted in
assay buffer (1.0 mgÆmL
)1
BSA, 1.0
M
glycerol, 0.10
M
Tris/
HCl, pH 8.0) to 0.555 m
M
.As90lL of assay mixture was
addedto10lL sample, the final substrate concentration
was 0.50 m
M
. Samples of tryptase for assay were adjusted to
1.0
M
NaCl, 0.10 m
M
Tris/HCl (pH 8.0), to produce an
ionic strength of approximately 0.15
M
in the final reaction
mixture. Assays were conducted in triplicate in microtiter
plates at room temperature [43].
Enzyme kinetics
Assays were conducted as for the substrate profile except
that the substrate concentration was varied from 0.025 m
M
to 4.0 m
M
and the concentration of dimethylsulfoxide was
kept constant at 4.5% (v/v). Assignment to kinetic type was
based on plots of v vs. [S] and [S]/v vs. [S] (Hanes’ plot), and
on comparison of different mathematical models to obtain
the best fit. Kinetic constants for combinations of enzyme
and substrate that displayed Michaelis–Menten kinetics,
positive cooperativity, or negative cooperativity were deter-
mined by a direct fit of nontransformed data to either the
Michaelis–Menten equation or the Hill equation using the
curve-fit function of
FIG
.
P
software (version 2.7), while for
those that followed simple substrate inhibition, the constants
were determined by a binomial curve fit to the Hanes’ plot.
Mathematical modeling
Modeling was carried out on a spreadsheet (
QUATTRO PRO
).
Values of v and [S]/v were calculated for 100 different values
of [S] for each combination of input parameters of K
m
, k
cat
and enzyme concentration. The values for the concentration
of each isoform were adjusted so that the total amount of
enzyme was the same for each scenario. Residuals from
curve fits were calculated with the
SPSS
statistical package.
pH profile
The activity of purified tryptases from lung and skin was
determined with 0.5 m
M
<Glu-Pro-Arg-NH-Np in buffers
272 Q. Peng et al. (Eur. J. Biochem. 270) Ó FEBS 2003
formulated to maintain a constant ionic strength (I ¼ 0.15)
[44]. These contained either 50 m
M
acetic acid, 50 m
M
Aces,
100 m
M
Tris, 50 m
M
NaCl (pH 4.0–6.5) or 100 m
M
Aces,
52 m
M
Tris, 52 m
M
2-amino-2-methylpropanol, 50 m
M
NaCl (pH 6.0–10.5). Each reaction mixture also contained
0.9 mgÆmL
)1
BSA and 0.6% (v/v) dimethylsulfoxide.
Tryptase samples were formulated in 0.12
M
NaCl, 50 m
M
Tris/HCl, pH 7.6 with or without the addition of heparin.
Assays were conducted in triplicate in microtiter plates at
20 °C[43].
Results
Lung mast cell tryptase
Two-dimensional gel electrophoresis of lung mast cell
lysates revealed numerous silver-stained proteins ranging
in molecular mass from approximately 16–120 kDa within
the selected pH range of 5.0–6.7 (Fig. 1A). The patterns
obtained with 10 different preparations of lung tissues were
of broadly similar appearance. There was a series of
intensely stained bands with pI of 5.1–6.3 and molecular
masses of 30–37 kDa, which were identified as tryptase by
Western blotting with monoclonal antibody AA5 (Fig. 1B).
Some 9–12 diffuse bands of lung tryptase were detected
and the most dense fell within the pH range 5.6–5.9, and had
molecular masses of 30–35 kDa. The molecular mass of the
diffuse bands increased with declining pI from 6.2 to 5.1.
The greatest range of molecular mass was found for forms
of tryptase with isoelectric points between 5.1 and 5.6. The
staining pattern obtained for tryptase was very consistent
when the same preparation of mast cell lysate was analyzed
on different occasions (not illustrated). However, there were
differences in the range of both molecular mass and
isoelectric point of tryptase from different lysates. The
greatest variability between samples was found within the pI
range of 5.1 and 5.6. In some lysates of purified lung mast
cells, tryptase bands were absent within the molecular mass
range of 30–37 kDa and the pI range of 5.1–5.6 (Fig. 1E).
The size and charge range calculated for these bands is
shown for lysates of 10 different lung mast cell preparations
examined (Table 1).
In four out of the 10 lung mast cell lysates prepared, there
were bands with molecular mass of some 12–25 kDa which
reacted with AA5 (Fig. 1B–D; Table 1). These may repre-
sent degradation products of tryptase. Additional bands of
62–76, 88–98 and 120–135 kDa which might represent
dimers, trimers and tetramers of tryptase were observed in
five of the 10 preparations. Monomeric tryptase was the
major form present, and was represented by bands which
were much larger and more intense than those for dimeric
tryptase. There was in all cases a corresponding reduction in
band size and staining intensity with increasing degree of
oligomerization, so that in some cases the multimeric forms
were difficult to discern.
Purified preparations of lung tryptase exhibited bands
corresponding to the dominant monomeric tryptase bands
seen in mast cell lysates, except that they appeared to be
less diffuse. Purified tryptase had a similar range of
molecular masses and pI values as did the mast cell
lysates, which suggests that the purified tryptase was
representative of the unfractionated tryptase within intact
mast cells (Fig. 1F; Table 1). This was a consistent finding
with purified lung tryptase, whether isolated by heparin
agarose and gel filtration (n ¼ 4) or by heparin agarose
and immunoaffinity chromatography (n ¼ 1). The degra-
dation products observed in certain of the lung mast cell
lysates were not detected in any of the five purified lung
tryptase preparations, although the multimeric forms were
observed.
Skin mast cell tryptase
Lysates of purified skin mast cells analyzed by 2D gel
electrophoresis with silver staining showed a pattern of
bands reminiscent of that for lung mast cells over a similar
range of pI and molecular mass. Tryptase monomers
identified in the blots of the skin mast cell lysates exhibited a
wider range of molecular mass than lung mast cell lysates
(Fig. 2; Table 1). Although the lowest molecular mass
forms of the tryptase monomers were of similar size in both
tissues, the highest molecular mass forms were of greater
size in skin mast cell lysates than the lung lysates (P <0.01,
Mann–Whitney U-test) and there was a mean difference of
3 kDa in size between two tissues. Dense bands in the acidic
region of gels (pH 5.1–5.6) were more common in skin
samples than in lung samples. Dimers, trimers and tetramers
were also observed. Degradation products were seen more
frequently in lysates of purified skin mast cells (eight out of
12) compared with lung mast cells (four out of 10). Tryptase
patterns in the lysates were similar to those observed in
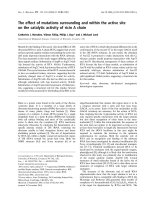
Fig. 1. Two-dimensional gel electrophoresis of lysates of purified lung
mast cells. (A) Silver stained 2D gel of sample LMC7. (B) Western blot
of same sample probed with the anti-tryptase Ig AA5. (C–E) Western
blots of preparations from other donors (LMC1, 8 and 10), and (F) a
preparation of purified lung tryptase (LT1), all probed with AA5.
Ó FEBS 2003 Heterogeneity of human mast cell tryptase (Eur. J. Biochem. 270) 273
purified preparations of skin tryptase including the presence
of breakdown products.
Identification of glycoproteins
The lectins SNA and MAA, which bind specifically to sialic
acids, bound strongly to tryptase bands identified in blots of
lysates of both lung (Fig. 3B) and skin mast cells (results not
shown), providing evidence that tryptase is sialylated. In
addition, there were certain proteins other than tryptase
which were also stained positively with SNA/MAA, which
had a molecular mass of 60–70 kDa and appeared to be
present in greater amounts in the skin lysates than in lung
lysates. Con A, a lectin which binds to mannose of
asparagine-linked oligosaccharides [45,46], also bound to
Fig. 2. Two-dimensional gel electrophoresis of lysates of purified skin
mast cells. Western blots probed with anti-tryptase Ig AA5 for (A–C)
mast cells purified from skin tissue (SMC1, 6 and 10), and (D) a
preparation of purified skin tryptase (ST2).
Fig. 3. Lectin binding to lung mast cell tryptase. Matching blots of a
lysate of lung mast cells (sample LMC2) subjected to 2D gel electro-
phoresis were probed with (A) tryptase-specific antibody AA5 (B)
lectins SNA and MAA (C) Con A and (D) WGA.
Table 1. Mean lower and upper values for molecular weight (kDa) for isoelectric point determined for immunoreactive tryptase monomers, dimers, trimers, tetramers and degradation products in Western blots of
the lysates of purified lung or skin mast cells and of preparations of tryptase purified from lung or skin tissues. The SEMs are indicated in parenthesis below the mean value.
Monomers Dimers Trimers Tetramers Degradation
Preparations Number MW pI MW pI MW pI MW pI MW pI
Lung mast cell lysates 10 30)37 5.2)6.2 65)69 5.7)6.1 92)94 5.8)6.0 125)130
a
5.7)5.9
a
13)24 5.2)5.9
(1.3) (2.0) (0.1) (0.1) (1.6) (2.8) (0.1) (0.1) (2.7) (2.9) (0.1) (0.1) – – (0.8) (1.0) (0.1) (0.1)
Skin mast cell lysates 12 29)40 5.2)6.2 63)69 5.6)5.9 90)94 5.6)5.8 125)130 5.8)5.9 15)19 5.4)5.9
(1.8) (1.7) (0.1) (0.1) (2.8) (3.4) (0.1) (0.1) (5.6) (5.3) (0.1) (0.1) (5.6) (5.6) (0.1) (0.1) (1.8) (1.7) (0.1) (0.1)
Lung tryptase 5 30)39 5.2)6.1 64)68
a
5.8)6.1
a
92)100
b
5.7)6.0
b
125)130
b
5.7)5.9
b
––
(1.2) (1.4) (0.1) (0.1)
Skin tryptase 3 29)40 5.2)6.0 63)69
a
5.4)5.8
a
(2.0) (2.2) (0.1) (0.2)
a
Detected in two blots only.
b
Detected in just one blot.
274 Q. Peng et al. (Eur. J. Biochem. 270) Ó FEBS 2003
tryptase from both lung (Fig. 3C) and skin lysates (results
not shown). WGA, a lectin which binds specifically to
N-acetylglucosamine and to a certain extent to sialic acids as
well [47,48], also bound to tryptase (Fig. 3D). All tryptase
bands recognized by AA5 antibody bound to each of the
lectins. There seemed to be stronger SNA/MAA-binding,
but weaker WGA-binding, to skin than to lung tryptase,
though a similar difference was not observed in the intensity
of staining with AA5 antibody. The lectin PHA-L, a lectin
which is selective for complex-type structures which are at
least triantennate [49,50], did not bind to any of the
separated lung or skin mast cell preparations, so the
complex-type carbohydrate in tryptase is more likely to be
mono-antennate or bi-antennate.
Deglycosylation of tryptase
Incubation of lung or skin mast cell lysates with PNGase F
to remove asparagine-linked carbohydrates resulted in a
reduction in the molecular mass of tryptase on blots and a
sharpening of the bands (Fig. 4). There was a greater
reduction in the molecular mass of skin tryptase (from
29–38 to 26–29 kDa for the monomers) than for lung
tryptase (30–34 to 26–30 kDa). The molecular mass of
purified lung tryptase was also reduced following treatment
with PNGase F (Fig. 5), though to a lesser extent (from
30–36 to 30–33 kDa on blots probed with AA5) than with
tryptase in the lung mast cell lysates. Lectin binding studies
with SNA/MAA indicated that carbohydrate chains (and
sialic acid residues) had to a large extent been removed by
treatment with PNGase F.
In the 2D gel analysis, Western blots of tryptase
incubated with PNGase F under denaturing conditions
indicated that the reduction in molecular size affected bands
of different charge differently (Fig. 5). Overall the molecular
size of monomeric lung tryptase was reduced from 30–38 to
27–34 kDa. The greatest reduction in size was observed for
tryptase forms in the pH range 5.2–5.6, while the dominant
dense bands with pI of 5.6–5.9 showed only a marginal
reduction in molecular weight. PNGase F treatment was
also associated with a narrowing in the range of pI values
from 5.2–6.2 to 5.4–6.0. Where present, the size of
multimeric forms of tryptase was also reduced, with the
greatest reductions again in the bands in the acidic range.
Incubation of tryptase with PNGase F markedly reduced
the ability of the lectins SNA/MAA to bind to blots, which
indicates that most sialic acid residues had been removed
with the N-linked carbohydrates (results not shown).
Treatment of tryptase with neuraminidase resulted in a
reduction in molecular mass from 28–43 to 26–38 kDa
(Fig. 6). Neuraminidase also induced a narrowing in the pI
range from 5.2–6.3 to 5.5–6.1, and fewer distinct bands were
observed in the pH 5.6–6.1 region.
Substrate profile
The action of four separate isolates of tryptase (L1 and L2
from lung and S1 and S2 from skin) was tested on a range of
substrates, each at 0.50 m
M
,andcomparedwiththe
standard assay with the substrate Bz-Arg-NH-Np
(Table 2). There were differences in activity between tryp-
tase preparations, but the differences between the two skin
isolates were greater than those between lung and skin. This
can be seen particularly with Z-
D
-Arg-Gly-Arg-NH-Np: the
molar catalytic activity of L1 was less than a third of that of
L2 while the activities of L2, S1, and S2 were all much the
same. Although the values for molar catalytic activity
Fig. 5. The effect of deglycosylation on the size, charge and lectin-binding
properties of tryptase, as revealed by 2D gel electrophoresis. Blots of
purified lung tryptase, which had been incubated in the absence (A) or
presence (B) of PNGase F, were probed with AA5 antibody.
Fig. 4. Effect of PNGase F on tryptase molecular mass. Lysates of
purified mast cells from lung or skin were incubated in the absence (–)
or presence (+) of PNGase F. Samples were analyzed by SDS/PAGE
and Western blotting with antibody AA5.
Ó FEBS 2003 Heterogeneity of human mast cell tryptase (Eur. J. Biochem. 270) 275
differed between isolates, the relative order of substrate
preference was virtually the same for all four preparations.
Comparison of tosyl-Gly-Pro-Arg-NH-Np with tosyl-Gly-
Pro-Lys-NH-Np revealed a preference of an approximately
1.5-fold for arginine over lysine at the P1 position, while
comparison of <Glu-Pro-Arg-NH-Np with <Glu-Gly-
Arg-NH-Np indicated a strong preference (approximately
eightfold) for proline over glycine at position P2. Indeed, all
four tryptase isolates favored substrates with proline at P2
over all other substrates tested, while the substrate with the
6-membered-ring analog of proline, pipecolic acid, at P2
ranked next.
Kinetics
Efforts to determine the kinetic constants of the different
isolates of tryptase for each of the substrates produced a
range of behavior including standard Michaelis–Menten
kinetics (Fig. 7A,E), substrate inhibition (Fig. 7B,F), posit-
ive cooperativity (Fig. 7C,G), and negative cooperativity
(Fig. 7D,H). The results are summarized in Table 3. Dis-
crepancies between the data and the standard Michaelis–
Menten model were not as obvious on v vs. [S] plots
(Fig. 7C,D) as they were on the Hanes’ plot (Fig. 7G,H) or in
plots of the residuals (results not shown). Identification of the
type of kinetics for a particular combination of enzyme and
substrate was based on the shape of the Hanes’ plot (linear
for Michaelis–Menten kinetics, concave upwards for sub-
strate inhibition and positive cooperativity, and concave
downwards for negative cooperativity) and the best fit to
alternative mathematical models. The decision could be
subjective in a few cases; for example, although S2 gave a
reasonable fit to the substrate inhibition model with Z-
D
-
Arg-Gly-Arg-NH-Np, the estimated value of K¢ was much
higher than the range of [S] used, so that for practical
purposes, the enzyme was deemed to obey Michaelis–
Menten kinetics. Also, although Hill coefficients greater
than 1.2 were usually accompanied by clear sigmoidal
behavior at low substrate concentrations, at other times were
not, e.g. with all tryptase isolates in the presence of Z-
D
-Arg-
Gly-Arg-NH-Np. In these cases it appeared the computa-
tional algorithm was driven by the flattening or decrease of
activity at high substrate concentration rather than by any
sigmoidal behavior at low substrate concentration.
The behavior differed from substrate to substrate and
from isolate to isolate (Table 3). For example, although
consistent K
0.5
-values were obtained for the four tryptase
Table 2. Activity of different purified preparations of tryptase against a range of substrates. All substrates were at a concentration of 0.50 m
M
, except
for the Bz-Arg-NH-Np standard, which was at 0.9 m
M
.
Substrate
Molar catalytic activity (katal per mol active site)
Lung tryptase Skin tryptase
L1 L2 S1 S2
<Glu-Pro-Arg-NH-Np 42.9 ± 0.9 43.9 ± 1.3 78.9 ± 4.7 44.5 ± 2.2
Tosyl-Gly-Pro-Arg-NH-Np 35.5 ± 0.8 32.9 ± 0.7 62.3 ± 3.7 36.2 ± 1.1
Tosyl-Gly-Pro-Lys-NH-Np 29.9 ± 0.3 20.4 ± 0.2 41.1 ± 2.4 22.8 ± 0.6
D
-Phe-Pip-Arg-NH-Np 18.2 ± 1.5 20.7 ± 1.9 31.8 ± 2.6 19.1 ± 1.2
MeOCO-Nle-Gly-Arg-NH-Np 10.6 ± 0.1 9.85 ± 0.12 14.8 ± 0.9 7.81 ± 0.25
<Glu-Gly-Arg-NH-Np 6.53 ± 0.13 5.24 ± 0.07 8.95 ± 0.53 4.99 ± 0.19
Z-
D
-Arg-Gly-Arg-NH-Np 1.05 ± 0.06 3.40 ± 0.16 3.90 ± 0.23 3.22 ± 0.07
D
-Val-Leu-Arg-NH-Np 4.12 ± 0.08 2.90 ± 0.03 5.28 ± 0.32 3.22 ± 0.06
Bz-Arg-NH-Np 1.50 ± 0.09 1.35 ± 0.06 1.50 ± 0.09 1.47 ± 0.04
D
-Pro-Phe-Arg-NH-Np 1.14 ± 0.07 1.29 ± 0.04 1.16 ± 0.07 1.46 ± 0.05
Suc-Ala-Ala-Pro-Phe-NH-Np < 0.01 < 0.01 < 0.01 < 0.01
MeO-Suc-Arg-Pro-Tyr-NH-Np < 0.01 < 0.01 < 0.01 < 0.01
Fig. 6. The effect of desialylation on the size, charge and lectin-binding
properties of tryptase, as revealed by 2D gel electrophoresis. Blots of
purified lung tryptase, which had been incubated in the absence (A) or
presence (B) of neuraminidase, were probed with AA5 antibody.
276 Q. Peng et al. (Eur. J. Biochem. 270) Ó FEBS 2003
preparations with tosyl-Gly-Pro-Lys-NH-Np and
D
-Phe-
Pip-Arg-NH-Np, there was a 16-fold difference in K
m
values for Bz-Arg-NH-Np between isolates L1 and S1.
Different kinetics between isolates towards the same sub-
strate were obtained for
D
-Val-Leu-Arg-NH-Np, Bz-Arg-
NH-Np, and
D
-Pro-Phe-Arg-NH-Np. The disparity in
activity between isolates from the same tissue was often
greater than that between tissues.
Mathematical modeling
The possibility that the variety of kinetic patterns observed
was the consequence of a heterogeneous population of
tryptase isoforms, each with its own values of K
m
and k
cat
,
was examined by mathematical modeling. In this model,
each isoform was assumed to be independent of all other
isoforms and to obey simple Michaelis–Menten kinetics
(Eqn 1):
v ¼
k
1
E
1
s
s þ K
m1
þ
k
2
E
2
s
s þ K
m2
þ
k
3
E
3
s
s þ K
m3
þ
k
4
E
4
s
s þ K
m4
þ
k
5
E
5
s
s þ K
m5
þ
k
6
E
6
s
s þ K
m6
ð1Þ
A range of values were chosen for k
i
,E
i
and K
mi
, and v and
s/v were calculated. If all forms had the same K
m
but
different concentrations or k
cat
values, then the Hanes’ plot
was linear (r
2
¼ 1.0000), yielding the input value of K
m
as
K
m
and a weighted average of the input values of k
cat
as the
computed value of k
cat
(case 1 of Fig. 8A). If each form had
a different value of K
m
, however, although the Hanes’ plot
might appear linear (e.g. case 2 of Fig. 8A), r
2
was not unity
and a plot of residuals indicated that the Hanes’ plot was a
curve concave downwards (Fig. 8B). This curvature could
be made more readily apparent by altering [E
i
]valuesaswell
as K
mi
values (case 4 of Fig. 8A). In all cases modeled, the
curve was concave downwards, never upwards as most
deviations from linearity were with tryptase. This shape of
curve for multiple forms of an enzyme is in agreement with
that previously reported for a binary mixture [51 and
references cited therein].
In order to determine whether the curve of the Hanes’
plot of this model could ever be concave upwards, the
general case was considered. For n independent forms of an
enzyme,eachwithitsownvaluesofK
m
, k
cat
and concen-
tration and obeying Michaelis–Menten kinetics, the Hanes’
plot takes the form
s
v
¼
s
n
þ a
nÀ1
s
nÀ1
þ a
nÀ2
s
nÀ2
þÁÁÁþa
2
s
2
þ a
1
s þ a
0
b
nÀ1
s
nÀ1
þ b
nÀ2
s
nÀ2
þÁÁÁþb
2
s
2
þ b
1
s þ b
0
ð2Þ
where a
i
and b
i
are derived from the input parameters.
At s ¼ 0,
s
v
¼
a
0
b
0
where a
0
¼ K
m1
K
m2
K
m3
… K
mn
and b
0
¼ k
1
E
1
(K
m2
K
m3
… K
mn
)+k
2
E
2
(K
m1
K
m3
… K
mn
)+… + k
i
E
i
(K
m1
K
m3
… K
mi)1
K
mi+1
… K
mn
)+ … + k
n
E
n
(K
m1
K
m3
… K
mn-1
)
This simplifies to
s
v
¼
1
k
1
E
1
K
m1
þ
k
2
E
2
K
m2
þÁÁÁþ
k
n
E
n
K
mn
ð3Þ
At very large values of s, the Hanes’ equation approaches
s
v
¼
s
n
þ a
nÀ1
s
nÀ1
b
nÀ1
s
nÀ1
¼
s
b
nÀ1
þ
a
nÀ1
b
nÀ1
ð4Þ
where a
n)1
¼ S K
mi
and b
n)1
¼ S k
i
E
i
.
Fig. 7. Variety of kinetic patterns observed with tryptase. Results are plotted as rate of reaction (v) vs. substrate concentration ([S]) (A–D) and as [S]/v
vs. [S] (the Hanes plot) (E–H). Examples of kinetic types are Michaelis–Menten kinetics (A,E) obtained with <Glu-Pro-Arg-NH-Np and tryptase S1,
substrate inhibition (B,F) obtained with Z-
D
-Arg-Gly-Arg-NH-Np and tryptase S1, positive cooperativity (C and G) obtained with MeOCO-Nle-
Gly-Arg-NH-Np and tryptase S1, and negative cooperativity (D,H) obtained with
D
-Pro-Phe-Arg-NH-Np and tryptase L1. Solid curves are those fit
to the corresponding mathematical model. Dotted curves (C,D) are those fit to the Michaelis–Menten equation with the same data.
Ó FEBS 2003 Heterogeneity of human mast cell tryptase (Eur. J. Biochem. 270) 277
Thus, the curve for the Hanes plot asymptotically
approaches a line which has as its slope 1/(sum of the V
max
values for each isoform) and a y-intercept which can be
rewritten
s
v
¼
1
k
1
E
1
P
K
mi
þ
k
2
E
2
P
K
mi
þÁÁÁþ
k
n
E
n
P
K
mi
ð5Þ
The Hanes curve can only ever be concave upwards if its
value at x ¼ 0 is greater than the y-intercept of the
asymptote. Comparison of the terms in the denominators
of Eqns 3 and 5 shows that for positive values of K
mi
,the
terms of the denominator of Eqn 5 will always be less than
the corresponding terms in Eqn 3. As the number of terms is
the same for both equations, the value of the y-intercept for
the asymptote will always be greater than the value of the
Table 3. Kinetic constants for combinations of enzyme and substrate tested.
Enzyme
batch
[S] range
(m
M
)
Kinetics
type
a
Hill
coefficient
K¢
b
(m
M
)
K
m
(K
0.5
)
c
(m
M
)
k
cat
(s
)1
)
k
cat
/K
m
(k
cat
/K
0.5
)
(s
)1
Æ
M
)1
)
<Glu-Pro-Arg-NH-Np
L1 0.05–2.0 MM 0.95 – 0.37 56.4 151 000
L2 0.05–2.0 MM 0.90 – 0.64 56.9 88 000
S1 0.05–2.0 MM 1.04 – 0.42 106.6 251 000
S2 0.05–2.0 MM 0.98 – 0.42 100.7 239 000
Tosyl-Gly-Pro-Lys-NH-Np
L1 0.05–2.0 PC 1.74 – 0.35 40.0 114 000
L2 0.05–2.0 PC 1.62 – 0.49 27.9 57 300
S1 0.05–2.0 PC 1.35 – 0.44 75.5 172 000
S2 0.05–2.0 PC 1.36 – 0.44 45.9 104 000
D
-Phe-Pip-Arg-NH-Np
L1 0.1–4.0 PC 1.37 – 0.78 51.0 65 200
L2 0.1–4.0 PC 1.39 – 0.79 24.1 30 700
S1 0.1–4.0 PC 1.46 – 0.70 59.5 85 000
S2 0.1–4.0 PC 1.25 – 0.78 27.1 34 800
MeOCO-Nle-Gly-Arg-NH-Np
L1 0.1–4.0 PC 1.76 – 0.58 22.9 39 800
L2 0.1–4.0 PC 1.61 – 1.04 15.2 14 600
S1 0.1–4.0 PC 1.64 – 0.83 43.8 52 800
S2 0.1–4.0 PC 1.49 – 1.16 30.5 26 300
<Glu-Gly-Arg-NH-Np
L1 0.1–4.0 MM 0.98 – 5.03 60.6 12 000
L2 0.1–4.0 Linear 0.88 – > 12 – 4400
S1 0.1–4.0 MM 0.98 – 10.5 183 17 400
S2 0.1–4.0 Linear 0.87 – > 12 – 8100
Z-
D
-Arg-Gly-Arg-NH-Np
L1 0.025–4.0 SI 2.09 3.17 0.04 1.9 44 500
L2 0.025–1.0 SI 1.35 5.62 0.23 3.0 18 200
S1 0.025–4.0 SI 1.37 1.07 0.36 10.3 28 800
S2 0.025–1.0 MM (SI) 1.29 (32.6) 0.15 5.4 35 900
D
-Val-Leu-Arg-NH-Np
L1 0.1–4.0 MM 1.04 – 3.49 21.1 6050
L2 0.1–4.0 PC 1.66 – 1.12 7.1 6340
S1 0.1–4.0 MM 0.96 – 3.11 31.0 9970
S2 0.1–4.0 PC 1.28 – 1.41 16.3 11 600
Bz-Arg-NH-Np
L1 0.1–4.0 PC 1.32 – 0.30 1.66 5630
L2 0.1–4.0 PC 1.35 – 1.19 2.51 2110
S1 0.1–4.0 MM 1.00 – 4.85 8.9 1840
S2 0.1–4.0 MM 0.99 – 2.36 6.51 2760
D
-Pro-Phe-Arg-NH-Np
L1 0.1–4.0 NC 0.48 – 13.5 5.0 370
L2 0.1–4.0 MM 0.85 – 1.64 2.8 1690
S1 0.1–4.0 MM 0.97 – 2.59 5.3 2060
S2 0.1–4.0 MM 0.87 – 1.75 5.2 3000
a
MM, Michaelis–Menten; PC, positive cooperativity; NC, negative cooperativity; SI, Michaelis–Menten kinetics with substrate inhibition.
b
K¢ ¼ dissociation constant for second (inhibitory) substrate molecule from enzyme–substrate complex: ES + S Ð ES
2
.
c
Values are K
m
for systems obeying Michaelis–Menten or substrate inhibition kinetics, and K
0.5
for systems displaying positive or negative cooperativity.
278 Q. Peng et al. (Eur. J. Biochem. 270) Ó FEBS 2003
Hanes curve at x ¼ 0. Therefore, for real enzymes, which
can only have positive values of K
m
, the presence of a
multiplicity of isoforms, each obeying Michaelis–Menten
kinetics, can not mimic the behavior of a single form
displaying sigmoidal kinetics or substrate inhibition.
However, a multiplicity of isoforms could account for the
behavior of tryptase L1 with
D
-Pro-Phe-Arg-NH-Np
(Fig. 7D,H). The data for this substrate-isolate pair did fit
to a two-enzyme model, but the iteration converged on an
unrealistically high value for K
m
for the second enzyme
(42 000 m
M
). Alternatively, if the second enzyme was
treated as being in the linear range (as was observed with
<Glu-Gly-Arg-NH-Np), a very good fit was obtained, with
K
m
and V
max
values of 0.20 m
M
and 1.14 s
)1
, respectively,
for the first enzyme, and a V
max
/K
m
ratio of 187 s
)1
Æ
M
)1
for
the second enzyme. (V
max
, rather than k
cat
, values pertain in
this case, as the model does not resolve the relative
proportions of the two enzymes.)
pH profile
The activity of lung (L1) and skin (S1) tryptase over a pH
range of 4.0–10.5 was determined using <Glu-Pro-Arg-NH-
Np as substrate, both in the presence (100 lgÆmL
)1
)and
absence of heparin (molecular mass range of 13–15 kDa)
(Fig. 9). There was no apparent difference between the two
isolates. For both isolates, heparin had little effect, except at
pH 10.0, where it offered some degree of stabilization. In the
presence of heparin at this pH, the progress curves showed an
exponential loss of activity with a half-life of 3.3 and 3.8 min
for lung and skin tryptases, respectively. In the absence of
heparin at this pH, activity was almost completely lost during
the interval between addition of substrate and the first
reading (1 min). At pH values £ 9.5, all progress curves
were linear throughout the course of the assay (14 min),
whether or not heparin was present.
Discussion
We have found human tryptase to be highly heterogeneous
in size, charge and activity, and that differences are related
not just to the tissue source, but also to the individual from
whom cells were collected or from whom the enzyme was
purified. Lectin-binding and glycosidase studies have shown
that differences in glycosylation contribute significantly to
this microheterogeneity in size and charge, but the present
evidence does not rule out a possible contribution from
multiple alleles or genes. The chemical basis for the marked
differences in activity and kinetic behavior was not ascer-
tained, but mathematical modeling ruled out the possibility
that such diversity could arise through a mixture of isoforms
obeying hyperbolic kinetics, but with differing values of K
m
and k
cat
.
Fig. 9. pH profile of human skin and lung tryptase in the presence and
absence of heparin. (j) skin tryptase, no heparin (h) skin tryptase +
100 lgÆmL
)1
heparin (d) lung tryptase, no heparin (s)lungtryptase+
100 lgÆmL
)1
heparin.
Fig. 8. Mathematical modeling of the behavior of a mixture of isoforms
of an enzyme. (A) Hanes plot of a theoretical mixture of 5 isoforms of
an enzyme for the following cases: (1) [E1] ¼ [E2] ¼ [E3] ¼ [E4] ¼E5];
K
m1
¼ K
m2
¼ K
m3
¼ K
m4
¼ K
m5
; k
cat1
< k
cat2
< k
cat3
< k
cat4
<
k
cat5
;(2)[E1]¼ [E2] ¼ [E3] ¼ [E4] ¼ [E5]; K
m1
> K
m2
>
K
m3
> K
m4
> K
m5
; k
cat1
¼ k
cat2
¼ k
cat3
¼ k
cat4
¼ k
cat5
;(3)[E1]¼
[E2] ¼ [E3] ¼ [E4] ¼ [E5]; K
m1
> K
m2
> K
m3
> K
m4
> K
m5
;
k
cat1
< k
cat2
< k
cat3
< k
cat4
< k
cat5
; (4) [E1]>[E2]>[E3]>
[E4] > [E5]; K
m1
> K
m2
> K
m3
> K
m4
> K
m5
; k
cat1
¼ k
cat2
¼
k
cat3
¼ k
cat4
¼ k
cat5
. (B) plot of the standardized residuals for a linear
regression fit to the data generated by case 2 above.
Ó FEBS 2003 Heterogeneity of human mast cell tryptase (Eur. J. Biochem. 270) 279
The results of our 2D gel studies are in agreement with
and extend the findings of Benyon et al.[20],whoexamined
lysates of skin mast cells. We also observed a similar degree
of microheterogeneity in mast cells isolated from lung and in
tryptase purified from both sources. This technique gave a
clear separation of different forms of tryptase on the basis of
isoelectric point (the first dimension), but not on the basis of
size. Rather, a gradation was seen between the lower and
higher molecular mass forms of tryptase of similar isoelec-
tric point. A situation analogous to that observed with one
dimensional gel electrophoresis, in which two [16,17] or
more [18] distinct forms differing in size by 2–4 kDa were
resolved, was not seen using the more sensitive procedure.
There was some association between pI and molecular
mass. With declining pI, the size of tryptase monomers
showed a gradual increase, consistent with a correlation
between the degree of sialylation and size/number of
N-linked oligosaccharides.
The results of the lectin-binding studies together with the
effects of treatment with neuraminidase and PNGase F
indicate that much of the heterogeneity is due to differences
in glycosylation. All spots which reacted with the antitryp-
tase antibody AA5 also reacted with one or more lectins,
with the possible exception of the lowest molecular mass
spots for both lung tryptase (29 ± 1.5 kDa) and skin
tryptase (29 ± 2.4 kDa), which had masses similar to those
calculated from the amino acid sequence (approximately
27.5 kDa) [26–28]. However, these low molecular mass
forms appear to be present in only small quantities in the
preparations, suggesting that most tryptase is glycosylated,
utilizing either one or both potential N-glycosylation sites.
Tryptases a, bI, and an allelic variant of bII have two such
sites [26,28,38], while bIII and the reference sequence for bII
have only one [27,28]. The site common to all tryptases
(Asn194) occurs in a consensus Asn-X-Thr sequence, while
the additional site (Asn99) is present in an Asn-X-Ser
sequence. Efficiency of glycosylation at any particular site is
dependent on a number of possible factors [52], but the
identity of the third amino acid in the consensus sequence is
one of them. Sequences with serine in the third position tend
to be less efficiently utilized than those with threonine. Site-
directed mutagenesis studies with antithrombin III showed
that substitution of the native Ser at one site with Thr
improved the extent of glycosylation and, conversely,
replacement of native Thr with a Ser decreased the efficiency
of glycosylation at most, but not all, of the other sites [52].
Whether Asn99 is less efficiently used than Asn194 would
require further investigation, but partial glycosylation at this
site could account for some of the heterogeneity seen.
Treatments with PNGase F reduced the range of both
molecular mass and pI values, but did not reduce tryptase
to a single spot on 2D blots, probably because the
deglycosylation reaction did not go to completion, as
indicated by the continued reaction with lectin. A
reduction in the molecular mass following PNGase F
treatment has been reported previously with skin (31–36
to 30 kDa) [20], and pituitary tryptase (32.4–36.3 to
32.4 kDa) [18]. It is not clear why a decrease in the size of
lung tryptase with PNGase F treatment has not been
observed by other workers [16,18]. Treatment of tryptase
with neuraminidase, which removes sialic acid residues,
resulted in a smaller, but significant, reduction in
molecular mass. As the sialic acid residue has a formula
mass of 291 Da, these results would suggest extensive
sialylation of the tryptase molecule.
Lectin binding studies provide additional evidence for
extensive sialylation as indicated by the strong reaction with
SNA/MAA. Mannose is also present in most isoforms of
tryptase as shown by reaction with Con A. Although Con A
binds strongly to high-mannose type of oligosaccharide, it
also binds to relatively small complex-type structures with a
low degree of branching [45,46]. Lectin histochemical
studies have indicated that the high-mannose type was not
a major class in mast cell granules because of the lack of an
effect of a-mannosidase on the binding of Con A [53]. This
would suggest that tryptase, the major granular constituent,
is not a high mannose type of glycoprotein, and that positive
staining achieved with Con A may reflect the presence of
mannose only in the backbone of complex-type oligosac-
charides with a low degree of branching. The failure of
PHA-Ltobindtotryptaseprovidesfurtherevidencefora
low degree of branching [49,50]. The presence of complex-
type carbohydrates is supported by the reaction with WGA,
which can bind N-acetyl-
D
-glucosamine residues, but can
also bind some sialyl residues [47,48].
The present evidence does not rule out a possible
contribution to the observed heterogeneity from multiple
genes or alleles. On the basis of thetwo-locus model proposed
by Soto and coworkers [34], allelic variation at the first locus
between a and bI, and at the second locus between bII and
bIII, would give rise to nine possible genotypes (aabIIbII,
aabIIbIII, aabIIIbIII, abIbIIbII, abIbIIbIII, abIbIIIbIII,
bIbIbIIbII, bIbIbIIbIII, bIbIbIIIbIII). Additional complex-
ity is generated by the existence of numerous SNPs for both
tryptase loci, including six amino acid variants and two
frameshift mutants for bII-tryptase and six amino acid
variants for a-tryptase [38]. The antitryptase antibody used in
this study reacts equally well with both a-andbII-tryptase
[54], and in view of the very high homology between the
b-tryptases, would be expected to cross-react readily with bI
and bIII as well, and probably with most SNPs. Therefore,
any or all of these genetic variants could be contributing to
the observed heterogeneity. However, a comparison of
immunoassays, which differ in their affinity for a-tryptase
but have similar affinities for b-tryptase, suggested that
a-tryptase is constitutively secreted whilst b-tryptase is stored
in the granules of developing mast cells [36]. In support of this
scheme is the delineation of a possible mechanism for sorting
the a-andb-proenzymes to different post-Golgi pathways
[37]. If this were indeed the case, and a-tryptase made a
negligible contribution to the observed heterogeneity, exam-
ination of the above genotypes indicates that there would still
be ample scope for a genetic contribution to the micro-
heterogeneity within any particular sample and also to the
diversity seen between different samples.
The reported crystal structure of this enzyme [23] does not
shed any light on the degree or nature of its glycosylation as
the oligosaccharide chains were not seen, presumably
because the heterogeneity in carbohydrate structure was
ÔseenÕ as disorder. However, examination of the crystal
structure (ref 1A0L) through the website .
ac.uk and
FIRSTGLANCE
software showed the potential
N-glycosylation sites Asn194 (Asn204 by chymotrypsinogen
numbering) and Asn99 (Lys112 in the structure of Pereira
280 Q. Peng et al. (Eur. J. Biochem. 270) Ó FEBS 2003
et al.) are exposed on the surface of the enzyme along the
outer edge of the ring formed by the tetramer (Fig. 10)
where they might be expected to be readily accessible to
oligosaccharide transfer from dolichol pyrophosphate.
These putative glycosylation sites are well away from the
central pore containing the active sites, so are unlikely to
cause steric hindrance with any substrate. They are also
away from the putative heparin-binding site, a region of
positive surface charge extending along the left- and right-
hand sides of the ring in Fig. 10A [23]. This region is
comprised of five histidines, nine lysines, and four arginines
in each subunit. The pH profile data suggest that as the pH
increases, there is still sufficient protonation of the lysines at
pH 10, along with the fully protonated arginines, to interact
with the heparin to delay inactivation of the enzyme, but by
pH 10.5, too many of the lysine residues have become
deprotonated for heparin to afford any stability.
Although there were broad similarities in the range of pI
expressed and in the patterns obtained as well as significant
variation between donors, consistent differences did emerge
between lung and skin tryptase. Lung tryptase exhibited a
narrower range of molecular masses than did skin tryptase
on 2D gels, which suggests a narrower size distribution in
the associated oligosaccharides. Differences in composition
of these carbohydrates were also suggested by differences in
staining intensity in lectin binding studies. The lectins SNA/
MAA appeared to have a higher affinity for skin tryptase
than for lung tryptase. In contrast, the lectin WGA seemed
to have a higher affinity for the isoforms found in lung than
those in skin. This may indicate that tryptase in skin mast
cells may have higher degree of sialylation whilst tryptase in
lung mast cells may have more terminal N-acetylglucosa-
mine residues. These differences in physicochemical prop-
erties between tryptase from different anatomical sites could
reflect important differences in function, such as turnover,
targeting, and activity. The nature of the factors controlling
post-translational modification remains to be elucidated,
but are likely to be affected by local environmental
conditions and by mast cell phenotype. Disease state might
also affect these processes with important implications for
the pathogenesis of allergic diseases.
Other differences observed on 2D gels between the lysates
of lung and skin mast cells include the relative abundance of
degraded and oligomeric forms of tryptase. Although
breakdown products of tryptase were observed in prepara-
tions from both sources of tissue investigated, they were
detected more frequently in skin preparations (eight out of
12 lysates) than in lung preparations (four out of 10 lysates),
which suggests that either skin tryptase is more easily
degraded or skin mast cells contain higher amount of a
protease which can degrade it. As most preparations of
purified tryptase did not contain any breakdown products,
it is unlikely that these spots are the result of autodigestion.
It is perhaps relevant that lysates of mast cells isolated from
skin contain tenfold higher levels of chymotryptic activity
than do purified lung mast cells [55]. One very likely
explanation for the appearance of dimeric, trimeric and
tetrameric forms of tryptase is that sulfydryl groups reduced
during sample preparation are re-oxidized during electro-
phoresis in the first dimension to form intersubunit disulfide
bonds. However, when all samples were subjected to the
same conditions, it is not clear why such reoxidation would
occur more readily and to a greater extent in lysates of skin
mast cells than in those of lung.
Previous comparisons of the activity of skin and lung
tryptase appeared to have examined only one preparation
of each for any given substrate [21,25], with one group
finding marked differences between the two [21], the
other finding negligible differences [25]. By examining
more than one preparation of each, we have found that
differences between separate isolates from the same tissue
can be greater than those between isolates from different
tissues. Not only did we find differences in relative
activity and in kinetic constants, e.g. a 16-fold difference
in K
m
values for Bz-Arg-NH-Np between isolates L1 and
S1, but we also found different kinetics between isolates
towards the same substrate. The variety of kinetic
behavior was somewhat surprising, but not without
precedent. Substrate inhibition, which was observed for
Z-
D
-Arg-Gly-Arg-NH-Np, has been previously reported
for Z-Trp-Arg-SBzl [21]. This behavior could perhaps be
expected for Z-
D
-Arg-Gly-Arg-NH-Np, which could
conceivably bind by either the P1 or the P3 argininyl
residue to the S1 binding pocket. Although binding via
Fig. 10. Three-dimensional structure of tryptase [23] indicating positions
of potential N-glycosylation sites. Structure viewed at .
ac.uk using a
NETSCAPE
browser and
FIRSTGLANCE
software. (A) View
showing tetrameric structure and the central pore containing the four
active sites. (B) Orthogonal view of top of the ring structure shown in
(A). Color code is black, peptide backbone; grey, nonpolar residues;
pink, uncharged polar residues; red, acidic residues; and purple, basic
residues. Tryptases a, bI, and an allelic variant of bII [38] have an
asparagine at position 99, while bIII and the reference sequence for bII
have a lysine. All isoforms have an asparagine at position 194.
Ó FEBS 2003 Heterogeneity of human mast cell tryptase (Eur. J. Biochem. 270) 281
the P3 Arg could result in cleavage of the substrate
between residues P3 and P2, this reaction would go
undetected, as the chromophore would still be covalently
linked to the peptide. Sigmoidal kinetics has been
previously reported, but in both studies, Michaelis–
Menten kinetics were converted to sigmoidal kinetics by
the addition of an effector, either increasing concentra-
tions of (NH
4
)
2
SO
4
or KCl in the absence of heparin
with Z-Gly-Pro-Arg-NH-Np as substrate [25], or hista-
mine, which at 10 m
M
displayed a Hill coefficient of 1.31
with tosyl-Gly-Pro-Lys-NH-Np as substrate [56].
In conclusion, we have demonstrated differences in the
microheterogeneity of tryptase from different tissues and
different donors and have presented evidence that much of
this microheterogeneity can be attributed to N-linked
glycosylation. The differences observed in the kinetic
properties of different preparations of purified tryptase
strongly suggest that this microheterogeneity has a direct
bearing on the enzyme’s behavior and this would have
important ramifications for the understanding of patho-
physiological roles of this enzyme.
Acknowledgments
We thank Luke Pearson and Matthew Brander for their technical
assistance. Financial support from Celera Corporation, South San
Francisco, CA and the National Asthma Campaign, UK, is gratefully
acknowledged.
References
1. Walls, A.F. (2000) The roles of neutral proteases in asthma and
rhinitis. In Asthma and Rhinitis,2ndedn.(Busse,W.W.&Holgate,
S.T., eds), pp. 968–997. Blackwell, Boston, USA.
2. Walls, A.F. (2000) Structure and function of mast cell tryptase. In
Mast Cells and Basophils in Physiology, Pathology and Host
Defence (Marone, G., Lichtenstein, L.M. & Galli, S.J., eds),
pp. 291–309. Academic Press, London, UK.
3. Tam, E.K. & Caughey, G.H. (1990) Degradation of airway neu-
ropeptides by human lung tryptase. Am. Rev. Respir. Cell. Mol.
Biol. 3, 27–32.
4. Walls, A.F., Brain, S.D., Desai, A., Jose, P.J., Hawkings, E.,
Church, M.K. & Williams, T.J. (1992) Human mast cell tryptase
attenuates the vasodilator activity of calcitonin gene-related pep-
tide (CGRP). Biochem. Pharmacol. 43, 1243–1248.
5. Walls, A.F., Bennett, A.F., Sueiras-Diaz, J. & Olsson, H. (1992)
The kininogenase activity of human mast cell tryptase. Biochem.
Soc. Trans. 20,260S.
6. Thomas, V.A., Wheeless, C.J., Stack, M.S. & Johnson, D.A.
(1998) Human mast cell tryptase fibrinogenolysis: kinetics, anti-
coagulation mechanism, and cell adhesion disruption. Biochem-
istry 37, 2291–2298.
7. Cairns, J.A. & Walls, A.F. (1996) Mast cell tryptase is a mitogen
for epithelial cells. Stimulation of IL-8 production and inter-
cellular adhesion molecule-1 expression. J. Immunol. 156, 275–283.
8. Cairns, J.A. & Walls, A.F. (1997) Mast cell tryptase stimulates the
synthesis of type I collagen in human lung fibroblasts. J. Clin.
Invest. 99, 1313–1321.
9. He, S., Gac¸ a, M.D.A. & Walls, A.F. (1998) A role for tryptase in
the activation of human mast cells: modulation of histamine
release by tryptase and inhibitors of tryptase. J. Pharmacol. Exp.
Ther. 286, 289–297.
10. Compton, S.J., Cairns, J.A., Holgate, S.T. & Walls, A.F. (1998)
The role of mast cell tryptase in regulating endothelial cell
proliferation, cytokine release and adhesion molecule expression.
Tryptase induces expression of mRNA for IL-1b and IL-8 and
stimulates the selective release of IL-8 from HUVEC. J. Immunol.
161, 1939–1947.
11. Berger, P., Perng, D W., Thabrew, H., Compton, S.J., Cairns,
J.A., McEuen, A.R., Marthan, R., Tunon-de-Lara, J.M. & Walls,
A.F. (2001) Tryptase and agonists of protease activated receptor 2
induce the proliferation of human airway smooth muscle cells.
J. Appl. Physiol. 91, 1372–1379.
12. He, S., Peng, Q. & Walls, A.F. (1997) Potent induction of a
neutrophil and eosinophil-rich infiltrate in vivo by human mast cell
tryptase. Selective enhancement of eosinophil recruitment by
histamine. J. Immunol. 159, 6216–6225.
13. Berger, P., Compton, S.J., Molimard, M., Walls, A.F., N’Guyen,
C., Marthan, R. & Tunon de Lara, J.M. (1999) Mast cell tryptase
as a mediator of hyperresponsiveness in human isolated bronchi.
Clin. Exp. Allergy 29, 804–812.
14. Clark, J.M., Abraham, W.M., Fishman, C.E., Forteza, R.,
Ahmed, A., Cortes, A., Warne, R.L., Moore, W.R. & Tanaka,
R.D. (1995) Tryptase inhibitors block allergen induced airway and
inflammatory responses in allergic sheep. Am.J.Resp.Crit.Care
Med. 152, 2076–2083.
15. Krishna, M.T., Chauhan, A., Little, L., Sampson, K., Hawks-
worth, R., Mant, T., Djukanovic, R., Lee, T. & Holgate, S. (2001)
Inhibition of mast cell tryptase by inhaled APC 366 attenuates
allergen-induced late-phase airway obstruction in asthma.
J. Allergy Clin. Immunol. 107, 1039–1045.
16. Schwartz, L.B., Lewis, R.A. & Austen, K.F. (1981) Tryptase from
human pulmonary mast cells: purification and characterization.
J. Biol. Chem. 256, 11939–11943.
17. Smith, T.J., Hougland, M.W. & Johnson, D.A. (1984) Human
lung tryptase: purification and characterization. J. Biol. Chem.
259, 11046–11051.
18. Cromlish, J.A., Seidah, N.G., Marchinkiewicz, M., Hamelin, J.,
Johnson, D.A. & Chretien, M. (1987) Human pituitary tryptase:
molecular forms, NH
2
-terminal sequence, immunocytochemical
localization, and specificity with prohormone and fluorogenic
substrates. J. Biol. Chem. 262, 1363–1373.
19. Walls,A.F.,Bennett,A.R.,McBride,H.M.,Glennie,M.J.,Hol-
gate, S.T. & Church, M.K. (1990) Production and characteriza-
tion of monoclonal antibodies specific for human mast cell
tryptase. Clin. Exp. Allergy 20, 581–589.
20. Benyon, R.C., Enciso, J.A. & Befus, A.D. (1993) Analysis of
human skin mast cell proteins by two-dimensional gel electro-
phoresis. J. Immunol. 151, 2699–2706.
21. Tanaka,T.,McRea,B.J.,Cho,K.,Cook,R.,Fra
¨
ki, J.E., Johnson,
D.A. & Powers, J.C. (1983) Mammalian tissue trypsin-like
enzymes. J. Biol. Chem. 258, 13552–13557.
22. Little, S.S. & Johnson, D.A. (1995) Human mast cell tryptase
isoforms: separation and examination of substrate specificity
differences. Biochem. J. 307, 341–346.
23. Pereira, P.J.B., Bergner, A., Macedo-Ribeiro, S., Huber, R.,
Matschiner,G.,Fritz,H.,Sommerhoff,C.P.&Bode,W.(1998)
Human b-tryptase is a ring-like tetramer with active sites facing a
central pore. Nature 392, 306–311.
24. Schwartz, L.B. (1985) Monoclonal antibodies against human mast
cell tryptase demonstrate shared antigenic sites on subunits of
tryptase and selective location of the enzyme to mast cells.
J. Immunol. 134, 526–531.
25. Harvima, I.T., Schechter, N.M., Harvima, R.J. & Fra
¨
ki, J.E.
(1988) Human skin tryptase: purification, partial characterization
andcomparisonwithhumanlungtryptase.Biochim. Biophys.
Acta 957, 71–80.
26. Miller, J.S., Westin, E.H. & Schwartz, L.B. (1989) Cloning and
characterization of complementary DNA for human tryptase.
J. Clin. Invest. 84, 1188–1195.
282 Q. Peng et al. (Eur. J. Biochem. 270) Ó FEBS 2003
27. Miller, J.S., Moxley, G. & Schwartz, L.B. (1990) Cloning and
characterization of a second complementary DNA for human
tryptase. J. Clin. Invest. 86, 864–870.
28. Vanderslice, P., Barllinger, S.M., Tam, E.K., Goldstein,
S.M., Craik, C.S. & Caughey, G.H. (1990) Human mast
cell tryptase: multiple cDNAs and genes reveal a multigene
serine protease family. Proc. Natl Acad. Sci. USA 87,
3811–3815.
29. Pallaoro, M., Fejzo, M.S., Shayesteh, L., Blount, J.L. & Caughey,
G.H. (1999) Characterization of genes encoding known and novel
human mast ecll tryptases on chromosome 16p13.3. J. Biol. Chem.
274, 3355–3362.
30. Caughey, G.H., Raymond, W.W., Blount, J.L., Hau, L.W T.,
Pallaoro, M., Wolters, P.J. & Verghese, G.M. (2000) Charac-
terization of human c-tryptases, novel members of the chromo-
some 16p mast cell tryptase and prostasin gene families.
J. Immunol. 164, 6566–6575.
31. Wong, G.W., Tang, Y., Feyfant, E., S
ˇ
ali, A., Li, L., Li, Y.,
Huang, C., Friend, D.S., Krillis, S.A. & Stevens, R.L. (1999)
Identification of a new member of the tryptase family of
mouse and human mast cell proteases which possesses a novel
COOH-terminal hydrophobic extension. J. Biol. Chem. 274,
30784–30793.
32. Wong, G.W., Yasuda, S., Madhusudhan, M.S., Li, L., Yang, Y.,
Krillis, S.A., S
ˇ
ali, A. & Stevens, R.L. (2001) Human tryptase e
(PRSS22), a novel member of the chromosome 16p13.3 family of
human serine proteases expressed in airway epithelial cells. J. Biol.
Chem. 276, 49169–49182.
33. Min, H K., Kambe, N. & Schwartz, L.B. (2001) Human mouse
mast cell protease 7-like tryptase genes are pseudogenes. J. Allergy
Clin. Immunol. 107, 315–321.
34. Soto, D., Malmsten, C., Blount, J.L., Muilenburg, D.J. &
Caughey, G.H. (2002) Genetic deficiency of human mast cell
a-tryptase. Clin. Exp. Allergy 32, 1000–1006.
35.Xia,H.Z.,Kepley,C.L.,Sakai,K.,Chellah,J.,Irani,A.M.&
Schwartz, L.B. (1995) Quantitation of tryptase, chymase, F
c
eRIa,
and F
c
eRIc mRNAs in human mast cells and basophils by
competitive reverse transcription-polymerase chain reaction.
J. Immunol. 154, 5472–5480.
36. Schwartz, L.B., Sakai, K., Bradford, T.R., Ren, S., Zweiman, B.,
Worobic, A.S. & Metcalfe, D. (1995) The a form of human
tryptase is the predominant type present in blood at baseline in
normal subject and is elevated in those with systemic mastocytosis.
J. Clin. Invest. 96, 2702–2710.
37.Sakai,K.,Ren,S.&Schwartz,L.B.(1996)Anovelheparin-
dependent processing pathway for human tryptase autocatalysis
followed by activation with dipeptidyl peptidase I. J. Clin. Invest.
97, 988–995.
38. Guida, M., Riedy, M., Lee, D. & Hall, J. (2000) Characterization
of two highly polymorphic human tryptase loci and comparison
with a newly discovered monkey tryptase ortholog. Pharmaco-
genetics 10, 389–396.
39. Okayama, Y., Hunt, T.C., Kassel, O., Ashman, L.K. & Church,
M.K. (1993) Assessment of anti-c-kit monoclonal antibody
YB5.B8 in affinity magnetic enrichment of human lung mast cells.
J. Immunol. Methods 169, 153–161.
40. Benyon,R.C.,Lowman,M.&Church,M.K.(1987)Humanskin
mast cells: their dispersion, purification and secretory character-
ization. J. Immunol. 138, 861–867.
41. McEuen, A.R., He, S., Brander, M.L. & Walls, A.F. (1996)
Guinea pig lung tryptase: localisation to mast cells and char-
acterisation of the partially purified enzyme. Biochem. Pharmacol.
52, 331–340.
42. Abe,T.,Swieter,M.,Imai,T.,Hollander,N.D.&Befus,D.A.
(1990) Mast cell heterogeneity: two-dimensional gel electro-
phoretic analysis of rat peritoneal and intestinal mucosal mast
cells. Eur. J. Immunol. 20, 1941–1947.
43. McEuen, A.R., Sharma, B. & Walls, A.F. (1995) Regulation of the
activity of human chymase during storage and release from mast
cells: the contributions of inorganic cations, pH, heparin and
histamine. Biochim. Biophys. Acta 1267, 115–121.
44. Ellis, K.J. & Morrison, J.F. (1982) Buffers of constant ionic
strength for studying pH-dependent processes. Methods Enzymol.
87, 405–426.
45. Goldsteine,I.J.,Reichart,C.&Misaki,A.(1974)Interactionof
concanavalin A with model substrates. Ann. NY Acad. Sci. 234,
283–296.
46. Kornfeld, R. & Kornfeld, S. (1980) The structure of glycoproteins
and their oligosaccharide units. In The Biochemistry of Glyco-
proteins and Proteoglycans (Lennarz, W.I., ed.), pp. 1–34. Plenum
Press, New York, USA.
47. Allen, A.K., Neuberger, A. & Sharon, N. (1973) The purification
and specificity of wheat germ agglutinin. Biochem. J. 131, 155–162.
48. Gallagher, J.T., Harding, M. & Dale, R.E. (1983) Sialic acid as a
cell surface binding for wheat germ agglutinin. In Lectins, Biology,
Biochemistry, Clinical Biochemistry (Bog-Hansen, T.C. & Spen-
gler, G.A., eds), pp. 311–318. Walter de Gruyter, Berlin, Germany.
49. Debray,H.,Decont,D.,Strecker,G.,Spik,G.&Monteuil,J.
(1981) Specificity of twelve lectins towards oligosaccharides and
glycopeptides related to N-glycosyl proteins. Eur. J. Biochem. 117,
41–55.
50. Cummings, R.D. & Kornfeld, S. (1982) Characterization of the
structural determinants required for the high affinity interactions
of asparagine-linked oligosaccharides with immobilized Phaseolus
vulgaris leukoagglutinating and erythroagglutinating lectins.
J. Biol. Chem. 257, 11230–11234.
51. Segel, I.H. (1975) Enzyme Kinetics: Behaviour and Analysis of
Rapid Equilibrium and Steady-State Enzyme Systems. John Wiley
andSons,NewYork,USA.
52. Picard, V., Ersal-Badju, E. & Bock, S.C. (1995) Partial glycosy-
lation of antithrombin III asparagines-135 is caused by the serine
in the third position of its N-glycosylation consensus sequence and
is responsible for production of the b-antithrombin III isoforms
with enhanced heparin affinity. Biochemistry 34, 8433–8440.
53. Kirkpatrick, C.J., Jones, C.J. & Stoddart, R.W. (1988) Lectin
histochemistry of the mast cell: a light microscopical study.
Histochem. J. 20, 139–146.
54. Buckley, M.G., Walters, C., Wong, W.M., Cawley, M.I.D., Ren,
S., Schwartz, L.B. & Walls, A.F. (1997) Mast cell activation in
arthritis: detection of a-andb-tryptase, histamine and eosinophil
cationic protein in synovial fluid. Clin. Sci. 93, 363–370.
55. Schwartz, L.B., Irani, A.A., Roller, K., Castells, M.C. &
Schechter, N.M. (1987) Quantitation of histamine, tryptase, and
chymase in dispersed human T and TC mast cells. J. Immunol.
138, 2622–2615.
56. Alter, S.C. & Schwartz, L.B. (1989) Effect of histamine and
divalent cations on the activity and stability of tryptase from
human mast cells. Biochim. Biophys. Acta 991, 426–430.
Ó FEBS 2003 Heterogeneity of human mast cell tryptase (Eur. J. Biochem. 270) 283
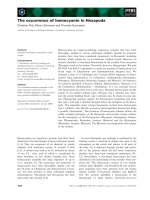

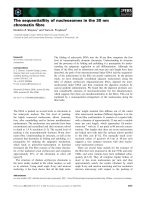
![Tài liệu Báo cáo khoa học: The stereochemistry of benzo[a]pyrene-2¢-deoxyguanosine adducts affects DNA methylation by SssI and HhaI DNA methyltransferases pptx](https://media.store123doc.com/images/document/14/br/gc/medium_Y97X8XlBli.jpg)