THE CONGRESSIONAL BUDGET OFFICE’S BUDGET AND ECONOMIC OUTLOOK pptx
Bạn đang xem bản rút gọn của tài liệu. Xem và tải ngay bản đầy đủ của tài liệu tại đây (465.41 KB, 58 trang )
U
.
S
.
GOVERNMENT PRINTING OFFICE
WASHINGTON
:
For sale by the Superintendent of Documents, U.S. Government Printing Office
Internet: bookstore.gpo.gov Phone: toll free (866) 512–1800; DC area (202) 512–1800
Fax: (202) 512–2250 Mail: Stop SSOP, Washington, DC 20402–0001
32–919 PDF
2007
THE CONGRESSIONAL BUDGET OFFICE’S
BUDGET AND ECONOMIC OUTLOOK
HEARING
BEFORE THE
COMMITTEE ON THE BUDGET
HOUSE OF REPRESENTATIVES
ONE HUNDRED TENTH CONGRESS
FIRST SESSION
HEARING HELD IN WASHINGTON, DC, JANUARY 30, 2007
Serial No. 110–3
Printed for the use of the Committee on the Budget
(
Available on the Internet:
VerDate 0ct 09 2002 16:26 Mar 14, 2007 Jkt 000000 PO 00000 Frm 00001 Fmt 5011 Sfmt 5011 J:\DOCS\HEARINGS\110TH\110-3\32919.TXT HBUD1 PsN: DICK
(II)
COMMITTEE ON THE BUDGET
JOHN M. SPRATT, J
R
., South Carolina, Chairman
ROSA L. D
E
LAURO, Connecticut,
CHET EDWARDS, Texas
LOIS CAPPS, California
JIM COOPER, Tennessee
THOMAS H. ALLEN, Maine
ALLYSON Y. SCHWARTZ, Pennsylvania
MARCY KAPTUR, Ohio
XAVIER BECERRA, California
LLOYD DOGGETT, Texas
EARL BLUMENAUER, Oregon
MARION BERRY, Arkansas
ALLEN BOYD, Florida
JAMES P. M
C
GOVERN, Massachusetts
BETTY SUTTON, Ohio
ROBERT E. ANDREWS, New Jersey
ROBERT C. ‘‘BOBBY’’ SCOTT, Virginia
BOB ETHERIDGE, North Carolina
DARLENE HOOLEY, Oregon
BRIAN BAIRD, Washington
DENNIS MOORE, Kansas
TIMOTHY H. BISHOP, New York
PAUL RYAN, Wisconsin,
Ranking Minority Member
J. GRESHAM BARRETT, South Carolina
JO BONNER, Alabama
SCOTT GARRETT, New Jersey
THADDEUS G. M
C
COTTER, Michigan
MARIO DIAZ–BALART, Florida
JEB HENSARLING, Texas
DANIEL E. LUNGREN, California
MICHAEL K. SIMPSON, Idaho
PATRICK T. M
C
HENRY, North Carolina
CONNIE MACK, Florida
K. MICHAEL CONAWAY, Texas
JOHN CAMPBELL, California
PATRICK J. TIBERI, Ohio
JON C. PORTER, Nevada
RODNEY ALEXANDER, Louisiana
ADRIAN SMITH, Nebraska
P
ROFESSIONAL
S
TAFF
T
HOMAS
S. K
AHN
, Staff Director and Chief Counsel
J
AMES
T. B
ATES
, Minority Chief of Staff
VerDate 0ct 09 2002 16:26 Mar 14, 2007 Jkt 000000 PO 00000 Frm 00002 Fmt 5904 Sfmt 5904 J:\DOCS\HEARINGS\110TH\110-3\32919.TXT HBUD1 PsN: DICK
(III)
C O N T E N T S
Page
Hearing held in Washington, DC, January 30, 2007 1
Statement of:
Hon. John M. Spratt, Jr., Chairman, House Committee on the Budget 1
Hon. Paul Ryan, a Representative in Congress from the State of Wis-
consin 2
Peter R. Orszag, Director, Congressional Budget Office 4
Prepared statement of:
Mr. Ryan 3
Mr. Orszag 10
VerDate 0ct 09 2002 16:26 Mar 14, 2007 Jkt 000000 PO 00000 Frm 00003 Fmt 5904 Sfmt 5904 J:\DOCS\HEARINGS\110TH\110-3\32919.TXT HBUD1 PsN: DICK
VerDate 0ct 09 2002 16:26 Mar 14, 2007 Jkt 000000 PO 00000 Frm 00004 Fmt 5904 Sfmt 5904 J:\DOCS\HEARINGS\110TH\110-3\32919.TXT HBUD1 PsN: DICK
(1)
THE CONGRESSIONAL BUDGET OFFICE’S
BUDGET AND ECONOMIC OUTLOOK
TUESDAY, JANUARY 30, 2007
H
OUSE OF
R
EPRESENTATIVES
,
C
OMMITTEE ON THE
B
UDGET
,
Washington, DC.
The committee met, pursuant to call, at 10:03 a.m., in room 210,
Cannon House Office Building, Hon. John M. Spratt, Jr. (Chairman
of the committee) presiding.
Present: Representatives Spratt, DeLauro, Edwards, Cooper,
Allen, Becerra, Doggett, Blumenauer, Berry, McGovern, Sutton,
Scott, Etheridge, Hooley, Baird, Moore, Bishop, Barrett, Bonner,
Garrett, Diaz-Balart, Hensarling, Lungren, Simpson, McHenry,
Conaway, Campbell, Porter and Smith.
Chairman S
PRATT
. I call the meeting to order and open the hear-
ing with a congratulations again to Dr. Peter Orszag, our witness
this morning, on his appointment as the Director of the Congres-
sional Budget Office. He is a superbly qualified economist. He has
an outstanding reputation not just among economists, but among
the public and Members of Congress alike.
We are pleased to have you, Peter, as the Director of the CBO
and as a central part of the budget process as we face the chal-
lenges, and there are plenty, that lie ahead of us.
The purpose of today’s hearing is to discuss CBO’s newly re-
leased budget and economic outlook, and to give Members an op-
portunity to ask Dr. Orszag about CBO’s estimates. CBO does ex-
cellent work in producing its budget estimates and forecasts. It is
also important for Members to understand and for the general pub-
lic to understand that the restrictions or conventions that are im-
posed upon CBO by law and by practice make their estimates and
the subsequent limitations of the baseline subject to explanation
because they are not to be taken as predictions so much as they
are benchmarks where we are with respect to current policy.
Any improvement in the deficit is a welcome development. Last
week’s baseline budget estimate from CBO is still not any cause for
declaring victory. When the surplus from Social Security is ex-
cluded, as I think it should be, the deficit for this year’s budget is
$362 billion, and it hovers in this range until 2011. At that point
budget forecasting rules call for CBO to assume that the tax cuts
passed in 2001 and 2003 will expire as the terms provide. The
Bush administration assumes otherwise, and the consequences for
the bottom line are going to be enormous.
CBO is also required to assume that the alternative minimum
tax will remain enforced and not be adjusted so that the AMT be-
VerDate 0ct 09 2002 16:26 Mar 14, 2007 Jkt 000000 PO 00000 Frm 00005 Fmt 6633 Sfmt 6633 J:\DOCS\HEARINGS\110TH\110-3\32919.TXT HBUD1 PsN: DICK
2
comes a tax schedule for tens of millions of American taxpayers,
most of for whom it was not intended. If instead the AMT is fixed
so that it applies only to up-bracket taxpayers, those for whom it
was originally intended, the loss revenues between 2008 and 2017
is in the range of a trillion dollars.
On the spending side, budget forecasting rules call for CBO to as-
sume that the supplemental appropriation passed in the previous
year carried forward to future years. Since the fiscal year 2007 De-
fense Appropriations Act includes $70 billion for bridge funding for
operations in Iraq and Afghanistan, this level of expenditure is in-
cluded or assumed in the 2008, 2009 and through 2017. With the
supplementals for Iraq and Afghanistan totaling $120 billion in
2006, probably as much as $170 billion in 2007, the $70 billion car-
ried forward is a likely understatement, at least for the short run.
When these adjustments are made, the estimates from CBO be-
come a sobering reminder of how much current policy will have to
be changed to return the budget to a fiscally responsible course. If
not corrected, large deficits—these large deficits will result in a ris-
ing mound of debt, which CBO already estimates to total $8.9 tril-
lion by the end of this year. This means there has been a 55 per-
cent increase in the statutory debt since the Bush administration
took office, and its corresponding increase in debt service means
that—and a corresponding increase in debt service.
So the challenges we face are considerable. When you open this
book, Dr. Orszag, and read the first paragraph in the first chapter,
this sounds like good news. Congressional Budget Office projects
that if current laws and current policies remain the same, the Fed-
eral budget will assure a deficit of $172 billion for the year 2007.
That is good news, no question about it. But if you turn the page
and read the first paragraph on page 2, CBO tells us, however, if
all tax provisions set to expire over the next 10 years were ex-
tended, and the AMT is indexed for inflation, the budget outlook
for 2017, 10 years from now, would change from a surplus of $249
billion, a surplus, to a deficit of $476 billion. Debt held by the pub-
lic at the end of 2017 would climb to nearly 40 percent of GDP, and
the 10-year cumulative deficit total would be $3.2 trillion. In other
words, we have our work cut out for us.
Dr. Orszag, I welcome you here, but before turning to you to hear
your statement, let me offer the Ranking Member Mr. Ryan the op-
portunity to make an statement as well. Mr. Ryan.
Mr. R
YAN
. Thank you, Mr. Chairman. Excuse me while I cough
while I do my opening remarks. When you have a 2-, 3-, and 4-
year-old, you get a cold about every 2, 3 or 4 weeks.
The budget outlook we are considering today—first of all, I want
to welcome Dr. Orszag. It is good to have him, off to a good start,
and this is a very, very good read as far as CBO outlooks go.
The outlook we are considering today does contain some truly
good news. Even as we have kept tax burdens low, revenues have
continued pouring into the Treasury at higher-than-expected reve-
nues, and this is the single biggest factor in this current year’s def-
icit reduction. But the good news basically does stop right there.
As Chairman Spratt just noted, and as Dr. Orszag will confirm,
I have no doubt, much of the budget outlook rests on unrealistic
assumptions both on the spending side and on the tax side. Among
VerDate 0ct 09 2002 16:26 Mar 14, 2007 Jkt 000000 PO 00000 Frm 00006 Fmt 6633 Sfmt 6633 J:\DOCS\HEARINGS\110TH\110-3\32919.TXT HBUD1 PsN: DICK
3
them clearly are the funding levels for the war in Iraq and signifi-
cant tax increases. But even taking these facts in account tends to
obscure the most important driver of Federal spending, and the
biggest threat to our fiscal and economic health; that is, entitle-
ment spending.
Just a week ago we heard from David Walker, the Comptroller
General, and others that warned us that unless Congress takes
prompt, substantive action to address the unsustainable growth in
entitlement programs, particularly our large health care programs,
both the budget and the economy will face serious consequences.
CBO’s report echoes these concerns. It projects entitlement
spending to grow about 5.9 percent a year. This trend will be led
by Medicare and Medicaid, which will grow at about 7 to 8 percent
a year. Even if we allow all the tax cuts to expire, it is swamped
by this growth in entitlement spending. So even if we manage to
balance the budget by 2012, which I think we can and should do,
entitlements will quickly drive us right back into deficit, and the
situation will keep getting worse after that.
So we see good news now. It is kind of a calm before the storm.
And let’s just put it into perspective and realize that we have a big
storm coming on the horizon. So the point is that it is not enough
for us in Congress to only look at war costs or discretionary spend-
ing or whether taxes are permanent or not; we need to face up to
the entitlement problem, and we need to do it soon.
Again, there was some truly good news in the report and I don’t
want to lose sight of that. The economy is growing well. Inflation
is in check. A lot of good things are happening. We have had 7.2
million jobs created since the last recession, but we can’t use this
report to bury our heads in the sand, and we cannot pretend that
simply cutting defense spending or raising taxes is going to solve
the real problem we face. We can get to balance in 5 years, and
I believe we should, and I think we will. But we cannot do it with
massive tax hikes. I believe Dr. Orszag will agree that we are going
to have to make difficult decisions and enact substantive changes
to address the growth in entitlement spending, and we are going
to have to do it soon if we are going to do it right. Thank you.
Chairman S
PRATT
. Thank you, Mr. Ryan.
[The prepared statement of Mr. Ryan follows:]
P
REPARED
S
TATEMENT OF
H
ON
. P
AUL
R
YAN
,
A
R
EPRESENTATIVE IN
C
ONGRESS
F
ROM
THE
S
TATE OF
W
ISCONSIN
The budget outlook we are considering today does contain some truly good news.
Even as we’ve kept tax burdens low, revenue has continued pouring into the Treas-
ury at higher-than-expected levels. And this is the single biggest factor in the cur-
rent year’s deficit reduction.
But the good news stops there. As Chairman Spratt has noted—and as Director
Orszag will confirm—much of the budget outlook rests on unrealistic assumptions—
both on the spending and tax side. Among them, clearly, are funding levels for the
war in Iraq, and significant tax increases.
But even taking these facts into account tends to obscure the most important driv-
er of federal spending, and the biggest threat to our fiscal and economic health: enti-
tlement spending.
Just a week ago today, this Committee heard compelling testimony from the
Comptroller General, David Walker, and others warning us that unless Congress
takes prompt, substantive action to address the unsustainable growth in entitle-
ment spending—particularly of our largest healthcare programs—both the budget
and the economy will face serious consequences.
VerDate 0ct 09 2002 16:26 Mar 14, 2007 Jkt 000000 PO 00000 Frm 00007 Fmt 6633 Sfmt 6621 J:\DOCS\HEARINGS\110TH\110-3\32919.TXT HBUD1 PsN: DICK
4
CBO’s report echoes these concerns. It notes that entitlement spending—which al-
ready consumes more than half of the budget—is projected to grow at about 5.9 per
year.
This trend will be led by Medicare and Medicaid, which will grow at 7 to 8 per
year—faster than projected growth of the entire economy, and faster than projected
growth in tax revenue—even if the 2001 and 2003 tax relief was allowed to expire.
So even if we could manage a balanced budget by 2012, entitlements would quick-
ly drive us right back into deficit, and the situation would just keep getting worse
after that.
The point is that it’s not enough for us in Congress to look only at war costs, or
discretionary spending, or taxes. We need to face up to the entitlement problem—
and we need to do it soon.
Again, there was some truly good news in this report, and I don’t want to lose
sight of that.
But we can’t use this report to bury our heads in the sand, and we can’t pretend
that simply cutting defense spending or raising taxes is going to solve the real prob-
lem we face.
We can get to balance in five years—and we can do it without massive tax hikes.
But—as I believe Dr. Orszag will agree—we’re going to have to make difficult de-
cisions, and enact substantive changes to address the growth of entitlement spend-
ing, and we’re going to have to do it soon.
Chairman S
PRATT
. Dr. Orszag, you can submit your statement
for the record, which will be acceptable from you, and I think you
are our only witness today. Summarize as you please, but the floor
is yours. Go ahead. We are glad to have you.
STATEMENT OF PETER R. ORSZAG, DIRECTOR,
CONGRESSIONAL BUDGET OFFICE
Mr. O
RSZAG
. Thank you very much, Mr. Chairman and Mr. Ryan
and other members of the committee. I am looking forward to
working with all of you over the next 4 years as we struggle with
the Nation’s fiscal challenges. I will try to be quite brief in my
opening remarks to leave plenty of time for questions, especially
since Chairman Spratt and Mr. Ryan covered many of the points
I was intending to cover, thus making it easier for me.
I have five points to make about the economic and budget out-
look, and I think interpreting the document that we released re-
quires taking all five points into account.
The first point is that under the official baseline, which, as
Chairman Spratt noted, reflects current law with regard to revenue
and spending, the budget deficit falls from $248 billion last year to
$172 billion this year. That excludes any outlays associated with a
likely supplemental appropriation for the ongoing war on ter-
rorism. Including that spending would bring the deficit for 2007 up
to a figure of around $200 billion or so.
VerDate 0ct 09 2002 16:26 Mar 14, 2007 Jkt 000000 PO 00000 Frm 00008 Fmt 6633 Sfmt 6602 J:\DOCS\HEARINGS\110TH\110-3\32919.TXT HBUD1 PsN: DICK
5
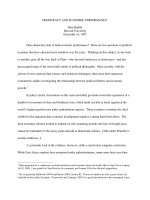
Over the next 10 years, as the first chart shows, if the first chart
comes up, the budget under the baseline moves into surplus in
2012 and then remains in surplus through the rest of the budget
window. That very significant increase around 2012, which is that
sharp upward movement in the line there, is associated with the
expiration of various revenue provisions at the end of 2010, which
raises revenue in 2011 and thereafter.
VerDate 0ct 09 2002 16:26 Mar 14, 2007 Jkt 000000 PO 00000 Frm 00009 Fmt 6633 Sfmt 6602 J:\DOCS\HEARINGS\110TH\110-3\32919.TXT HBUD1 PsN: DICK
orszag2.eps orszag3.eps
6
My second point is, as has already been noted by both Chairman
Spratt and Mr. Ryan, that baseline adopts a specific set of assump-
tions for the future. In particular, it strictly interprets current law.
So various revenue provisions that are scheduled to expire or are
soon to expire, discretionary spending is assumed to keep pace with
inflation, but not with population growth or with overall economic
growth. As a result of those two assumptions, revenue rises from
18.6 percent of the economy this year to over 20 percent by the end
of the projection window. That is largely because the alternative
minimum tax grows significantly from 4 million taxpayers last year
to 33 million in 2010, and because of the expiration of various rev-
enue provisions associated with the 2001 and 2003 tax legislation,
and discretionary spending falls from 7.8 percent of the economy to
5.8 percent of the economy by the end of the budget window.
If you made an alternative set of assumptions about the course
of future policy and, for example, assume that discretionary spend-
ing, including the war on terrorism, kept pace with the overall eco-
nomic growth, and that the 2001 and 2003 tax provisions were not
allowed to expire, and that the alternative minimum tax was not
allowed to overtake the tax system, instead of a surplus in 2012
of $170 billion dollars, one would have a deficit of $328 billion, and
over the 10-year window you would have a cumulative deficit of
$4.2 trillion.
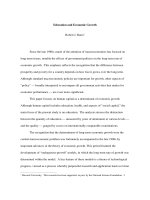
So again, it has already been noted, making different assump-
tions, I think the next slide summarizes those, and those are inclu-
sive of the debt service implications of changing policy. Changing
policy relative to current law has a significant effect on budgetary
outcomes.
My third point, if we could go to the next slide, has to do with
uncertainty. I think it is very important to realize this year we are
expected to spend about $2.7 trillion. We are expected to bring in
VerDate 0ct 09 2002 16:26 Mar 14, 2007 Jkt 000000 PO 00000 Frm 00010 Fmt 6633 Sfmt 6602 J:\DOCS\HEARINGS\110TH\110-3\32919.TXT HBUD1 PsN: DICK
orszag4.eps
7
revenue of about $2.5 trillion for a deficit of about $200 billion. If
we are 5 percent too high on spending and 5 percent too low on
the revenue projection, so just 5 percent on each, the actual out-
come would shift from a deficit of $200 billion to a surplus of more
than $50 billion, the point being that being slightly off on two big
numbers can have a very big effect on the difference between those
two numbers, which is the deficit. So there can be very substantial
swings in the deficit from relatively minor errors in forecasting big
numbers like revenue and spending.
To try to illustrate that uncertainty, this chart shows you the
projected budget outcomes under the baseline, with the dark blue
area representing the most likely outcomes under that baseline.
For example, in 2010, we project a deficit of about 1 percent of
GDP of the economy, but there is a 20 percent probability based
on past forecasting errors of a 3 percent deficit or larger, and a 5
percent probability of a 3 percent surplus or more. So I want to
make sure that everyone understands that there is significant un-
certainty surrounding future budgetary outcomes.
The fourth point has to do with the changes since last August.
If we could go to the next slide, please. Thank you. Consistent with
the emergence of projected surpluses under the baseline, which did
not occur last August, there has been a significant improvement in
the baseline since last August. Last August, for 2007 through 2016
we were projecting a deficit of $1.8 trillion. We are now projecting
a surplus over that period of almost $400 billion.
But I want to quickly make two points about that improvement.
First, it has little to do with changes in economic assumptions. In
fact, economic changes by themselves account for only $173 billion
of that shift. Secondly, a very large chunk of it, roughly half, has
to do with the mechanical implications of our assumptions with re-
gard to discretionary spending. By scoring convention, what we do
VerDate 0ct 09 2002 16:26 Mar 14, 2007 Jkt 000000 PO 00000 Frm 00011 Fmt 6633 Sfmt 6602 J:\DOCS\HEARINGS\110TH\110-3\32919.TXT HBUD1 PsN: DICK
orszag5.eps
8
is we take enacted appropriations in the base year and project
them out. In August, that base year included $120 billion in appro-
priations for the global war on terrorism, and a little bit less than
$60 billion for domestic relief activities associated primarily with
the hurricane. This year so far we only have $70 billion enacted
with regard to the global war on terrorism, and nothing cor-
responding to the domestic relief activity. So in both categories
there is basically about $50 billion less in the base year, and then
project that forward in each year thereafter and you get about $500
billion less in defense spending and $500 billion less in nondefense
spending, which has little to do with the underlying fiscal environ-
ment, and it is instead mostly mechanical implication of the way
that we are instructed to conduct or to construct the baseline.
The other point, though, is that there is some real improvement,
as Mr. Ryan noted, in the short term. Some of that has to do with
improved outlay projections over the longer term, over the 10-year
period as a whole. Much less of the improvement has to do with
revenue. In fact, the net effect on revenue changes since August
2006 is only $57 billion over the 10-year window.
The real improvement, abstracting from that mechanical discre-
tionary assumption, has to do with Medicare spending in par-
ticular. We have $445 billion less in Medicare spending over the
10-year window than in August 2006, of which $265 billion comes
from Medicare Part D, the prescription drug benefit. That in turn
reflects both lower cost per beneficiary—bids came in 15 percent
lower than last year this year—and also a lower outyear assump-
tion with the regard to the number of beneficiaries who will take
up the benefit, because now we have more information—we have
real information on beneficiaries. It looks like a larger share of
beneficiaries will have other coverage and, therefore, not take up
the Medicare benefit in the outyears. Both of those combined re-
duced the Part D projections by $265 billion.
VerDate 0ct 09 2002 16:26 Mar 14, 2007 Jkt 000000 PO 00000 Frm 00012 Fmt 6633 Sfmt 6602 J:\DOCS\HEARINGS\110TH\110-3\32919.TXT HBUD1 PsN: DICK
9
My final point—and this returns to a theme that Mr. Ryan noted
also—if we could go to the final chart, please—is that over the long
term, the Nation’s fiscal imbalance is quite serious. It has a lot to
do especially with our health care programs. Medicare and Med-
icaid combined, the Federal share of Medicaid plus Medicare,
amount to 4
1
⁄
2
percent of GDP this year. They are projected to rise
to 5.9 percent by the end of the budget window in 2017. If over the
next 40 years health care costs continue to grow as rapidly relative
to economic growth as they did over the past 40 years, one gets
that top line shown in this graph. Medicare and Medicaid would
amount to 20 percent of the economy by 2050 under that projec-
tion. That is as large as the entire Federal share today. Even if
health care costs’ growth slow to 1 percent faster than economic
growth, which is the dotted line in the middle, those two programs
would have accounted for 10 percent of the economy.
It is not too gross of an exaggeration to say the central long-term
fiscal challenge facing the United States is to bend that curve so
that cost growth occurs at a slower rate, and I would say there is
a significant opportunity for us to slow health care costs without
impairing innovation and without harming Americans’ health if we
can find better ways of making sure that our health care system
is cost-effective.
But in light of that curve in particular, it is implausible that eco-
nomic growth alone will eliminate our long-term fiscal imbalance,
and some combination of spending reductions and/or revenue in-
creases will be necessary to avoid a very significant fiscal problem
that will develop over the medium to long term. Thank you very
much.
[The prepared statement of Peter R. Orszag follows:]
VerDate 0ct 09 2002 16:26 Mar 14, 2007 Jkt 000000 PO 00000 Frm 00013 Fmt 6633 Sfmt 6602 J:\DOCS\HEARINGS\110TH\110-3\32919.TXT HBUD1 PsN: DICK
orszag6.eps
10
1
See Congressional Budget Office, The Budget and Economic Outlook: Fiscal Years 2008 to
2017 (January 2007).
2
For a detailed discussion of the long-term pressures facing the federal budget, see Congres-
sional Budget Office, The Long-Term Budget Outlook (December 2005), Updated Long-Term
Projections for Social Security (June 2006), and The Outlook for Social Security (June 2004).
3
The Balanced Budget and Emergency Deficit Control Act of 1985, which established rules
that govern the calculation of CBO’s baseline, expired on September 30, 2006. Nevertheless,
CBO continues to prepare baselines according to the methodology prescribed in that law.
P
REPARED
S
TATEMENT OF
P
ETER
R. O
RSZAG
, D
IRECTOR
, C
ONGRESSIONAL
B
UDGET
O
FFICE
Chairman Spratt, Congressman Ryan, and Members of the Committee, thank you
for giving me this opportunity to present the Congressional Budget Office’s (CBO’s)
budget and economic outlook for fiscal years 2008 to 2017.
1
If current laws and policies remained the same, the budget deficit would equal
roughly 1 percent of gross domestic product (GDP) each fiscal year from 2007 to
2010, the Congressional Budget Office (CBO) projects. Those deficits would be small-
er than last year’s budgetary shortfall, which equaled 1.9 percent of GDP (see Table
1). Under the assumptions that govern CBO’s baseline projections, the budget would
essentially be balanced in 2011 and then would show surpluses of about 1 percent
of GDP each year through 2017 (the end of the current 10-year projection period).
The favorable outlook suggested by those 10-year projections, however, does not
indicate a substantial change in the nation’s long-term budgetary challenges. The
aging of the population and continuing increases in health care costs are expected
to put considerable pressure on the budget in coming decades. Economic growth
alone is unlikely to be sufficient to alleviate that pressure as Medicare, Medicaid,
and (to a lesser extent) Social Security require ever greater resources under current
law. Either a substantial reduction in the growth of spending, a significant increase
in tax revenues relative to the size of the economy, or some combination of spending
and revenue changes will be necessary to promote the nation’s long-term fiscal sta-
bility.
2
CBO’s baseline budget projections for the next 10 years, moreover, are not a fore-
cast of future outcomes; rather, they are a benchmark that lawmakers and others
can use to assess the potential impact of future policy decisions. The deficits and
surpluses in the current baseline are predicated on two key projections (which stem
from longstanding procedures that were, until recently, specified in law).
3
• Revenues are projected to rise from 18.6 percent of GDP this year to almost 20
percent of GDP in 2012 and then remain near that historically high level through
2017. Much of that increase results from two aspects of current law that have been
subject to recent policy changes: the growing impact of the alternative minimum tax
(AMT) and, even more significantly, various provisions originally enacted in the Eco-
nomic Growth and Tax Relief Reconciliation Act of 2001 (EGTRRA) and the Jobs
and Growth Tax Relief Reconciliation Act of 2003 (JGTRRA) and modified by subse-
quent legislation, which are scheduled to expire by December 31, 2010.
• Outlays for discretionary programs (activities whose spending levels are set
anew each year through appropriation acts) are projected to decline from 7.8 percent
of GDP last year to 5.8 percent of GDP by 2017—a lower percentage than any re-
corded in the past 45 years. That projection derives mainly from the assumption in
the baseline that discretionary funding will grow at the rate of inflation, which is
lower than the growth rate that CBO projects for nominal GDP. The projection for
discretionary spending implicitly assumes that no additional funding is provided for
the war in Iraq in 2007 and that future appropriations for activities related to the
war on terrorism remain equivalent, in real (inflation-adjusted) terms, to the $70
billion appropriated so far this year.
VerDate 0ct 09 2002 16:26 Mar 14, 2007 Jkt 000000 PO 00000 Frm 00014 Fmt 6633 Sfmt 6621 J:\DOCS\HEARINGS\110TH\110-3\32919.TXT HBUD1 PsN: DICK
11
SUMMARY TABLE 1.—CBO’S BASELINE BUDGET OUTLOOK
Actual
2006
2007 2008 2009 2010 2011 2012 2013 2014 2015 2016 2017
Total
2008–
2012
Total
2008–
2017
IN BILLIONS OF DOLLARS
Total Revenues 2,407 2,542 2,720 2,809 2,901 3,167 3,404 3,550 3,717 3,896 4,084 4,284 15,001 34,531
Total Outlays 2,654 2,714 2,818 2,926 3,038 3,179 3,234 3,391 3,533 3,687 3,892 4,034 15,194 33,731
Total Deficit (¥) or Surplus ¥248 ¥172 ¥98 ¥116 ¥137 ¥12 170 159 185 208 192 249 ¥194 800
On-budget ¥434 ¥357 ¥299 ¥332 ¥367 ¥258 ¥85 ¥101 ¥79 ¥57 ¥72 ¥10 ¥1,342 ¥1,662
Off-budget
a
186 185 201 216 230 246 255 261 264 265 264 259 1,148 2,461
Debt Held by the Public at the End of the Year 4,829 4,995 5,104 5,232 5,380 5,403 5,242 5,089 4,912 4,709 4,521 4,274 n.a. n.a.
AS A PERCENTAGE OF GROSS DOMESTIC PRODUCT
Total Revenues 18.4 18.6 19.0 18.7 18.4 19.2 19.8 19.8 19.8 19.9 20.0 20.1 19.1 19.5
Total Outlays 20.3 19.9 19.7 19.5 19.3 19.3 18.8 18.9 18.8 18.8 19.1 18.9 19.3 19.1
Total Deficit (¥) or Surplus ¥1.9 ¥1.3 ¥0.7 ¥0.8 ¥0.9 ¥0.1 1.0 0.9 1.0 1.1 0.9 1.2 ¥0.2 0.5
Debt Held by the Public at the End of the Year 37.0 36.6 35.7 34.8 34.2 32.8 30.5 28.3 26.2 24.0 22.1 20.1 n.a. n.a.
Memorandum:
Gross Domestic Product (Billions of dollars) 13,066 13,645 14,300 15,014 15,742 16,465 17,205 17,973 18,764 19,582 20,425 21,295 78,726 176,766
Source: Congessional Budget Office.
Note: n.a. = not applicable.
a
Off-budget surpluses comprise surpluses in the Social Security trust funds as well as the net cash flow of the Postal Service.
VerDate 0ct 09 2002 16:26 Mar 14, 2007 Jkt 000000 PO 00000 Frm 00015 Fmt 6633 Sfmt 6621 J:\DOCS\HEARINGS\110TH\110-3\32919.TXT HBUD1 PsN: DICK
12
Policy choices that differed from the assumptions in the baseline would produce
different budgetary outcomes. For example, if lawmakers continued to provide relief
from the AMT (as they have done on a short-term basis for the past several years)
and if the provisions of EGTRRA and JGTRRA that are scheduled to expire were
instead extended, total revenues would be almost $3 trillion lower over the next 10
years than CBO now projects. Similarly, if discretionary spending (other than for
military operations in Iraq and Afghanistan) grew at the rate of nominal GDP over
the next 10 years, total discretionary outlays during that period would be nearly
$1.3 trillion higher than in the baseline. Combined, those policy changes—and asso-
ciated debt-service costs—would produce a deficit of $328 billion (1.9 percent of
GDP) in 2012 and a cumulative deficit over the 2008-2017 period of $4.2 trillion (2.4
percent of GDP).
Underlying CBO’s baseline projections is a forecast that U.S. economic growth will
slow in calendar year 2007 but pick up in 2008. Specifically, CBO anticipates that
GDP will grow by 2.3 percent in real terms in 2007, a full percentage point less than
the growth recorded last year. For 2008, CBO forecasts that GDP growth will re-
bound to 3.0 percent. Under the assumptions of the baseline, real GDP growth
would continue at a similar rate in 2009 and 2010 and then slow to 2.7 percent in
2011 and 2012. For the rest of the projection period, average growth of real GDP
is projected to decrease to 2.5 percent per year as increases in the size of the work-
force continue to slow.
THE BUDGET OUTLOOK
CBO estimates that if today’s laws and policies did not change, federal spending
would total $2.7 trillion in 2007 and revenues would total $2.5 trillion, resulting in
a budget deficit of $172 billion. The additional funding that is likely to be needed
to finance military operations in Iraq and Afghanistan would put that deficit in the
vicinity of $200 billion. Even so, this year’s shortfall would be smaller than the 2006
deficit of $248 billion.
BASELINE PROJECTIONS FOR THE 2008
–
2017 PERIOD
Under current laws and policies, the deficit would drop further in 2008, to $98
billion. That decrease results primarily from two factors. On the revenue side of the
budget, receipts from the AMT are estimated to increase by about $60 billion next
year because of the scheduled expiration of the relief provided through tax year
2006. (In addition, telephone-tax refunds, which totaled $13 billion in 2007, are pro-
jected to drop by $10 billion in 2008.) On the spending side of the budget, outlays
for operations in Iraq and Afghanistan and for relief and recovery from hurricane
damage are about $14 billion lower in 2008 than in 2007 under the assumptions
of the baseline.
The baseline deficit is projected to rise modestly over the following two years,
2009 and 2010, as outlays grow by about 3.8 percent annually and revenues in-
crease by about 3.3 percent a year. That projected growth rate for revenues is lower
than in recent years, mainly because corporate profits and capital gains realizations
are expected to revert to levels that are more consistent with their historical rela-
tionship to GDP.
After 2010, spending related to the aging of the baby-boom generation will begin
to raise the growth rate of total outlays. The baby boomers will start becoming eligi-
ble for Social Security retirement benefits in 2008, when the first members of that
generation turn 62. As a result, the annual growth rate of Social Security spending
is expected to increase from about 4.5 percent in 2008 to 6.5 percent by 2017.
In addition, because the cost of health care is likely to continue rising rapidly,
spending for Medicare and Medicaid is projected to grow even faster—in the range
of 7 percent to 8 percent annually. Total outlays for those two health care programs
are projected to more than double by 2017, increasing by 124 percent, while nominal
GDP is projected to grow only half as much, by 63 percent (see Figure 1). Con-
sequently, under the assumptions of CBO’s baseline, spending for Medicare, Med-
icaid, and Social Security will together equal nearly 11 percent of GDP in 2017,
compared with a little less than 9 percent this year.
Revenues are projected to increase sharply after 2010 given the assumption that
various tax provisions expire as scheduled. In the baseline, total revenues grow by
9.2 percent in 2011 and by 7.5 percent in 2012, thereby bringing the budget into
surplus. Beyond 2012, revenues are projected to grow at about the same pace as out-
lays (by roughly 4.5 percent a year), keeping the budget in the black through 2017
under baseline assumptions.
Relative to the size of the economy, outlays are projected to range between 18.8
percent and 19.7 percent of GDP during the 2008-2017 period under the assump-
VerDate 0ct 09 2002 16:26 Mar 14, 2007 Jkt 000000 PO 00000 Frm 00016 Fmt 6633 Sfmt 6621 J:\DOCS\HEARINGS\110TH\110-3\32919.TXT HBUD1 PsN: DICK
13
4
Those projections were published in Congressional Budget Office, The Budget and Economic
Outlook: An Update (August 2006).
tions of CBO’s baseline—lower than the 20.6 percent average of the past 40 years
(see Figure 2). Mandatory spending (funding determined by laws other than annual
appropriation acts) is projected to grow by 5.9 percent a year over that period, which
is faster than the economy as a whole. By contrast, discretionary appropriations are
assumed simply to keep pace with inflation and, to a lesser extent, with the growth
of wages. Thus, discretionary outlays are projected to increase by about 2.0 percent
a year, on average, or less than half as fast as nominal GDP.
CBO projects that revenues will average 18.7 percent of GDP from 2008 to 2010
(close to the 18.6 percent level expected for this year) before jumping sharply in
2011 and 2012 with the expiration of tax provisions originally enacted in EGTRRA
and JGTRRA. After that, revenues are projected to continue growing faster than the
overall economy for three reasons: the progressive structure of the tax code com-
bined with increases in total real income, withdrawals of retirement savings as the
population ages, and the fact that the AMT is not indexed for inflation. Under the
assumptions of the baseline, CBO projects that revenues will equal 20.1 percent of
GDP by 2017—a level reached only once since World War II.
Federal government debt that is held by the public (mainly in the form of Treas-
ury securities sold directly in the capital markets) is expected to equal almost 37
percent of GDP at the end of this year. Thereafter, the baseline’s projections of
smaller annual deficits and emerging surpluses diminish the government’s need for
additional borrowing, causing debt held by the public to shrink to 20 percent of GDP
by 2017.
CHANGES IN THE BASELINE BUDGET OUTLOOK SINCE AUGUST
Although the long-term budgetary picture continues to be worrisome, the baseline
outlook for the next 10 years has brightened in the five months since CBO issued
its previous projections.
4
VerDate 0ct 09 2002 16:26 Mar 14, 2007 Jkt 000000 PO 00000 Frm 00017 Fmt 6633 Sfmt 6621 J:\DOCS\HEARINGS\110TH\110-3\32919.TXT HBUD1 PsN: DICK
orztest2.eps
14
Budgetary outcomes have improved for each year from 2007 to 2016 (the period
covered by the previous projections), from a reduction of $114 billion in the deficit
for 2007 to a swing of $285 billion in the bottom line for 2016 (from a deficit of $93
billion to a surplus of $192 billion). In all, those reductions represent a difference
of about 1.2 percent of GDP over 10 years.
Those changes overstate the fundamental improvement in the underlying budget
outlook, however. Roughly half of the total change stems from the baseline’s treat-
ment of previous supplemental appropriations for disaster relief and the irregular
pattern of funding for military operations in Iraq and Afghanistan. Consequently,
more than half of the improved bottom line is unrelated to changes in the under-
lying budgetary and economic environment.
Much of the remaining change to the current baseline comes from lower projected
spending for Medicare. Total outlays for that program over the 2007-2016 period are
nearly 8 percent lower in this baseline than in CBO’s August projections. That re-
duction is largely attributable to new estimates of per capita costs for all Medicare
benefits, but it also reflects lower projections of the number of enrollees in the pre-
scription drug benefit program. Those recent changes, however, do not significantly
alter the upward trajectory of Medicare spending in the long term.
THE ECONOMIC OUTLOOK
The Federal Reserve’s shift in monetary policy over the past two and a half years
and the recent decline in housing construction are expected to restrain economic
growth this year, but the economy is likely to post solid gains next year. CBO fore-
casts that GDP will grow by 2.3 percent in real terms in calendar year 2007 but
by 3.0 percent in 2008 (see Table 2).
Gains in employment, which remained solid in 2006 despite a slowdown in eco-
nomic growth during the second half of the year, are expected to lessen in 2007.
That change may cause unemployment to edge up from the 4.6 percent rate re-
corded for 2006. As housing construction stabilizes, however, economic growth and
employment should start to recover by the middle of 2007.
SUMMARY TABLE 2.—CBO’S ECONOMIC PROJECTIONS FOR CALENDAR YEARS 2007 TO 2017
[Percentage change]
Estimated
2006
Forecast Projected Annual Average
2007 2008 2009–2012 2013–2017
Nominal GDP:
Billions of dollars 13,235 13,805 14,472 (
1
) 17,395 (
2
) 21,519
Percentage change 6.3 4.3 4.8 4.7 4.3
Real GDP 3.3 2.3 3.0 2.9 2.5
GDP Price Index 2.9 1.9 1.8 1.8 1.8
PCE Price Index
3
2.8 1.7 1.9 2.0 2.0
Core PCE Price Index
4
2.3 2.1 1.9 2.0 2.0
VerDate 0ct 09 2002 16:26 Mar 14, 2007 Jkt 000000 PO 00000 Frm 00018 Fmt 6633 Sfmt 6621 J:\DOCS\HEARINGS\110TH\110-3\32919.TXT HBUD1 PsN: DICK
orztest3.eps
15
SUMMARY TABLE 2.—CBO’S ECONOMIC PROJECTIONS FOR CALENDAR YEARS 2007 TO 2017—
Continued
[Percentage change]
Estimated
2006
Forecast Projected Annual Average
2007 2008 2009–2012 2013–2017
Consumer Price Index
5
3.4 1.9 2.3 2.2 2.2
Core Consumer Price Index
6
2.6 2.6 2.3 2.2 2.2
Unemployment Rate (Percent) 4.6 4.7 4.9 5.0 5.0
Interest Rates (Percent):
Three-month Treasury bills 4.7 4.8 4.5 4.4 4.4
Ten-year Treasury notes 4.8 4.8 5.0 5.2 5.2
Sources: Congressional Budget Office; Department of Commerce, Bureau of Economic Analysis; Department of Labor, Bureau of Labor Statis-
tics; Federal Reserve Board.
Notes: GDP = gross domestic product. Percentage changes are year to year.Year-by-year economic projections for 2007 to 2017 appear in
Appendix E.
1
Level in 2012.
2
Level in 2017.
3
The personal consumption expenditure chained price index.
4
The personal consumption expenditure chained price index excluding prices for food and energy.
5
The consumer price index for all urban consumers.
6
The consumer price index for all urban consumers excluding prices for food and energy.
Last year, robust investment by businesses and solid growth in exports helped the
U.S. economy absorb the decline in housing construction. Investment and exports
are expected to continue to support the economy in 2007. For many years, busi-
nesses’ capital stock (the plant, equipment, and software they use for production)
grew more slowly than overall demand for U.S. goods and services; as a result, de-
spite the recent growth of investment, the nation’s capital stock is still low relative
to the level of demand. Investment should therefore continue to increase, even if the
growth of demand slows. Similarly, export growth is likely to remain strong because
increases in demand for U.S. products overseas are durable enough to withstand a
slight slowdown in U.S. demand for other countries’ exports.
In the absence of any adverse price shocks to the economy, the core rate of infla-
tion—which excludes prices for food and energy—is expected to ease slightly this
year. Overall inflation (as measured by the year-to-year change in the price index
for personal consumption expenditures) will fall from last year’s rate of 2.8 percent
to 1.7 percent in 2007 because of a large drop in prices for motor fuels near the
end of last year. The core rate of inflation, however, is expected to decline less rap-
idly during 2007.
CBO anticipates that the interest rate on three-month Treasury bills will drop
slightly this year from the 4.9 percent rate seen at the end of 2006. Further declines
are expected during 2008, when that rate will average 4.5 percent. CBO’s forecast
assumes that long-term interest rates will edge up as short-term interest rates de-
cline. The rate on 10-year Treasury notes, for example, is forecast to rise from 4.8
percent this year to 5.0 percent in 2008.
Beyond the two-year horizon, CBO projects that economic growth (as measured
by increases in real GDP) will average 2.7 percent a year from 2009 to 2017. As
members of the baby-boom generation begin to retire, the growth of the labor force
is expected to slow, pushing down the rate of real GDP growth during the second
half of that period. Projected rates of inflation, unemployment, and growth of labor
productivity average 2.0 percent, 5.0 percent, and 2.2 percent, respectively, after
2008. Interest rates are projected to average 4.4 percent for three-month Treasury
bills and 5.2 percent for 10-year Treasury notes.
Chairman S
PRATT
. Of course, like I was referring earlier to some
of the positive changes in your forecast, if you read all the way to
appendix B, you find CBO has made some major changes, which
you have testified, in the so-called baseline since just last August,
in a matter of months. The cumulative changes come to how much?
Mr. O
RSZAG
. The cumulative changes come to 2 point—over $2
trillion.
Chairman S
PRATT
. Over $2 trillion between 2008 and 2017.
Mr. O
RSZAG
. No. It is $2.1 trillion, Chairman Spratt, between
2007 and 2016. We do it over that window because that was the
window used in August.
VerDate 0ct 09 2002 16:26 Mar 14, 2007 Jkt 000000 PO 00000 Frm 00019 Fmt 6633 Sfmt 6602 J:\DOCS\HEARINGS\110TH\110-3\32919.TXT HBUD1 PsN: DICK
16
Chairman S
PRATT
. And the remaining bottom line is a surplus?
Mr. O
RSZAG
. That is correct. Roughly $400 billion now.
Chairman S
PRATT
. If you keep reading, you find that more than
half of these changes related to the way you adjust for
supplementals.
Mr. O
RSZAG
. Correct.
Chairman S
PRATT
. Would you expound upon that? We have got
the war costs, we have got the Katrina costs, we have got various
costs. Under current law you are obligated to carry forward prior-
year supplemental appropriations. But in the case of defense, only
$70 billion has been appropriated, so that is your carry forward; is
that correct?
Mr. O
RSZAG
. That is correct.
Chairman S
PRATT
. The difference between that and what was ap-
propriated in 2006——
Mr. O
RSZAG
. Is about $50 billion.
Chairman S
PRATT
. And the carry forward on that accounts to
how much over a 10-year period of time?
Mr. O
RSZAG
. About $500 billion.
Chairman S
PRATT
. So just in adjusting for the baseline, which is
a technical adjustment really, you have got a substantial adjust-
ment to the bottom line.
Mr. O
RSZAG
. And again, Mr. Chairman, that is only with regard
to defense discretionary spending. There is also another roughly
$500 billion of basically the same thing on the nondefense side. So
a trillion dollars total.
Chairman S
PRATT
. Well, in particular, Medicare, while you just
gave us the dire possibilities given the rate of growth in the Medi-
care program, what you have found in looking forward 10 years,
2007 to 2016, is a substantial reduction, I think it is $588 billion
cumulative cost reduction in Medicare since your last forecast?
Mr. O
RSZAG
. I believe it is $445 billion.
Chairman S
PRATT
. Four hundred forty-five.
Mr. O
RSZAG
. But in any case, it is a significant adjustment.
Chairman S
PRATT
. Medicaid is $70 billion?
Mr. O
RSZAG
. A little bit above $70 billion reduction, yes.
Chairman S
PRATT
. Any other adjustments like that of that mag-
nitude?
Mr. O
RSZAG
. Those are the most substantial ones, but I want to
return for a second to nondefense discretionary spending, because
in addition to the Medicare and Medicaid reductions that you
noted, there is also less nondefense discretionary spending because
we have not had a repeat of the hurricane spending in 2007. So
that also accounts for roughly $500 billion lower discretionary
spending in this baseline.
Chairman S
PRATT
. All right. Let me put up our first chart, which
you have seen many times and everyone else has, but it goes di-
rectly to the point you are just making. There are two diverging
curves here. The lower curve—the upper curve plots your baseline.
I am not sure whether it includes the adjustments you have made
in this report or not, but I believe it does. The lower curve——
Mr. O
RSZAG
. I think it does.
Chairman S
PRATT
. Yeah.
Mr. O
RSZAG
. It goes above zero.
VerDate 0ct 09 2002 16:26 Mar 14, 2007 Jkt 000000 PO 00000 Frm 00020 Fmt 6633 Sfmt 6602 J:\DOCS\HEARINGS\110TH\110-3\32919.TXT HBUD1 PsN: DICK
17
Chairman S
PRATT
. But beginning in 2006, 2007, there is a stead-
ily widening divergence between where we would go if we assume
politically what will happen with the Bush budget and where CBO
will take us with your particular baseline. When you get to the end
of the period of time, I can barely see, but I think that deficit is
$500 and some odd billion. Your corresponding deficit on page 2 is
$476 billion for that point in time, that particular period. It is my
understanding that we are using slightly different assumptions
about war costs.
Now, would you walk us through the changes that account for
that divergence? First of all, a reestimation of war costs; secondly,
the extension of the 2001 and 2003 tax cuts; and thirdly, leaving
the AMT unadjusted or adjusted, or leaving the AMT as is.
Mr. O
RSZAG
. Okay. And again, the $502 billion figure you are
showing there is your calculations. What I can do is walk you
through some of the changes in policy that we show in table 1-5
that would have a material effect on the 2017 outcome.
So as we show in table 1-5, if one extended the 2001 and 2003
tax provisions rather than allowing them to expire in 2010, the rev-
enue reduction in 2017 would be $333—sorry—$330 billion and
there would be additional debt service of $94 billion. So that gets
you to a total of roughly $424 billion from that provision.
Chairman S
PRATT
. That is a cumulative revenue effect of renew-
ing the expiring tax cuts?
Mr. O
RSZAG
. No. I am sorry. That is in 2017 alone. Over the 10-
year window as a whole, that policy change by itself would have
a budgetary effect inclusive of debt service of $2.2 trillion.
Chairman S
PRATT
. $2.2 trillion.
Mr. O
RSZAG
. Correct.
Chairman S
PRATT
. Due to the renewal of these expiring tax cut
programs alone.
Mr. O
RSZAG
. That is correct.
If you then also extend other expiring tax provisions like the re-
search and experimentation tax credit and other things that are
scheduled to expire over the 10-year window, that is an additional
almost $500 billion, and then the alternative minimum tax com-
bined with making the 2001 and 2003 tax legislation permanent or
extending it past its currently scheduled sunset would raise—I
mean, would incur an additional budgetary effect of over a trillion
dollars also.
Chairman S
PRATT
. Say it again, please, sir.
Mr. O
RSZAG
. The alternative minimum tax effect in the face of
extending the 2001 and 2003 tax legislation, because there is an
interactive effect, would involve a budgetary cost of over a trillion
dollars over the next 10 years.
Chairman S
PRATT
. That alone, on top of the $2.2 trillion.
Mr. O
RSZAG
. Correct.
Chairman S
PRATT
. In other words, if we fix the AMT so that it
does not reach any more taxpayers than it reached last year, the
cost in revenues over a 10-year period of time, 2007 through 2016,
would be a trillion dollars.
Mr. O
RSZAG
. Slightly more than that, yes.
Chairman S
PRATT
. And that would add to the $2.2 trillion due
to the extension of the expiring tax cuts due to expire in 2010.
VerDate 0ct 09 2002 16:26 Mar 14, 2007 Jkt 000000 PO 00000 Frm 00021 Fmt 6633 Sfmt 6602 J:\DOCS\HEARINGS\110TH\110-3\32919.TXT HBUD1 PsN: DICK
18
Mr. O
RSZAG
. That is correct.
Chairman S
PRATT
. War costs. How do you treat war costs? Let
me just stop to you say—I am not trying to answer your question
or lead the witness. You are a hell of a lot smarter than I am.
Mr. O
RSZAG
. I am very cautious whenever you say something like
that, but go ahead.
Chairman S
PRATT
. You give two different estimates, ways of
looking at the ongoing cost of the war.
Mr. O
RSZAG
. That is correct.
Chairman S
PRATT
. Would you take a minute just to describe how
you did that and why you did that?
Mr. O
RSZAG
. Sure. We provided two different paths for potential
defense spending associated with Iraq, Afghanistan, and the global
war on terrorism in particular, in part because I think there is
widespread acknowledgement that there will be some divergence
between merely taking the $70 billion that has been enacted thus
far and kind of inflating that out into the future. So we provide you
with two alternative paths.
One would involve—they both involve some increase in troop lev-
els in the near term, and then they phase out at different rates
into different levels. So in particular under one alternative, you
wind up with 30,000 troops involved in those activities by 2010, so
a more aggressive phasing out; and then the other alternative you
wind up with 75,000 troops by 2013. Under both alternatives there
is more spending than under the baseline in the short term, and
there is less spending by 2017 than in the baseline.
Chairman S
PRATT
. That is, the baseline otherwise carries for-
ward the $70 billion thus far appropriated in 2007?
Mr. O
RSZAG
. Correct. Under the first alternative that I men-
tioned in which you wind up with 30,000 troops there is a net—
over the 10-year window, you have those higher costs at the begin-
ning and lower costs at the end, a net budgetary savings of a little
bit over $300 billion. Under the second alternative where you have
a slower phase-down, and you wind up with a higher troop level
relative to the first alternative, there is a net budgetary cost, in-
cluding debt service, of a little bit over $200 billion, and that is be-
cause your savings don’t quite offset the nearer-term costs.
Chairman S
PRATT
. On page 2 when you say that the—if you
make these assumptions that the deficit would be $476 billion in-
stead of a surplus of $249 billion in 2017, what assumption are you
making about the ongoing war costs?
Mr. O
RSZAG
. That just takes the baseline assumptions with re-
gard to discretionary spending.
Chairman S
PRATT
. Seventy billion dollars and carries it forward.
Mr. O
RSZAG
. Correct.
Chairman S
PRATT
. So it tends to understate the near term and
probably, we hope, overstate the outyears. But in any event, once
you make these adjustments, the path we are looking at is radi-
cally changed; is it not?
Mr. O
RSZAG
. For example, under the change in policy that I
showed you with discretionary spending excluding the war on ter-
rorism, keeping pace with overall economic growth and with the
tax provisions extended and the alternative minimum tax sta-
bilized instead of having a falling deficit and moving it to surplus,
VerDate 0ct 09 2002 16:26 Mar 14, 2007 Jkt 000000 PO 00000 Frm 00022 Fmt 6633 Sfmt 6602 J:\DOCS\HEARINGS\110TH\110-3\32919.TXT HBUD1 PsN: DICK
19
you have a rising deficit as a share of the economy from a little
under 1
1
⁄
2
percent of the economy this year to more than 3 percent
of the economy by the end of the budget window.
Chairman S
PRATT
. So the choices we make this year and next
year are going to have a profound effect on the outyears and deter-
mine whether or not we continue on the deficit-ridden path we
have been taking, or whether or not we begin to put this budget
back into balance in 2012.
Mr. O
RSZAG
. There clearly is, even over the 10-year window, an
impact from changes in policy or from policy choices on budgetary
outcomes. And I would again note, though, what we do over the
next 10 years has importance, but the central long-term challenge
facing the Federal Government in terms of budgetary outcomes has
to do with that longer-term problem involving health care costs. So
we need to be able to keep both problems in mind.
Chairman S
PRATT
. One final question. One of the big issues, and
maybe one of the big differences between CBO and OMB, will be
revenue growth. Would you take just a minute to explain what you
have assumed, CBO has assumed, with respect to revenue growth
since substantial revenue growth over the last couple of years has
had a remarkable, dramatic effect upon the bottom line? I think we
have had 11.7 percent growth between 2006 and—between 2005
and 2006, and the question is, can we expect the growth rate to
continue at those high levels, or do you see it reverting to normal?
Mr. O
RSZAG
. Well, under the baseline we have an irregular pat-
tern of revenue growth because we incorporate current law with re-
gard to revenue. So the expiration of various tax provisions can
cause very significant growth rates around those sunset years, but
if you abstracted from that and so, for example, looked at a path
that did not allow the sunset to occur, what would happen is that
we would have somewhat slower revenue growth towards the end
of the projection period than towards the beginning for a couple of
reasons. One is that overall economic growth is projected to slow,
and I think this is a very important point. As the workforce enters
retirement age, the growth rate of the workforce will slow relative
to historical rates, and that will slow overall economic growth, and
that slower overall economic growth will have a dampening effect
on revenue growth also.
In addition to that phenomenon, the part of the revenue uptick
that we cannot explain based on known factors is assumed after
2008 to revert to more normal historical patterns because that is
the traditional way that—or that is what has tended to happen in
the past, that these sort of forecast errors or unexplained compo-
nents tend to revert to more normal patterns relative to the econ-
omy as a whole. So that is what we assume after 2008.
Those two factors may well mean that our revenue growth in the
outyears and, you know, in 2016 and 2017 is slower than the ad-
ministration’s projections, but we will need to wait and see what
the projections are when they release their budget next month.
Chairman S
PRATT
. Thank you very much, Mr. Orszag.
Mr. O
RSZAG
. Mr. Spratt, if I could quickly make one—the $588
billion figure you mentioned is the change for all mandatory spend-
ing, which includes the $445 billion for Medicare and then addi-
tional spending on Medicaid and some others.
VerDate 0ct 09 2002 16:26 Mar 14, 2007 Jkt 000000 PO 00000 Frm 00023 Fmt 6633 Sfmt 6602 J:\DOCS\HEARINGS\110TH\110-3\32919.TXT HBUD1 PsN: DICK
20
Chairman S
PRATT
. But the point I was trying to make was even
with these substantial favorable developments, when you go back
and factor in the tax cuts extension in 2010, and you factor in the
cost or the likely cost of the war, and you leave the—you assume
that the AMT will be sort of neutralized in place, you have got a
profound change in the course of the budget, and we are back deep
in deficits again, notwithstanding these very favorable changes you
have made otherwise to your forecast; is that a correct simulation?
Mr. O
RSZAG
. Again, changes in policy relative to current law with
regard to both revenue and spending could have a significant effect
on budgetary outcomes over the next 10 years.
Chairman S
PRATT
. Thank you, sir.
Mr. Ryan.
Mr. R
YAN
. First, let us go back to the Medicare savings you
talked about. Your new baseline says that Medicare spending is
projected to be $445 billion less than the August baseline; is that
correct?
Mr. O
RSZAG
. That is correct.
Mr. R
YAN
. Break that down again; $265 billion for Part D.
Mr. O
RSZAG
. For Part D. The rest appears to be concentrated
mostly in Part A, but we are still looking at exactly what is going
on between Part A and Part D.
Mr. R
YAN
. And the $265 billion savings off the August baseline
comes from what exactly?
Mr. O
RSZAG
. The majority comes from the lower cost per bene-
ficiary; in other words, the PDPs, the prescription drug plans, and
the Medicare advantage plans are coming in lower than we pro-
jected.
Mr. R
YAN
. So that is lower cost because lower prescription drug
prices are being reimbursed?
Mr. O
RSZAG
. Correct.
Mr. R
YAN
. And so you are seeing downward bend in the growth
curve in Medicare in the new program, Part D and Medicare ad-
vantage, than previously. And enrollment, you said your enroll-
ment numbers are getting lower because people are getting cov-
erage elsewhere; is that right?
Mr. O
RSZAG
. Before I get to that, it is not really that the cost
growth in—out in 2016 or 2017 has changed, but rather that there
is just a lower level.
Mr. R
YAN
. Right. You are knocking the base down and then move
forward.
Mr. O
RSZAG
. Correct. In addition to that factor, while enrollment
in the very near term has actually been higher than we projected,
slightly higher, we now have more information about other cov-
erage that Part D beneficiary—or Medicare beneficiaries have, so
instead of assuming that 87 percent of beneficiaries would take up
Part D, we are now in the outyears assuming that 78 percent
would, and that leads to lower costs.
Mr. R
YAN
. Eighty-seven to seventy-eight, you said?
Mr. O
RSZAG
. Correct.
Mr. R
YAN
. Well, you mention budget policy alternatives to get to
balance, which basically we talk about war costs, discretionary
spending and tax policy. There aren’t really any alternatives of-
fered in the entitlement side of the budget in this new outlook.
VerDate 0ct 09 2002 16:26 Mar 14, 2007 Jkt 000000 PO 00000 Frm 00024 Fmt 6633 Sfmt 6602 J:\DOCS\HEARINGS\110TH\110-3\32919.TXT HBUD1 PsN: DICK
21
It seems that something good has happened in Medicare. It
seems that something favorable has happened in Part D where you
have—just in one part of this large entitlement program you have
got a savings of $265 billion, which without coincidence is the new
part that involves more competition within the program which is
bringing more savings not only to the beneficiary, but to the tax-
payers. Is that not an area that we can discover more as far as fu-
ture health care spending direction to go toward a competitive
model like the Part D program? Does that not lay sort of a ground-
work that perhaps where we are seeing substantial savings in the
new competitive model within this entitlement program, that that
might be a place for more savings to be got in other parts of these
entitlements?
Mr. O
RSZAG
. Well, again, I don’t want to jump to conclusions be-
cause of the cause of the reduction, but I would fully agree with
you that it is encouraging, and, in fact, you know, to the extent
that it is continued, could have a material effect on Medicare pro-
jections in particular.
Mr. R
YAN
. It just seems to me that this is something we need
to look at quite a bit more because this is—of all the good news
in this, it is all overshadowed by the entitlement explosion. But
within the entitlements we are seeing less spending because of this
new program, which is providing a competitive product where pro-
viders compete against each other for beneficiaries’ business, and
that active competition has actually lowered the cost of the pro-
gram.
Let me go over the revenue estimates. Obviously if you take a
look at the baseline—I won’t ask for the chart back up. If you just
let the tax cuts go away to go to balance, and that is all the tax
cuts you are talking about, all the 2001 and 2003 and the expiring
provisions, those are what you assume go away because that is
what current law is, and that is what brings us into surplus in
2012, correct?
Mr. O
RSZAG
. Correct.
Mr. R
YAN
. So that means if we get rid of the per child tax credit,
if we get rid of the marriage penalty, if we raise income tax rates
across the board on every taxpayer, if we bring the death tax pack
to pre-2000 levels, and if we get rid of the lower rates on capital
gains and dividends, those are all of the tax cuts you are talking
about go away, then we will go back in the balance and therefore
surplus, right?
Mr. O
RSZAG
. That is the alternative, the change in policy that is
shown in table 1-5.
Mr. R
YAN
. It is the revenue estimates themselves that give me
a little bit of a cause for concern. If you take a look at CBO’s fore-
casting record on overall revenue, let us just take a look at one of
these components, capital gains taxes, which I would argue prob-
ably has the best macroeconomic feedback effect of any of these tax
changes. I am not saying all tax cuts pay for themselves, but if you
take a look at the initial CBO forecast, say, for the lower rate on
capital gains taxes, CBO projected revenue to be $42 billion in
2003, $46- in 2004, $52 billion in 2005 and $57 billion in 2006. And
what actually had occurred was 51- in 2003, 72- in 2004, 97- in
2005, and $110 billion in 2006. Overall CBO’s forecast on capital
VerDate 0ct 09 2002 16:26 Mar 14, 2007 Jkt 000000 PO 00000 Frm 00025 Fmt 6633 Sfmt 6602 J:\DOCS\HEARINGS\110TH\110-3\32919.TXT HBUD1 PsN: DICK