INDIAN MINING & CONSTRUCTION EQUIPMENT INDUSTRY doc
Bạn đang xem bản rút gọn của tài liệu. Xem và tải ngay bản đầy đủ của tài liệu tại đây (557.96 KB, 48 trang )
FINAL REPORT ON THE INDIAN CAPITAL GOODS INDUSTRY
115
INDIAN MINING & CONSTRUCTION EQUIPMENT INDUSTRY
BACKGROUND & HISTORICAL TRENDS
Construction and mining equipment cover a variety of machinery such as hydraulic
excavators, wheel loaders, backhoe loaders, bull dozers, dump trucks, tippers,
graders, pavers, asphalt drum / wet mix plants, breakers, vibratory compactors,
cranes, fork lifts, dozers, off-highway dumpers (20T to 170T), drills, scrapers, motor
graders, rope shovels etc. They perform a variety of functions like preparation of
ground, excavation, haulage of material, dumping/laying in specified manner, material
handling, road construction etc. These equipment are required for both construction
and mining activity.
With a wide production capacity base, India is perhaps the only developing country,
which is totally self-reliant in such highly sophisticated equipment.
India has only a few, mainly medium and large companies in the organized sector who
manufacture these. The technology barriers are high, especially with respect to
mining equipment and therefore the role of SME’s is restricted to manufacture of
components and some sub-assemblies.
Prior to the 1960s, domestic requirements of mining and construction equipment were
entirely met by imports.
Domestic production began in 1964 with the setting up of Bharat Earthmovers Ltd.
(BEML), a public sector unit of the Ministry of Defence, at Kolar in South India to
manufacture dozers, dumpers, graders, scrapers, etc. for defence requirements under
licence from LeTorneau Westinghouse, USA and Komatsu, Japan. In the private
sector, the Hindustan Motors’ Earthmoving Equipment Division, was established in
1969 at Tiruvallur, near Chennai with technical collaboration from Terex, UK for
manufacture of wheel loaders, dozers & dumpers. This factory has since been taken
over by Caterpillar for their Indian operations. The machines manufactured by
Caterpillar in the Tiruvallur factory are marketed by TIL and GMMCO.
In 1974, L&T started manufacturing hydraulic excavators under license from Poclain,
France. In 1980 and 1981, two more units, Telcon and Escorts JCB commenced
manufacture of hydraulic excavators (under license from Hitachi, Japan) and backhoe
loaders (under license from JCB, UK) respectively. Escorts JCB has been taken over
by JC Bamford Excavators Ltd. U.K. in 2003 and is now called JCB India Ltd. In 1970s
Escorts Limited started manufacturing Cranes in collaboration with Faun AG and
Rapier & Ransome.
Volvo and Terex Vectra are the most recent entrants in the Indian market. Volvo has
set up their manufacturing unit in Bangalore.
FINAL REPORT ON THE INDIAN CAPITAL GOODS INDUSTRY
116
At present they are only manufacturing tippers and the other equipment are imported
from their parent company and marketed in India.
Terex Corporation USA and Vectra Ltd. U.K. have formed a joint venture, which has
started manufacturing construction equipment like backhoe loaders and skid steer
loaders from May ’04 at Greater Noida with an investment of USD 12 million. Other
equipment in the Terex range are being sold through their agents in India.
Most of the technology leaders like Case, Caterpillar, Hitachi, Ingersoll-Rand, JCB,
John Deere, Joy Mining Machinery, Komatsu, Lieberr, Poclain, Terex, Volvo are
present in India as joint venture companies, or have set up their own manufacturing
facilities, or marketing companies.
The industry has made substantial investments in the recent past for setting up
manufacturing bases, despite small volumes and uneconomic scales of production
compared to global standards.
Current Status in India
The growth of this sector is interlinked with the growth of the Indian economy and
indirectly with the growth of infrastructure. This is evident from the graph shown
below:-
CO-RELATION BETWEEN STATUS OF ECONOMY AND THE INDUSTRY
4.0%
8.5%
6.9%
10.5%
13.6%
13.3%
12.1%
15.0%
33.0%
0.0%
5.0%
10.0%
15.0%
20.0%
25.0%
30.0%
35.0%
2002-03 2003-04 2004-05
Earthmoving & Construction sector growth rate
% change in GDP
%change in IIP in capital goods
Chart 1
The last few years have witnessed a phase of restructuring in the industry through
acquisitions and joint ventures. This also reflects the active interest of international
majors in the domestic market. Many international players have also appointed selling
agents for importing and selling complete equipment in India.
FINAL REPORT ON THE INDIAN CAPITAL GOODS INDUSTRY
117
The construction and mining equipment industry is dominated by a few large
manufacturers in each product segment. BEML supplies to nearly half the total
market. BEML and Caterpillar lead in dumpers and dozers while L&T Komatsu and
Telcon lead in excavators , JCB India in backhoe loaders and Escorts Construction
Equipment Ltd. in Mobile Cranes.
The major players in this segment who are also members of the Indian Earthmoving
and Construction Industry Association Ltd. (IECIAL) are as follows :
Ashok Leyland Ltd.
Bharat Earth Movers Ltd.
Caterpillar Commercial Pvt. Ltd.
Escorts Construction Equipment Ltd.
GMMCO Ltd.
Greaves Cotton Ltd.
Ingersoll Rand India Ltd.
JCB India Ltd.
L&T Komatsu Ltd.
Larsen & Toubro Ltd. (Construction Equipment Division)
Mahindra & Mahindra Ltd.
Schwing Stetter India Pvt. Ltd.
Tatra Trucks India Ltd.
Telco Construction Equipment Co. Ltd.
TIL Ltd
Voltas Ltd.
Volvo India Pvt. Ltd.
Wirtgen India Pvt. Ltd.
The other prominent players in the segment are :
Appollo Earthmovers
Apollo Industrial Products
Braithwaite & Co. Ltd.
Elecon Engineering Co. Ltd.
Godrej & Boyce Mfg. Co. Ltd.
Gujarat Appollo Equipment Ltd.
Heavy Engineering Corporation Ltd.
Hyderabad Industries Ltd.
International Combustion (India) Ltd.
Jessop & Co. Ltd.
Macneil Engineering
Mukand Ltd.
Shethia Erection & Material Handlers
TRF Ltd.
WMI Cranes
FINAL REPORT ON THE INDIAN CAPITAL GOODS INDUSTRY
118
Structure of the Sector
71% of the sector comprises of public limited companies including PSU’s and 29%
private limited, or joint ventures including closely held private limited companies.
TURNOVERWISE SEGMENT
Below 100
crores
31% of
companie
s
>500
crores
25% of
companie
s
100-500
crores
44% of
companie
s
Chart 2
75% of the companies manufacturing in India were involved in the entire range of
activities like design and engineering, manufacturing, erection, servicing and
commissioning. There are only a few companies who act as selling agents for
international players. There are others who manufacture and also import complete
equipment or in SKD condition from their principals abroad and market them.
Since each piece of the equipment in this product category has substantial value, a
number of companies have a turnover of over 100 crores and the larger ones have a
turnover above Rs.1000 crores. The technology barriers have made the industry less
fragmented in the mining machinery sector whereas it is fragmented in the road
construction equipment and the material-handling segments. The international trend
in the earthmoving and mining segment is one of consolidation. This trend is also
beginning to be seen in India. Some international companies are looking at the
prospects of enhancing their market presence based on higher investment in mining
and infrastructure and also using their Indian operations to meet demand in South and
South East Asia.
The industry’s expectations of the likely future evolution in this sector is represented
here in graphical form. Most of the current players expect that new players will enter
the Indian market.
FINAL REPORT ON THE INDIAN CAPITAL GOODS INDUSTRY
119
INDUSTRY'S VIEWPOINT OF FUTURE EVOLUTION
ENTRY OF NEW
PLAYERS
65%
CONSOLIDATION
35%
Chart 3
Technology
The construction and mining equipment sector has a wide range of products. For the
purpose of this study, this is taken to mean the following :
Construction Equipment Mining Equipment
Backhoe Loaders Motor Graders (above 200 HP)
Crawler Dozers upto 320 HP Dozers (above 320 HP)
Crawler Excavators above 3.5 Cu.M. Hydraulic Excavators (65 T and above)
Loaders Rope Shovels
Motor Graders (below 200 HP) Drag Lines
Skid Steer Loaders Drills
Wheel Loaders (below 3 Cu.M.) Wheel Loaders above 3 Cu.M.
Vibratory Compactors Surface Miners
Dump Trucks (below 35 T) Off Highway Dumpers (above 35 T)
Tippers Continuous Miners
Road Milling Machines Long Wall Equipment
Asphalt Pavers Batching Plants
Asphalt Drum / Wet Mix Plants
Fork Lifts
Tower Cranes
Mobile Cranes – Pick & Carry
Mobile Cranes 360
o
slew
Transit Mixers
The worldwide technology leaders in the construction equipment sector are: Komatsu,
Caterpillar, Hitachi, Terex, Volvo, Scania, Case, Ingersoll-Rand, HAMM, Bomag, John
Deere, JCB, Poclain, Bitelli, Hyundai, Kobelco and Daewoo. Almost all the companies
have presence in India either as joint ventures, or have set up their own
manufacturing facilities, or marketing companies.
In the mining sector, the leaders are: Hitachi, Komatsu, Wrigten, Atlas Copco,
Liebherr, Joy Mining Machinery, Terex, Bucyrus Erie and DBT. Out of these
companies, DBT and Joy Mining Machinery are present only through their marketing
network and provide sales support.
FINAL REPORT ON THE INDIAN CAPITAL GOODS INDUSTRY
120
In the construction equipment sector, the level of technology prevalent internationally
can be made available in India through joint ventures. However, the equipment
currently being manufactured in India is not of the same size. For example for a 15
Cu.M. hydraulic shovel, the manufacturers do not feel the need to bring in the
technology due to low volumes and uncertain demand though the companies have the
manufacturing facilities and design capabilities to manufacture the same in India.
Some of the other reasons for not manufacturing the latest equipment are :
• The Indian market cannot absorb the cost of the latest technology
• If manufactured in India for export markets, most of the components will have
to be imported
• Equipment adhering to the latest emission norms cannot be used since the
quality of fuel required for them is yet to be made available here. At the same
time, off highway construction and mining equipment do not need stringent
emission norms in India.
The construction equipment sector in India has evolved over the years and is at
present in an intermediate stage of development. The industry is trying to bring in
international levels of technology as demand and the scale of operation increases.
In India both premium, latest state-of-the-art technology equipment and value for
money low cost products exist simultaneously. The high technology state-of-the-art
products can be manufactured in economical quantity only if the users are compelled
to use them due to environmental and ecological reasons. The reasons for latest
technology equipment not finding favor with the users lie in the fact that these are very
costly because maximum percentage of components are imported and with the rupee
depreciation, the cost of these components have been going up and hence the
equipment are not affordable as the cost of projects go up. Further reason for India
taking a longer period for evolving towards state-of-the-art equipment is partially due
to socio economic factors.
Though it has been observed that the user sector with the growing FDI are likely to be
more geared towards the state-of-the-art technology machines which are more
productive, low in maintenance cost and provide comfort for operators. These ranges
would reign supreme among the private players. The users are now not looking at
only the initial cost of the equipment, but focusing on total costing, or cost per ton of
usage. It is anticipated that 5 years hence, the need for more and more mechanization
and enhancement of scale may lead to change in the level of technology in use.
However, it is a fact that Indian companies would have to move towards the state of
the art technology, but the manufacturers would also try to keep a balance between
the state of the art and user friendly machines as well as try to provide the relevant
technology levels which provides value for money to the customers.
FINAL REPORT ON THE INDIAN CAPITAL GOODS INDUSTRY
121
Design & Engineering
Most manufacturing companies in this sector in India have design and engineering
departments catering to their in-house requirements and all of them are fairly well
equipped using CAD/CAE. This is required because while the products may be fairly
standard, there are changes, which need to be incorporated as per customer
specifications and for product development.
The percentage of engineering hours spent on doing engineering rework was found to
be an average of 12% ranging from 0.5% to 20% in some companies.
90% of the companies with technology collaborations have completed technology
absorption. However most of the critical components are being imported and most of
the technology absorption is in terms of non-critical items, or medium / low technology
items. 35% of the companies however, faced problems in retaining the personnel who
have been trained abroad during the technology absorption phase.
Research & Development
65% of the companies surveyed have their own R&D set up and 90% of them have
started allocating for R&D since the 1990s.
However, the percentage of sales budgeted for R&D was meagre ranging from 0.5 to
3% of sales. 35% of the companies surveyed worked in collaboration with some
educational/domestic research institutes. The prominent amongst them being the IIT’s
and IISc Bangalore.
When benchmarked against global companies, it was noted that companies like
Caterpillar, Komatsu and Volvo spent approximately 3% of sales on R&D, which is
USD 880 Mn., 34000 Mn. Yen, 975 Mn. SEK respectively compared to the highest
spender in India investing approx. Rs.16 crores.
Although many of the manufacturers have established full-fledged R&D units to
update their products/technologies, the industry in India does not invest adequately in
R&D activities compared to world leaders like Caterpillar or Komatsu, as the existing
market cannot absorb the development costs. However, we may see more R&D
work by world majors in India, taking advantage of low R&D manpower costs.
Management Efficiencies
The industry is quite mature in terms of marketing abilities as compared to the other
sectors of the capital goods industry. Majority of the companies have strategic
planning programmes in place and have well chalked out business strategies at all
levels.
FINAL REPORT ON THE INDIAN CAPITAL GOODS INDUSTRY
122
In order to enhance their market share, companies need to improve quality and
service followed by reduction in costs, increase in product range and finally adopt
more aggressive marketing strategies. The competitive edge lies in satisfying
customers by delivering higher quality products at lower prices.
Strategic alliances are already in place among 60% of the companies surveyed.
These are primarily focused on developing and combining competencies with the help
of other organizations in terms of marketing, after sales service etc. Only 45% of the
companies are interested in growth through mergers and acquisitions.
The level of quality consciousness is on an average higher than the other sectors
probably because the companies are larger and many of them are associated with
international companies either for manufacturing or marketing their products. Another
reason for higher quality consciousness is that more companies in this sector are well
versed with the soft technologies being used worldwide for enhancing competitiveness
and quality. Approximately 90% of the companies covered under the study have
either implemented, or are implementing soft technologies like six sigma, lean
manufacturing etc. 100% of the companies manufacturing in India are ISO certified.
It was noticed that the percentage of scrap due to errors in manufacturing is between
2% & 5% and the percentage of labour hours spent on reworking was 4%. All the
manufacturing companies train their workers on quality concepts. However the
percentage of workers who received company sponsored training on quality concepts
in the past two years varied from 20% to 100% in some companies.
The average number of hours per person of training provided was approximately 16
hours per person varying from 6 hours to 35 hours per person per annum.
Most of the companies were quite responsive to customer complaints and the average
number of days taken to respond varied from ½ a day to 5 days in some companies.
More than 70% of the companies have undergone business process reengineering for
higher customer satisfaction.
It has been observed that the majority of the companies in this sector are between
medium and high users of computerization. The various activities computerized by
the percentage of companies are shown in chart 5.
FINAL REPORT ON THE INDIAN CAPITAL GOODS INDUSTRY
123
LEVEL OF COMPUTERIZATION OF COMPANIES
HIGH
45%
LOW
5%
MEDIUM
50%
100%
80%
50%
35% 35%
0%
10%
20%
30%
40%
50%
60%
70%
80%
90%
100%
TRANSFER OF
BUSINESS
INFO
INVOICES INTEGRATIN
WITH MRP OR
PRODUCT
SCHEDULING
Chart 4 Chart 5
This level of computerization is also comparatively high compared to the other sectors
of the capital goods industry. Yet the percentage of IT expenditure to sales in the last
one year i.e. 2004-05 was a meagre 0.5% of the total sales i.e. Rs.32 crores was
invested by the industry towards computerization either for ERP / SCM / CRM.
SOFTWARES USED BY COMPANIES
CRM
23%
SCM
5%
ERP
72%
Chart 6
ERP or enterprise resource planning is an industry term for the broad set of activities
supported by multi product application software that helps a manufacturer to manage
the important functions of its business including product planning, parts purchasing,
maintaining inventories, interaction with suppliers, providing customer service and
tracking orders.
Supply Chain Management (SCM) is the management of the entire value added chain,
from the supplier to manufacturer right through to the retailer and the final customer.
SCM has the primary goal of reducing inventory, increasing the transaction speed by
exchanging data in real time and increasing sales by implementing customer
requirements more efficiently.
CRM (Customer Relationship Management) entails all aspects of interaction a
company has with its customers, whether it be sales or service related. CRM is an
information industry term for methodologies, software and usually internet capabilities
that help an enterprise manage customer relationships in an organized way.
FINAL REPORT ON THE INDIAN CAPITAL GOODS INDUSTRY
124
Companies need to be in constant touch with their customers over the electronic
media. The percentage of companies using ERP solutions is high with quite a
significant number also using CRM for better customer relationship management.
However, all the players need to be better integrated with both their suppliers and
customers to strive to be the market leader.
After-sales service is an important aspect of a company’s successful business
strategy because all customers would like higher productivity and utilization from their
machines in order to be cost competitive. Hence this is an area no company can
afford to ignore or accord a lower priority to.
All the companies surveyed whether manufacturing, or trading, offered after-sales
service to their customer and it was also noted that 70% of them have entered into
this field in the last ten years.
Equipment manufactured by the industry is mostly mobile and hence subjected to
higher wear and tear and consequently maintenance requirements are higher.
Users rate machines with lower downtime higher. Hence, training of maintenance
personnel both of manufacturers as well as users’ is a very important aspect of
managing customer relationships. This is also evident from the fact that all the
companies spent on training and the majority of them (60%) spent more than Rs.1
lakh per month. Only 40% of the companies spent less than Rs.10 lakh per annum
on employee training
.
TRAINING EXPENDITURE
10 LAKHS AND BELOW
41% of the companies.
10-50 LAKHS
59%of the companies
Chart 7
The average response time for responding to customer calls is 24 to 48 hours and in
premium service contracts it varied between 12 to 36 hours. 91% of the maintenance
calls were completed within the specified time frame.
From the user feedback, it emerged that the deliveries of most of the companies were
delayed. Hence many customers preferred to import second hand machines.
Scheduling is therefore required to be strictly followed by all the companies for
manufacturing, and approximately 90% of them use one, or the other software to
enhance efficiency in manufacturing. Yet the percentage of companies where the
shipments are before/within the due date is very low at only 50%.
FINAL REPORT ON THE INDIAN CAPITAL GOODS INDUSTRY
125
PERCENTAGE OF TIMELY DELIVERY TO CUSTOMERS
Within 70-80%
12% of companies
Within 80-90%
41% of companies
Below 70%
6%of companies
Above 90%
41% of companies
Chart 8
A clear distinction was noticed in terms of reasons for late delivery.
Companies predominantly manufacturing construction equipment have
attributed more than 70% of their late deliveries to delay in customer
clearance.
Whereas companies predominantly manufacturing mining equipment have
attributed the majority of their delays to delay in material availability largely
as a result of imports as well as delays in manufacturing.
The reason for late deliveries is attributed mainly to the growth in domestic demand,
which was not foreseen earlier by the companies. Delays were therefore mainly
attributed to capacity constraints. A fall out of delayed delivery has been higher
imports both for new machines, as well as second hand machines.
This issue can be tackled by enhancing capacity of both the manufacturers and their
sub-suppliers, tighter monitoring and scheduling and by greater usage of ERP / SCM.
Benchmarking with International Companies
Some broad indications in terms of benchmarking of the industry on the basis of
financial parameters have been done against a few global players, this is provided in
Annexure IV.
The companies against which Indian companies have been benchmarked are
Caterpillar, Komatsu and Volvo. They are the leaders in their respective fields.
Operational Efficiencies
Financial Parameters
The CII survey results showed that there has been a good growth rate in terms of
sales due to the higher investments by the user sectors. Though exports have also
risen, the percentage of exports to sales is low due to lack of competitive advantage of
machines built with indigenous technology. Wherever machines are built under
technology transfer, companies face restrictions on the export market territory from
the technology provider.
FINAL REPORT ON THE INDIAN CAPITAL GOODS INDUSTRY
126
SALES AND EXPORTS OF DOMESTIC
COMPANIES
4150
6300
4750210
215
264
0
1000
2000
3000
4000
5000
6000
7000
2001-02 2002-03 2003-04 2004-05
0
50
100
150
200
250
300
TURNOVER EXPORTS
Exports as a percentage of sales
5.40%
14.70%
0.00%
2.00%
4.00%
6.00%
8.00%
10.00%
12.00%
14.00%
16.00%
For the industry For the non-
electrical
machinery
2003-04
Chart 9 Chart 10
As is evident, the cost of raw materials as a percentage to sales witnessed a fall in
2003-04 probably due to better supply chain management on the part of the
respondent companies. However the unprecedented rise in steel prices in 2004-05
has offset the reduction.
RAW MATERIAL AS A PERCENTAGE OF
NET SALES
63%
62%
64%
62%
62%
63%
63%
64%
64%
65%
2002-03 2003-04 2004-05
Percentage of Power consumed to
sales
0.89%
0.82%
0.82%
0.78%
0.80%
0.82%
0.84%
0.86%
0.88%
0.90%
2002-03 2003-04 2004-05
Chart 11 Chart 12
The power consumed to sales has shown a decline because all companies are now
conscious about energy conservation and use various methods like automatic
switching of systems and higher efficiency / low consumption electrical appliances etc.
Value added for an industry is the difference between the value of the output and the
value of the input namely raw materials & bought outs. In other words we can attribute
this difference to the value added to the product by the company.
FINAL REPORT ON THE INDIAN CAPITAL GOODS INDUSTRY
127
VALUE ADDED AS A PERCENTAGE OF NET SALES
33%
38%
37%
30%
31%
32%
33%
34%
35%
36%
37%
38%
39%
2002-03 2003-04 2004-05
Chart 13
The value addition has risen over the years because more manufacturing has taken
place in 2003-04 in place of trading as compared to the earlier years. It has again
shown a fall due to the rising raw material prices in 2004-05.
Inventory on an average was found to be 26 percent of net sales.
Average Turnover of Inventory for 2004-05 was found to be 4.
The international benchmark is between 5 - 7.
The number of days sales outstanding is on an average within 90 days, which is at par
with the engineering industry. This is also in keeping with international trends.
OUTSTANDING
85
81
83
79
80
81
82
83
84
85
86
2002-03 2003-04 2004-05
No.of days sales
Chart 14
Cost of wages to sales was found to be 11.8 percent in 2004-05. The range varied
from a low of 3 percent to a high of 28 percent.
For Caterpillar Inc. the ratio was 19.8 percent.
FINAL REPORT ON THE INDIAN CAPITAL GOODS INDUSTRY
128
The employee productivity is fairly low as compared to international companies.
Sales per employee on an average for the industry was found to be Rs.35 lakhs but
for the manufacturing companies it was found to be Rs.32.5 lakhs.
This is the reason why though the cost of wages per employee is very low at Rs.4
lakhs, the lower productivity of the employee offsets the advantage. The value added
per employee was only Rs.11 lakhs.
The global standards for employee productivity i.e. sales per employee is in the
range of Rs.160-175 lakhs.
Profitability
The industry in India witnessed a tremendous jump in profitability in 2004-05 over
2003-04. The return on capital employed is 24 percent and has increased by 85
percent over 2003-04. The PBIT has increased by 112 percent and PAT by 145
percent.
Operating profit to sales for Caterpillar Inc. was 9.7 percent
The PBIT to sales on an average was better in the case of Indian companies as
compared to international companies operating worldwide like Caterpillar Inc.,
Komatsu or Volvo at 12 percent.
However the capital employed has gone up by 14 percent since many companies had
undertaken debt restructuring. Most of the companies have a very low debt ratio. In
fact some of the companies have zero debt.
Capital Investment
The capex plans however are not so encouraging as compared to the profitability
seen by the industry. Only 50 percent of the companies have capex plans and the
amount is only 300 crores over the next 3 years.
Productivity Parameters
Machine and labour utilization
CAPACITY UTILIZATION
<70%
> 85%
70-85%
20%
40%
40%
LABOUR UTILIZATION
80-90%
70-80%
>90%
40%
33%
27%
Chart 15 Chart 16
FINAL REPORT ON THE INDIAN CAPITAL GOODS INDUSTRY
129
In 2003-04 the capacity utilization in this sector ranged between 50 percent to 85
percent depending on the market conditions. By and large the more efficient
companies were operating at a level of 85 percent or more capacity utilization .
It is interesting to note that the industry is experiencing delays in delivery due to
capacity constraints. Yet at the same time the capacity utilization and levels of
utilization of labour are not significantly high. This can be attributed to breakdowns as
a result of inadequate maintenance, absenteeism, sub-contracting due to the
attraction of lower prices and delays in receiving materials and components due to
delays in imports.
Machine breakdown ranged from 0.5 to 10 percent and most of the companies
followed systems of periodic and preventive maintenance.
Supply Chain. Procurement lead-time was very high in this sector ranging from 2
weeks to 6 months. The reason being that this industry has a large number of
proprietary items, which need to be imported, and 35 percent of the raw materials
generally comprise of imported components. These components have to be imported
because of their non-availability in India and hence most of the companies require an
average of 1 month to 6 months as procurement lead-time. Most of the companies are
procuring 50 to 80 percent of their raw materials and bought out components within a
radius of 200 kms. from their manufacturing base .The lead time is high compared to
global leaders.
Though 100 percent of the companies have their vendors rated and have fairly good
supply chain management systems, yet the procurement lead-time is very high due to
the following reasons:
Lack of proper port/airport infrastructure
Cumbersome procedural delays while importing
Lack of high level of computerization and integration with the supplier
network
User Sector Feedback
From the responses received from some of the major users of construction and mining
equipment, it was noticed that large purchases were made in 2002-03 when the
Government investment in infrastructure projects like the Golden Quadrilateral was in
full swing. For the same companies demand has tapered since then. In the mining
sector the purchases have gone up in 2004-05.
25 – 30 percent of imported purchases made were of second hand equipment by the
large private players, however, none of the Government owned companies have
imported second hand machines.
One of the main reasons cited by some of the importers of second hand equipment
was the delayed delivery by domestic companies. Cost-wise there was no benefit
since the machines required total overhauling and retrofitting.
FINAL REPORT ON THE INDIAN CAPITAL GOODS INDUSTRY
130
When the indigenously available machines were benchmarked with the imported
machines the users felt that cost-wise, indigenously manufactured machines were
very competitive. The spare parts availability and servicing of the machines were
much better than the imported machines, though it still fell short of customers’
expectations.
Delivery of indigenously manufactured equipment was fairly poor though in a few
segments like compactors, it was at par with International players. However when it
came to technology, performance/productivity, reliability and downtime, the
indigenously manufactured machines were rated lower than the imported machines. In
the case of downtime, the domestic equipment had 10-15 percent higher downtime
than the imported machines.
Many of the international players in India do not manufacture the total range and
therefore imports were a necessity. In cases where a particular technology was
specified by the user industry, and the same was not available in India, the machines
were required to be imported.
According to the operations and maintenance personnel of the user industry the
priority that they gave while rating a machine was in the following order:
Less downtime
Ease of maintenance
Power/Fuel consumption
Efficiency
Availability of spares parts and servicing
Eco-friendliness of the machine.
Indian manufacturers gave good service and spares backup at a reasonable cost as
compared to International players. However, the user sector felt that there was scope
for tremendous improvement, especially as international players were appointing
agents in India who are gearing up to give service and training backup.
Market situation and Demand
The sector has seen a double-digit growth in its sales turnover for the past two years
with a phenomenal 33 percent growth in the previous year. The growth was seen
more in the mining equipment segment. There was comparatively lesser growth seen
in the construction and road making machinery. This may be viewed in the context of
the tapering off in demand under the national highway development programme from
the end of 2003.
The order backlog for the industry is Rs.3,400 crores as on 31
st
March 2005 which is
more than 50 percent of the projected sales of the industry for 2005-06.
FINAL REPORT ON THE INDIAN CAPITAL GOODS INDUSTRY
131
The domestic demand in 2004-05 was Rs.6,300 crores and it is estimated that the
demand in 2005-06 will be in excess of Rs.7,000 crores. Exports were to the tune of
Rs.280 crores in 2003-04 and Rs.330 crores in 2004-05.
SALES GROWTH
4150
6300
4750
14.5%
33%
0
1000
2000
3000
4000
5000
6000
7000
8000
2002-03 2003-04 2004-05
0
0.05
0.1
0.15
0.2
0.25
Sales in crores % increase in sales
EXPORT GROWTH
209
216
330
280
4.00%
18%
30%
0
50
100
150
200
250
300
350
2001-022002-032003-042004-05
0
0.05
0.1
0.15
0.2
0.25
0.3
0.35
Export in Rs crores % increase in exports
Chart 17 Chart 18
The industry is presently focused on meeting domestic requirements and is also
striving to be competitive in the world market.
The following indicates the prominent market players for certain broad category of
equipment in India:
Hydraulic
Excavators
Dozers &
Dumpers
Wheel
Loaders
Backhoe
Loaders
Road
Compactor
s
Cranes
Fork
Lifts
Telcon
(Hitachi)
BEML Caterpillar
India Ltd.
JCB India Ingersoll
Rand
ECEL Godrej
L&T-
Komatsu
Caterpillar
India Ltd
Telcon Telcon
(John
Deere)
Escorts
Constn.
Equipment
Ltd. (ECEL)
TIL
(Grove)
Voltas
BEML
Tatra
Udyog
JCB India L&T Case L&T Case Telcon TIL
JCB India
Voltas
(Unit Rig)
BEML BEML Greaves Ltd
(Bomag)
Voltas
(P&H)
McNeill
Engg.
Caterpillar
India Ltd
Volvo Caterpillar
India Ltd
FINAL REPORT ON THE INDIAN CAPITAL GOODS INDUSTRY
132
The equipment rental market is not yet fully developed but there are a number of
companies who are now entering into the business encouraged by the low interest
regime. This will further give a boost to the demand for small and medium sized
equipment. The lowering of customs duties and removal of age restrictions have
encouraged imports of second hand machinery used by the rental companies. This
has also found favour with contractors. It helps them to focus on their core
competencies of construction and project management, while having access to
equipment without significant investments.
Future prospects of this industry is directly linked to the Indian economy and it is
expected that the Indian economy will do well in the future.
In recent years, the core sector of the Indian economy, particularly the mineral and
mining industry, has made significant progress. The abundant mineral resources
available in the country have led to the growth of the mining industry. This industry is
basically labour intensive and can provide job opportunities for many. Mechanized
mining operations have become popular in the recent years. Today, more and more
companies engaged in open-cast mining resort to high mechanization in order to
maximize the output of coal and other minerals. As a result, there is a marked trend in
the introduction of large capacity and higher sized mining machines.
An overview of important user segments is given below:-
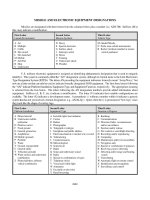
a. Mining
India is endowed with significant mineral resources and the mineral industry
constitutes an important segment of the Indian economy. India produces 89
minerals which include 4 fuel, 11 metallic, 52 non-metallic and 22 minor minerals.
A series of policy initiatives coupled with legislative changes have been carried out
for speeding up investments and induction of "State-of-the-art" technology in the
mining sector.
The Indian mineral sector represents a unique blend of small scale and large scale
mining operations. In spite of large-scale mining operations, India is essentially a
country of small-scale mining, since as much as 87% of the operations can be
considered as small scale. Out of about 3000 reporting mines in the non-coal
sector in India, only about 113 are operated by underground methods. The
underground mines are presently confined to base metals, manganese ore, gold,
chromate and some non-metallic minerals like soapstone, mica etc. The other
major minerals are lignite, iron ore and limestone (production of 30m, 70m and
120m tons respectively). Considerable developments have taken place during the
last few decades for enhancing the levels of production.
There are about 355 opencast mechanized mines in the country in the non-coal
sector. Some of the unique examples are the Kudremukh Iron Ore Mines,
Malanjkhand Copper Mines where mechanized mining is being carried out with
advanced technology. Technology changes in the design of mine equipment and
development of new stopping methods have made mining operations less
FINAL REPORT ON THE INDIAN CAPITAL GOODS INDUSTRY
133
arduous, more productive and safer. With the recent liberalization in the minerals
sector, it is envisaged that further technological upgradation / introduction of state-
of-the-art technology will take place to achieve the projected growth of mineral
production in the country.
During the period November, 1995 to January 1998, the Foreign Investment
Promotion Board approved 39 cases of Foreign Direct Investment in the mineral
sector with an investment of over $700 million. These proposals are mainly in the
fields of mining, exploration, mineral processing and technical consultancy.
73 applications for FDI involving investment of US$ 830 million have been
approved by the Government till 2004. 165 reconnaissance permits have been
granted for an area of 2,19,000 Sq. Km. till February 2004.
b. Coal:
India produces over 340 million tons of coal annually. Government owned Coal
India Limited (CIL) accounts for 90% of the total coal production. The other major
producers are Singareni Collieries and TISCO (West Bokaro). Coal India has
undertaken systematic planning and mechanization of coal mining in the
nationalised coalmines in Eastern and Central India. It has adopted open-cast
mining as the main mining method in preference to underground mining.
CIL is the biggest buyer of mining equipment in the country and has had a
dominant influence on the development of the mining equipment industry. It has
spearheaded adoption of innovative procurement and maintenance practices in the
country.
In recent years, mining companies have been off-loading excavation work to
private contractors leading to the development of a new segment in mining. The
Government of India is actively considering privatisation of coal mining to give a
boost to power generation. This development is expected to stimulate demand for
mining machinery.
During the year 2004-05 (01-04-2004 to 31-3-2005) 4 (four) project in coal sector
and 4 (four) in lignite sector were sanctioned by the Government. Besides, 5 (five)
advance action proposals (AAPs) were also sanctioned by the Government. The
list of such projects sanctioned by the Government are given below:
Coal Projects
Sl.
No.
Name of the projects Company
Latest
Capacity
(Mty)
Capital
(Rs. Crs.)
1 J.K. NAGAR UG (RPR) ECL 0.435 54.15
2. Kaniah OCP (PR) MCL 3.50 96.18
3. Kulda OCP (PR) MCL 10.00 302.96
4. Bhubaneshwari (PR) MCL 10.00 336.68
Source : Ministry of Coal Annual Report 2004-05
FINAL REPORT ON THE INDIAN CAPITAL GOODS INDUSTRY
134
Lignite Projects
Sl.
No.
Name of the projects Company
Latest
Capacity
(Mty)
Capital
(Rs. Crs.)
1 Mine_II Expansion NLC 4.5 MTPA 2161.28
2 TPS-II Expansion NLC 500 MW 2036.78
3 Barsingsar Lignite
Mining Project
NLC 2.10 MTPA 254.07
4 Barsingsar Thermal
Power Project
NLC 2X125 MW 1114.18
Source : Ministry of Coal Annual Report 2004-05
Advance Action Proposals
Sl.
No.
Name of the projects Company
Capacity
(MTY)
Sanctioned
(Rs.Crs.)
1 Mine-III NLC 8 MTPA 2.60
2 TPS-III NLC 2X500 MW 1.35
3 Coal based Thermal
Power Plant at
Tuticorin
NLC 2X500 MW 2.50
4 Coal based Thermal
Power Plant at Orissa
NLC 4X500 MW 18.65
5 Refinery Residue
Power Plant at
Chennai
NLC 492 MW 2.35
Source : Ministry of Coal Annual Report 2004-05
c. Infrastructure Construction
Ports
Maritime transport is a critical infrastructure for the social and economic
development of a country. It influences the pace, structure and pattern of
development.
Historically, investment in the transport sector, particularly in the ports, have
been made by the States. A large volume of resources have been required,
with long gestation periods, uncertain returns and various externalities, both
positive and negative. Major expansion is now required in the port
infrastructure sector in the country in order to handle the sea borne traffic on
account of increasing foreign and coastal trade. The planned investment in port
infrastructure will boost the demand not only of construction equipment but also
of port handling equipment.
FINAL REPORT ON THE INDIAN CAPITAL GOODS INDUSTRY
135
The major ports were opened for private sector participation in 1997 and till
date nearly Rs.10,000 crores of projects have either been implemented, or are
under progress. In addition, there have been huge investments in minor ports
under the State Maritime Boards. Container traffic in India has seen a
phenomenal 20% compound growth rate in the last decade. The traffic volume
has gone up from 0.68 MTEUs (Million Twenty Feet Equivalent Units) in 1990-
91 to 3.9 MTEUs in 2003-04. Recent policy initiatives taken by the Govt. will
give a further fillip to this growth. As per present trends in the EXIM trade,
container traffic is expected to increase to a level of 7.0 MTEUs by 2006-07.
To meet the demand, the ports have been expanding their infrastructure in a
big way. In addition, private ports have come up, particularly in Gujarat adding
to handling capacity in the region.
In the meantime, JN Port is planning a fourth container terminal with private
sector participation at an approximate cost of Rs.2000 crores. An investment of
nearly Rs.700 Crores is also on the anvil for deepening the channel so that
bigger ships can call at the port. The total investments planned or under
execution in the JN Port today are of the order of Rs.3500 Crores.
Urban infrastructure
Till recently, the main market for construction machinery, especially excavators
was the infrastructure sector. The demand now mainly comes from urban
construction comprising of housing/mall projects, petro-pipelines, minor
irrigation, and maintenance work. Versatile construction equipment such as
backhoe loaders are being offered on hire all over the country by small &
medium sized contractors and the equipment hiring sector is expanding
rapidly, leading to additional demand for equipment.
Mandatory requirements of equipment ownership by contractors and easy
availability of finance for equipment purchase have given a boost to the
development of a stable market for smaller construction equipment.
The centrally sponsored scheme for infrastructural development in mega cities
was initiated during 1993-94.
The primary objective of the scheme was to undertake infrastructure
development projects of city/regional significance covering a wide range of
components like water supply and sewerage, roads and bridges, city transport,
solid waste management etc.
The State Level Sanctioning Committees in the mega cities approved 675
projects at an estimated cost of Rs.8693.98 crore. An expenditure of
Rs.3834.34 crores has already been incurred on the approved projects. The
Mega City Nodal Agencies were making efforts to mobilise institutional finance
and an amount of Rs.1690.36 crore was mobilised from HUDCO and other
sources.
FINAL REPORT ON THE INDIAN CAPITAL GOODS INDUSTRY
136
With a view to catalyzing investment in townships, housing, built-up
infrastructure and construction-development projects as an instrument to
generate economic activity, create new employment opportunities and add to
the available housing stock and built-up infrastructure, the Government has
decided to allow FDI upto 100% under the automatic route in townships,
housing, built-up infrastructure and construction-development project (which
would include, but not be restricted to, housing, commercial premises, hotels,
resorts, hospitals, educational institutions, recreational facilities, city and
regional level infrastructure), subject to fulfillment of conditions prescribed in
the Department of Industrial Policy & Promotion Press Note No.2 (2005 Series)
dated 03.03.2005.
Centrally Sponsored Scheme for Infrastructure Development in Mega Cities
Physical progress (As on 30.09.05)
(Rupees in crore)
Name of
Mega City
No. of
Projec
ts
appro
ved
Total
Project
Cost Number of projects Funds released
Institutio
nal
Finance
moblise
d
Expendit
ure
incurred
Revolvi
ng
Fund
In
progr
ess
Comple
ted
Yet to
commence
Central
Share
State
Share
Mumbai 63 1785.58
23 39 1 330.02
273.04
297.88
772.35
314.08
Kolkata 130 1275.61
30 87 13 307.43
328.72
186.49
705.34
41.62
Chennai 200 2153.42
32 157 11 257.51
242.96
815.23
1595.57
319.26
Hyderabad
224 2067.05
62 109 53 257.73
257.21
183.93
475.94
21.00
Bangalore
58 1412.32
21 33 4 241.85
228.74
206.83
285.14
144.28
TOTAL 675
8693.98
168
425 82 1394.54
1330.67
1690.36
3834.34
840.24
The Union Government has permitted setting up integrated townships at the
following places:-
•
Gurgaon (Haryana)
•
Hyderabad (Andhra Pradesh) (two projects)
•
Mohali (Punjab)
•
Chennai (Tamil Nadu)
•
Bangalore (Karnataka)
•
Kolkata (West Bengal)
The annual estimated investment required for urban water supply, sanitation
and roads is around Rs.28,035 crores for the next ten years. The Central Public
Health Engineering (CPHEEO) has estimated the requirement of funds for 100
percent coverage of the urban population under safe water supply and
sanitation services by the year 2021 at Rs.172,905 crores. Estimates by Rail
FINAL REPORT ON THE INDIAN CAPITAL GOODS INDUSTRY
137
India Technical and Economic Services (RITES) indicate that the amount
required for urban transport infrastructure investment in cities with population of
100,000 or more during the next 20 years would be of the order of Rs.207,000
crores.
Road & Bridges Construction
The Government of India has identified improved infrastructure as the key to
achieving higher economic growth of the country. Modernisation of the road
sector has been taken up on a priority basis and the National Highway
Authority of India (NHAI) has been set up to implement & manage the time-
bound National Highway Development Programme (NHDP) consisting of four
and sixlaning of existing national highways linking all major cities. It comprises
of the 5,950 km. Golden Quadrilateral and the 7,300 km. North-South & East-
West Corridor Projects, to be completed by 2003 and 2007 respectively. NHAI
specifies qualifying criteria for bidders in terms of capital equipment to be
owned, construction methods to adopt and third party quality control by
consultants.
The funding for the highway programmes is generated by a levy of Re.1 per
litre cess on petrol & diesel. 50% of the estimated Rs.60 billion annual
collections are earmarked for development of rural roads.
The Ministry of Shipping, Road Transport & Highways has so far accorded in
principle approval to 81 proposals amounting to Rs.402.62 crores and 116
proposals amounting to Rs.521.24 crores under the Inter-State Connectivity
Scheme. An amount of Rs.170.59 crores (Rs.162.05 crores for the States and
Rs.8.54 crores for UTs) is earmarked for this purpose during the year 2005-06.
The construction equipment sector has witnessed a phase of high growth
during the NHDP (Phase I & Phase II) projects and continuing investment in
these projects will boost further demand for the sector.
Others:
Government of India’s policy to promote substantial investments in the
infrastructure sector comprising of power, communications (roads, railway, air
transport & shipping including Airports & Ports), telecom, urban infrastructure
coupled with ambitious plans drawn up by the core sectors of the economy
namely power, coal, steel, cement and mining is expected to generate
substantial demand for mining and construction equipment in the coming years.
Power, ports, airports, urban infrastructure sectors are expected to be taken up
in a big way.
As per the industry estimates, projections for future turnover in this sector is expected
to reach Rs.7300 crores in 2005-06, Rs.8400 in 2006-07 and Rs.9950 in 2007-08.
FINAL REPORT ON THE INDIAN CAPITAL GOODS INDUSTRY
138
Future Market
7300
8400
9950
15%
18%
0
2000
4000
6000
8000
10000
12000
2005-06 2006-07 2007-08
0
0.05
0.1
0.15
0.2
growth projection(Rs crores)
% increase over last year
Chart 19
In terms of the international scenario, the growth in the mining industry was strong
during the year especially in Chile and China. Australia and South Africa reached
historic growth levels. Prices continued to be favorable for the mining industry both for
base and precious metals. The growing demand in China for metals by the
construction and general engineering industry was a decisive factor for the increase in
prices for base metal. The construction industry continued to grow during 2004
although with regional variations. Development in North America and Asia were
positive, while it was weaker in Europe. In China the construction industry’s output
value rose by more than 20%.
The foreign investment gross inflows in the mining sector in Chile have increased from
$ 350 million in 2004 to $ 748 million in 2005. Since the beginning of 2005, BHP
Billiton has invested $ 19 billion in Australia, $ 10 billion on takeovers and about $ 9
billion on new and established projects. In 2004-05 the value of Australia’s overall
mine production has jumped 29% to $ 66 billion in 2005-06. The continuing surge in
prices and demand is expected to lift the total value of production to $ 84 billion in
2005-06.
The capital expenditure on mining in Australia has grown by $ 31 billion in the last
three years.
Mine Investments in 2004
Country Billion USD
Africa 15
Australia 14
Asia 13
North America 12
Chile 12
Peru 8
South Africa 7
Canada 7
Brazil 7
USA 4
Source: Raw Materials Data, Stockholm, Sweden January 2005
FINAL REPORT ON THE INDIAN CAPITAL GOODS INDUSTRY
139
Investments by the mining and mineral industry saw an increase as a result of the
strong international demand for metals.
This high investment in mining has encouraged world leaders like Komatsu to invest in
two new plants to expand its production capacity of large equipment. (Komatsu press
release dated 14-10-’05).
The U.S. economy is growing at more than 3%, employment is increasing only slightly
faster than the growth of the labor force, and core inflation is 2%. Interest rates should
continue to support growth, particularly in business investment, and the economy
should grow at more than 3.5% in 2005. The Canadian economy, benefiting from low
interest rates and high commodity prices, should grow at about 3% in 2005. Demand
is expected to be higher with rapid growth in both mining and non-residential
construction sectors.
The Euro-zone economies appeared to improve from the end of 2004, and the
European Central Bank is expected to hold interest rates steady through the middle of
the year. Overall European growth is expected to exceed 2% in 2005, somewhat
better than in 2004, and construction spending should continue to recover. It is
anticipated that economies in Africa and the Middle East will grow at about 4.5%, with
the Commonwealth of Independent States by more than 6%. Both regions will benefit
from favorable commodity prices and increased production of materials and energy
hence pushing up the demand for mining equipment.
Economies in Latin America should grow at more than 3.5% in 2005, as a result of
favorable metals and energy prices. Increased capital inflows and a more favorable
foreign debt profile. Both mining output and construction spending will increase.
Exporters can expect good demand from Latin America.
Asia/Pacific: The regional growth is expected to average about 6% this year, with
most countries slowing from last year’s pace. Low interest rates should prolong
recoveries in consumer spending and business investment, while competitive
exchange rates are likely to boost exports. Fast growth in the region, which has taxed
infrastructure capacity and should prompt Governments to increase infrastructure
spending. Reconstruction in areas hit by the tsunami will require additional machines.
In China, Government administrative measures are expected to continue, causing
sales into that country to decline.
The sharp increases in commodity prices over the past few years in the context of the
growing demand and the weaker US dollar, has led to a revival of the global mining
industry, which has outperformed the rest of the market since 2003. This is also
reflected in investor confidence in mining companies as illustrated by the Dow Jones
Industrial Indices over the past three years.
This is a complete reversal of the “sunset” industry status which had been the trend
over the last two decades.