Báo cáo khoa học: "Applications of Automatic Evaluation Methods to Measuring a Capability of Speech Translation System" pot
Bạn đang xem bản rút gọn của tài liệu. Xem và tải ngay bản đầy đủ của tài liệu tại đây (1015.79 KB, 8 trang )
Applications of Automatic Evaluation Methods to Measuring a Capability
of Speech Translation System
Keiji Yasuda
ATR Spoken Language Translation Research Laboratories
2-2-2, Hikaridai,"Keihanna Science City", Kyoto, 619-0288, Japan
keiji . yasuda@atr . co . jp
Also at Graduate School of Engineering, Doshisha University
Fumiaki Sugaya
KDDI
R&D Laboratorie
2-1-15, Ohara, Kamifukuoka-city,
Saitama, 356-8502, Japan
Toshiyuki Takezawa
ATR Spoken Language
Translation Research Laboratories
2
-
2
-
2,
Hikaridai, "Keihanna Science City",
Kyoto, 619-0288, Japan
Seiichi Yamamoto
Masuzo Yanagida
ATR Spoken Language
Doshisha University
Translation Research Laboratories
1
-
3,
Tatara-miyakodani, Kyotanabe,
2-2-2, Hikaridai, "Keihanna Science City",
Kyoto, 610-0394, Japan
Kyoto, 619
-
0288, Japan
Abstract
The main goal of this paper is to pro-
pose automatic schemes for the trans-
lation paired comparison method. This
method was proposed to precisely eval-
uate a speech translation system's capa-
bility. Furthermore, the method gives an
objective evaluation result, i.e., a score
of the Test of English for International
Communication (TOEIC). The TOEIC
score is used as a measure of one's
speech translation capability. However,
this method requires tremendous eval-
uation costs. Accordingly, automatiza-
tion of this method is an important sub-
ject for study. In the proposed method,
currently available automatic evaluation
methods are applied to automate the
translation paired comparison method.
In the experiments, several automatic
evaluation methods (BLEU, NIST, DP-
based method) are applied. The exper-
imental results of these automatic mea-
sures show a good correlation with eval-
uation results of the translation paired
comparison method.
1 Introduction
ATR Interpreting Telecommunications Research
Laboratories (ATR-ITL) developed the ATR-
MATRIX (ATR's Multilingual Automatic Trans-
lation System for Information Exchange) speech
translation system (Takezawa et al., 1998),
which translates both ways between English and
Japanese.
ATR
-
ITL
has also been carrying out
comprehensive evaluations of this system through
dialog tests and analyses and has shown the effec-
tiveness of the system for basic travel conversa-
tion (Sugaya et al., 1999).
These experiences, however, indicated that it
would be difficult to enlarge the evaluation target
domain/task by simply adopting the dialog tests
which is employed in the same way for ATR-
MATRIX. Additional measures would be neces-
371
,pane,
Text
Thm.latIon
Ee,ult by
Human
EvaMM.
Sheet
Paired
Compm.is
M
A almk Text
Japanese Recogmbm
,k1p1m,
Japan, e
-
to
.
English
Lanpunt 'Laudation
(J-E IDMI)
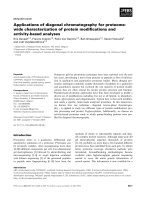
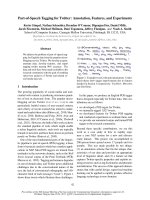
Figure 1: Diagram of translation paired compari-
son method
sary in the design of an expanded system in order
to meet performance expectations.
Sugaya et al. (2000) proposed the translation
paired comparison method, which is applicable to
precise evaluation of speech translation systems
with a limited task/domain capability. A major
disadvantage of the translation paired comparison
method is its subjective approach to evaluation.
Such an approach requires large costs and a long
evaluation time. Therefore, automatization of this
method remains an important issue to solve.
Several automatic evaluation methods have
been proposed to achieve efficient development of
MT technology, (Su et al., 1992; Papineni et al.,
2002; NIST, 2002). Both subjective and automatic
evaluation methods are useful for making compar-
isons among different schemes or systems. How-
ever, these techniques are unable to objectively
measure the performance of practical target appli-
cation systems.
In this paper, we propose an automatization
scheme for the translation paired comparison
method that employs available automatic evalua-
tion methods.
Section 2 explains the translation paired com-
parison method, and Section 3 introduces the pro-
posed evaluation scheme. Section 4 describes sev-
eral automatic evaluation methods applied to the
proposed method. Section 5 presents the evalu-
ation results obtained by the proposed methods.
Section 6 presents our conclusions.
2 Translation Paired Comparison
Method
The translation paired comparison method can
precisely measure the capability of a speech trans-
lation system. A brief description of the method is
given in this section.
Figure 1 shows a diagram of the translation
paired comparison method in the case of Japanese
to English translation. The Japanese native-
speaking examinees are asked to listen to spo-
ken Japanese text and then write its English trans-
lation on paper. The Japanese text is presented
twice within one minute, with a pause between
the presentations. To measure the English capa-
bility of the Japanese native speakers, the TOEIC
score (TOEIC, 2002) is used. The examinees are
asked to present an official TOEIC score certifi-
cate confirming that they have officially taken the
test within the past six months.
In the translation paired comparison method,
the translations by the examinees and the outputs
of the system are printed in rows together with the
original Japanese text to form evaluation sheets
for comparison by an evaluator, who is a bilingual
speaker of English and Japanese. Each transcribed
utterance on the evaluation sheets is represented
by the Japanese test text and the two translation
results (i.e., translations by an examinee and by
the system).
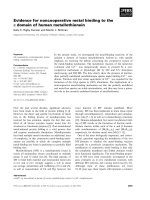
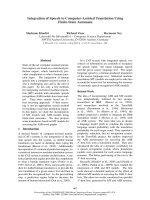
The evaluator is asked to follow the procedure
depicted in Figure 2. The meanings of ranks in
the figure are as follows: (A) Perfect: no problem
in both information and grammar; (B) Fair: easy-
to-understand with some unimportant information
missing or flawed grammar; (C) Acceptable: bro-
ken but understandable with effort; (D) Nonsense:
important information has been translated incor-
rectly.
In the evaluation process, the human evaluator
ignores misspellings because the capability to be
measured is not English writing but speech trans-
lation.
From the scores based on these rankings, either
the examinee or the system is considered the "win-
ner" for each utterance. If the ranking and the nat-
uralness are the same for an utterance, the compe-
tition is considered "even".
To prepare the regression analysis, the num-
ber of "even" utterances are divided in half and
equally assigned as system-won utterances and
human-won utterances. Accordingly, we define
the human winning rate (/1
7
H) by the following
equation:
WH
—
(Nhuman —
0.5 x
Nevem) I Ntotal
(1)
372
Choose A, B, C, or D rank
Consider naturalness
No
No
Calculate W
H
No
Yes
Set an examinee to be
compared to a system
n
= 0. PI
em
,= 0,
0
rr
Set a test utterance
to be evaluated
-Art,tz++
using automatic
evaluation
Regression Analysis
Figure 2: Procedure of comparison by a bilingual
speaker
where
N
totai
denotes the total number of utter-
ances in the test set, Nh„ represents the num-
ber of human-won utterances, and
N
even
indicates
the number of even (non-winner) utterances, i.e.,
no quality difference between the results of the
TDMT and humans. Details of the regression
analysis are given in Section 5.
3 Proposed Method
The first point to explain is how to automatize the
translation paired comparison method. The basic
idea of the proposed method is to substitute the
human evaluation process of the translation paired
comparison method with an automatic evaluation
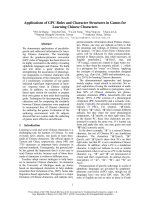
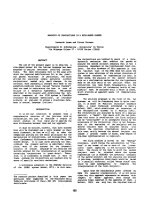
Figure 3: Procedure of Utterance Unit Evaluation
method'. There are two kinds of units to apply an
automatic evaluation method to the automatization
of the translation paired comparison method. One
is an utterance unit, and the other is a test set unit.
The unit of utterance corresponds to the unit of
segment in BLEU and NIST. Similarly, the unit of
the test set corresponds to the unit of document or
system in BLEU and NIST.
3.1 Utterance Unit Evaluation
The utterance unit evaluation takes roughly the
same procedure as the translation paired compari-
son method. Figure 3 shows the points of differ-
ence between the translation paired comparison
method and the utterance unit evaluation of the
proposed method. The complete flow can be ob-
tained by substituting Figure 3 for the broken line
area of Figure 2. In the regression analysis of the
utterance unit evaluation, the same procedure as
the original translation paired comparison method
is carried out.
3.2 Test Set Unit Evaluation
In a sense, the test set unit evaluation follows a dif-
ferent procedure from the translation paired com-
parison method and the utterance unit evaluation.
The flow of the test set unit evaluation is shown
in Figure 4. In the regression analysis of the test
set unit evaluation, the evaluation result by an au-
tomatic evaluation method is used instead of
IVH.
' An automatic evaluation method for the proposed
method does not have to be a certain kind. However, needless
to add, a precise automatic evaluation method is ideal. The
automatic evaluation methods that we applied to the proposed
method are explained in Section 4.
373
)141k
Set a target
ystem or examinee)
to be scored
Apply test. set level
evaluation to the target
Have all
examinees and systems
been evaluated?
Yes
No
Regressi,s,n Analysis
E
N
{
n=1
Eall
in sys output
f o(u71 v),
2
)
E
all
w1 zon
in sys output
(1)
4.2 N-gram Based Method
Papineni et al. (2002) proposed BLEU, which is
an automatic method for evaluating MT quality
using N-gram matching. The National Institute
of Standards and Technology also proposed an
automatic evaluation method called NIST (2002),
which is a modified method of BLEU. Equation 3
is the BLEU score formulation, and Equation 4 is
the NIST score formulation.
SBLEU
—
exp
E
w„ log(p) — max (
re
j
1, 0) }
L*
L
N
sys
n=1
Figure 4: Procedure of Test Set Unit Evaluation
(3)
4 Automatic Evaluation Method
In this section, we briefly describe the automatic
evaluation methods that are applied to the pro-
posed method. Basically, these methods are based
on the same idea, that is, to compare the target
translation for evaluation to high-quality human
reference translations. These methods, then, re-
quire a corpus of high-quality human reference
translations.
4.1 DP-based Method
The DP score between a translation output and ref-
erences can be calculated by DP matching (Su et
al., 1992; Takezawa et al., 1999) as follows:
=1 to all references 1
.
max
f — — —
D
i
(2)
where
SDP
is the DP score,
T
i
is the total num-
ber of words in reference
i,
Si is the number of
substitution words for comparing reference i to
the translation output, /i is the number of inserted
words for comparing reference i to the translation
output, and Di is the number of deleted words
for comparing reference i to the translation out-
put. For the test set unit evaluation using the DP
score, we employ the utterance-weighted average
of utterance-level scores.
where
Pit =
counteiip
(n— grain)
ECE
{
Candidates
}
C ounten — gram)
EcE{Candidates}
En—gramE{C}
wn = N
-1
and
L*
f
=
the number of words in the reference
re
translation that is closest in length to the
translation being scored
L
525
= the number of words in the translation
being scored
SNI ST —
x exp {,3 log
2
[min
L„
f
'
(Ls
-
1)1}
(4)
where
in/0(w'
w„) =
log2
the number of occurence
of wi wn—i)
the number of occurence of
wi w
n
-"ref =
the average number of words in a refer-
ence translation, averaged over all reference
translations
L
8y8
= the number of words in the translation
being scored
SDP —
374
800 900
0.7
0.6
0.5
0.4
0.3
0.2
0.1
300
400
500
600
700
TOE1C
score
and 13 is chosen to make the brevity penalty fac-
tor=0.5 when the number of words in the system
translation is 2/3 of the average number of words
in the reference translation. For Equations 3 and 4,
N
indicates the maximum n-gram length.
5 Evaluation Experiments
In this section, we show experimental results of
the original translation paired comparison method
and the proposed method.
5.1 Experimental Conditions
The target system to be evaluated is Transfer
Driven Machine Translation (TDMT) (Takezawa
et al., 1998). TDMT is a language translation sub-
system of the Japanese-to-English speech trans-
lation system ATR-MATRIX. For evaluation of
TDMT, the input included accurate transcriptions.
The total number of examinees is 29, and the
range of their TOEIC score is between the 300s
and 800s. Excepting the 600s, every hundred-
point range has 5 examinees.
The test set consists of 330 utterances in 23 con-
versations from the ATR bilingual travel conver-
sation database (Takezawa, 1999). Consequently,
this test set has different features from written lan-
guage. Most of the utterances in our task contain
fewer words than the unit of segment used so far
in research with BLEU and NIST. One utterance
contains 11.9 words on average. The standard de-
viation of the number of words is 6.5. The shortest
utterance consists of 1 word, and the longest con-
sists of 32 words. This test set was not used to
train the TDMT system.
For the translations of examinees, all mis-
spellings were corrected by humans because, as
mentioned in Section 2, the human evaluator
ignores misspellings in the original translation
paired comparison method.
5.2 Evaluation Results by Translation Paired
Comparison Method
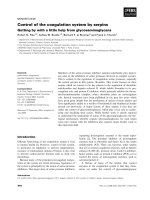
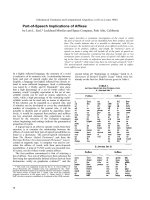
Figure 5 shows the results of a comparison be-
tween TDMT and the examinees. Here, the ab-
scissa represents the TOEIC score, and the ordi-
nate represents WH. In this figure, the straight
line indicates the regression line. The capability-
balanced point between the TDMT subsystem and
Figure 5: Evaluation results using translation
paired comparison method
Human Evaluation
System wen
Firnan won
Even
BLEU
System won
2937
901
1324
.
(Max n
-
gam length =
2,
Human won
726
1768
842
1
Number of ref = 16)
Even
239
64
769
NIST
tu
0
(Max n-gem length
=
5,
System won
3158
1255
1629
Human won
730
1477
870
Nurr8er of ref = 16)
,
ti
l
l
Even
14
1
436
t,.
.,
System won
2592
676
1072
Human won
1012
1929
1057
7
DP
r:t
(Number of ref = 16)
Even
298
128
EC6
Table 1: Detailed results of utterance unit evalua-
tion
the examinees was determined to be the point at
which the regression line crossed half the total
number of test utterances, i.e.,
WH
of 0.5. In Fig-
ure 5, this point is 705. Consequently, the transla-
tion capability of the language translation system
equals that of an examinee with a score of around
700 points on the TOEIC. We call this point the
system's TOEIC score.
5.3 Evaluation Results of Utterance Unit
Evaluation
In their original forms, the maximum n-gram
length for BLEU
(N
in Equation 3) is set at 4 and
that for NIST
(N
in Equation 4) is set at 5. These
settings were established for evaluation of written
language. However, utterances in our test set con-
tain fewer words than in typical written language.
Consequently, for the utterance unit evaluation, we
conducted several experiments while varying
N
from 1 to 4 for BLEU and from 1 to 5 for NIST.
Table 1 shows the detailed results of the paired
comparison using automatic evaluations. Figure 6
shows experimental results of the utterance unit
375
CO
7
-9
CO
[ 0
CO
11
-
11 11•IMMMMIMMI
-
1
II II II IMM
1
II II II MIMI II 1 I
1
1
1
1
1
1
1
1
1
I
I
I
I
I
I
I
II
I
I
I
I
I
1
I
1
1
1
II
II
II
II
II
1
II
1
1
1
II
II
II
II
II
1
II
1
1
I
41■1■1■1
7
CO
Z
Z
Z
CO
CO
.
6 -
CO
V)
23
-
E
-
E
-
E
-
E
-
!7.5
35f
Ui
CO
v,
CO
CO
CO
CO
CO
Z
Z
Z
Z
0.58
056
0.54
0.52
(I
0.5
0.48
0.46
0.44
0 0.42
0.4
0.38
0.58
0.56
0.54
0.52
0.5
.t 0.48
7,
0 4446
0
0.42
0.4
0.38
0
Figure 6: Correct ratio of utterance unit evaluation
(Number of references = 1)
Figure 7: Correct ratio of utterance unit evaluation
(Number of references = 16)
evaluation. In this figure, the abscissa represents
the automatic evaluation method used and the n-
gram length, and the ordinate represents the cor-
rect ratio (R
eo
„,
t
) calculated by the following
equation:
Reorrect — Ucorrect
I
Utotul
(5)
where U
tota
i is the total number of translation pairs
consisting of the examinees' translation and the
system's translation (330 utterances x 29 exam-
inees = 9570 pairs) and U
e0
„
ect
is the number
of pairs where the automatic evaluation gives the
same evaluation result as that of the human eval-
uator. The difference between Figures 6 and 7 is
the number of references to be used for automatic
evaluation. In Figure 6, there is 1 reference per ut-
terance, while in Figure 7 there are 16 references
per utterance. In these figures, values in paren-
theses under the abscissa indicate the maximum
n-gram length.
Looking at these figures, the correct ratio of
BLEU changes value depending on the maximum
n-gram length. The maximum n-gram length of
1 or 2 yields a high correct ratio, and that of 3 or
4 yields a low correct ratio. On the other hand,
the correct ratio of NIST is not influenced by the
maximum n-gram length. It seems reasonable to
suppose that these phenomena are due to compu-
tation of the mean of n-gram matching. As shown
in Equations 3 and 4, BLEU applies a geometric
mean and NIST applies an information-weighted
arithmetic mean. Computation of the geometric
mean yields 0 when one of the factors is 0, i.e.,
the BLEU score takes 0 for all of the utterances
whose word count is less than the maximum n-
gram length.
The correct ratio shown in Figures 6 and 7 is
low, i.e., around 0.5. Thus, even state-of-the-
art technology is insufficient to determine better
translation in the utterance unit evaluation. For
a sufficient result of the utterance unit evalua-
tion, we need a more precise automatic evaluation
method or another scheme, for example, major-
ity decision using multiple automatic evaluation
methods.
5.4 Evaluation Results of Test Set Unit
Evaluation
CO
In the original BLEU or NIST formulation of the
test set unit (or document or system level) eval-
uation, n-gram matches are computed at the ut-
terance level, but the mean of n-gram matches is
computed at the test-set level. However, consid-
ering the characteristics of the translation paired
comparison method, the average of the utterance-
level scores might be more suitable. Therefore,
we carried out experiments using both the origi-
nal formulation and the average of utterance-level
scores. For the average of utterance-level scores,
considering the experimental results shown in Fig-
ure 7, we used the maximum n-gram length of 2
for BLEU and 5 for NIST.
Figure 8 shows the correlation between auto-
matic measures and
WH.
In this figure, the ab-
scissa represents the number of references used for
automatic evaluation, and the ordinate represents
376
2
4
8
16
Number of references
Figure 8: Correlation between automatic measures
and
WH
-
n I
CI BLEU
Original)
BLEU 2-gram, utterance mean
• NIST (Original)
NIST (5
-
gram, utterance mean)
la DP
IIIIIMIII
2
4
8
16
Number of references
Figure 9: Correlation between automatic measures
and TOEIC score
correlation. On the other hand, Figure 9 shows
the correlation between automatic measures and
TOEIC score. In this figure, the abscissa and the
ordinate represent the variable as Figure 8.
Figure 10 shows the system's TOEIC score us-
ing the proposed method. Here, the number of
references is 16. In this figure, the ordinate rep-
resents the system's TOEIC score, and the broken
line represents the system's TOEIC score using the
original translation paired comparison method.
In Figures 8, 9 and 10, white bars indicate the
results using the original BLEU score, black bars
indicate the results using the original NIST score,
and gray bars indicate the results using the DP-
based method. The bars with lines indicate the re-
sults using the original BLEU or NIST score, and
those without lines indicate the results using the
average of utterance-level scores.
When we choose an automatic evaluation
=BLEU (Original)
IIBLEU(2
-
grarn. utterance mean)
IMNIST (Original)
IMINIST (5
-
gram, utterance mean)
pIDP
Figure 10: System's TOEIC score by proposed
method
method to apply to the proposed method, there
are two points that needs to be considered. One
is the ability to precisely evaluate human transla-
tions. This ability can be evaluated by the results
in Figures 8 and 9, and it affects confidence inter-
val
2
of the system 's TOEIC score. The other point
to consider is the evaluation bias from the human's
translation to the system's translation. This affects
system's actual TOEIC score, which is shown in
Figure 10.
Looking at Figures 8 and 9, all of the auto-
matic measures correlate highly with both
WH
and TOEIC score. In particular, the averaged
utterance-level BLEU score shows the highest cor-
relation. However, looking at Figure 10, the sys-
tem's TOEIC score using this measure deviates
from that of the original translation paired com-
parison method.
From the viewpoint of the system's TOEIC
score, the DP-based method gives the best result
at 708 points, while the original translation paired
comparison method yielded a score of 705. The
original BLEU also gives a good result at a system
TOEIC score of 712.
Considering the reductions in the evaluation
costs and time, this automatic scheme shows a
good performance and thus is very promising.
6 Conclusions
We proposed automatic schemes for the transla-
tion paired comparison method. In the experi-
2
The formula of the confidence interval is mentioned
in the original paper of the translation paired comparison
method (Sugaya et al., 2000).
0.9
z 0.8
0.7
0.6
0
0
900
850
Boo
(
L
17,
)
750
0
700
650
600
377
ments, we applied currently available automatic
evaluation methods: BLEU, NIST and a DP-based
method. The target system evaluated was TDMT.
We carried out two experiments: an utterance unit
evaluation and a test set unit evaluation. Accord-
ing to the evaluation results, the utterance unit
evaluation was insufficient to automatize the trans-
lation paired comparison method.
However, the test set unit evaluation using the
DP-based method and the original BLEU gave
good evaluation results. The system's TOEIC
score using the DP-based method was 708 and that
using BLEU was 712, while the original trans-
lation paired comparison method gave a score
around of 705.
To confirm the general effectiveness of the
proposed method, we are conducting experiments
on another system as well as the opposite transla-
tion direction, i.e., English to Japanese translation.
Acknowledgements
The research reported here was supported
in part by a contract with the Telecom-
munications Advancement Organization of
Japan entitled, "A study of speech dialogue
translation technology based on a large
corpus". It was also supported in part by
the Academic Frontier Project promoted by
Doshisha University.
References
NIST.
2002. Automatic Evaluation
of Machine Translation Quality Us-
ing N-gram Co-Occurence Statistics.
http: //www.nist goy/speech/
tests/mt/mt2001/resource/.
K. Papineni, S. Roukos, T. Ward, and W J.
Zhu. 2002. Bleu: a method for automatic
evaluation of machine translation. In
Pro-
ceedings of the 40th Annual Meeting of the
Association for Computational Linguistics
(ACL),
pages 311-318.
K Y. Su, M W. Wu, and J S. Chang. 1992.
A new quantitative quality measure for ma-
chine translation systems. In
Proceed-
ings of the 14th International Conference
on Computational Linguistics(COLING),
pages 433-439.
F. Sugaya, T. Takezawa, A. Yokoo, and S. Ya-
mamoto. 1999. End-to-end evaluation in
ATR-MATRIX: speech translation system
between English and Japanese. In
Proceed-
ings of Eurospeech,
pages 2431-2434.
F. Sugaya, T. Takezawa, A. Yokoo, Y. Sag-
isaka, and S. Yamamoto. 2000. Evalua-
tion of the atr-matrix speech translation
sys-
tem
with a paired comparison method be-
tween the system and humans. In
Proceed-
ings of International Conference on Spo-
ken Language Processing (ICSLP),
pages
1105-1108.
T. Takezawa, T. Morimoto, Y. Sagisaka,
N. Campbell,
H. Iida,
F. Sugaya, A. Yokoo,
and S. Yamamoto. 1998. A Japanese-to-
English speech translation system: ATR-
MATRIX. In
Proceedings of International
Conference on Spoken Language Process-
ing (ICSLP),
pages 2779-2782.
T. Takezawa, F. Sugaya, A. Yokoo, and S. Ya-
mamoto. 1999. A new evaluation method
for speech translation systems and a case
study on ATR-MATRIX from Japanese to
English. In
Proceeding of Machine Trans-
lation Summit (MT Summit),
pages 299—
307.
T. Takezawa. 1999. Building a bilin-
gual travel conversation database for speech
translation research. In
Proceedings of the
2nd International Workshop on East-Asian
Language Resources and Evaluation — Ori-
ental COCOSDA Workshop '99 —,
pages
17-20.
TOEIC. 2002. Test of English
for
International
Communication.
http: //www.toeic . com/.
378