Báo cáo khoa học: "Linear Text Segmentation using a Dynamic Programming Algorithm" potx
Bạn đang xem bản rút gọn của tài liệu. Xem và tải ngay bản đầy đủ của tài liệu tại đây (470.51 KB, 8 trang )
Linear Text Segmentation using a Dynamic Programming Algorithm
Athanasios Kehagias
Dept. of Math., Phys.
and Comp. Sciences
Aristotle Univ of Thessaloniki
GREECE
Fragkou Pavlina , Vassilios Petridis
Dept. of Elect. and Computer Eng.
Aristotle Univ of Thessaloniki
GREECE
,
Abstract
In this paper we introduce a dynamic
programming algorithm to perform lin-
ear text segmentation by global mini-
mization of a segmentation cost function
which consists of: (a) within-segment
word similarity and (b) prior informa-
tion about segment length. The eval-
uation of the segmentation accuracy of
the algorithm on Choi's text collection
showed that the algorithm achieves the
best segmentation accuracy so far re-
ported in the literature.
Keywords: Text Segmentation, Docu-
ment Retrieval, Information Retrieval,
Machine Learning.
1 Introduction
Text segmentation
is an important problem in in-
formation retrieval. Its goal is the division of a
text into homogeneous ("lexically coherent")
seg-
ments, i.e segments exhibiting the following prop-
erties: (a) each segment deals with a particular
subject and (b) contiguous segments deal with dif-
ferent subjects. Those segments can be retrieved
from a large database of unformatted (or loosely
formatted) text as being relevant to a query.
This paper presents a dynamic programming al-
gorithm which performs
linear
segmentation
1
by
global minimization of a
segmentation cost.
The
segmentation cost
is defined by a function consist-
ing of two factors: (a)
within-segment word sim-
ilarity and (b)
prior information about segment
length.
Our algorithm has the advantage of be-
ing able to be applied to either large texts - to seg-
ment them into their constituent parts (e.g. to seg-
ment an article into sections) - or to a stream of
independent, concatenated texts (e.g. to segment a
transcript of news into separate stories).
For the calculation of the segment
homogeneity
(or alternatively
heterogeneity)
of a text, several
segmentation algorithms using a variety of crite-
ria have been proposed in the literature. Some of
those use linguistic criteria such as cue phrases,
punctuation marks, prosodic features, reference,
syntax and lexical attraction (Beeferman et al.,
1997; Hirschberg and Litman, 1993; Passoneau
and Litman, 1993). Others, following Halliday
and Hasan's theory (Halliday and Hasan, 1976),
utilize statistical similarity measures such as word
cooccurrence. For example the linear discourse
segmentation algorithm proposed by Morris and
Hirst (Morris and Hirst, 1991) is based on
lexi-
cal cohesion relations
determined by use of Ro-
get's thesaurus (Roget, 1977). In the same direc-
tion Kozima's algorithm (Kozima, 1993; Kozima
and Furugori, 1993) computes the semantic sim-
ilarity between words using a semantic network
constructed from a subset of the Longman Dictio-
nary of Contemporary English. Local minima of
the similarity scores correspond to the positions of
topic boundaries in the text.
Youmans
(Youmans, 1991) and later
l
As opposed to
hierarchical
segmentation (Yaari, 1997)
Hearst (Hearst and Plaunt, 1993; Hearst, 1994)
171
focused on the similarity between
adjacent
part
of texts. They used a sliding window of text
and plotted the number of first-used words in the
window as a function of the window position
within the text. In this plot, segment boundaries
correspond to deep valleys followed by sharp
upturns. Kan (Kan et al., 1998) expanded the
same idea by combining word-usage with visual
layout information.
On the other hand, other researchers focused on
the similarity between
all
parts of a text. A graph-
ical representation of this similarity is a
dotplot.
Reynar (Reynar, 1998; Reynar, 1999) and Choi
(Choi, 2000; Choi et al., 2001) used dotplots in
conjunction with divisive clustering (which can be
seen as a form of
approximate
and
local
optimiza-
tion) to perform
linear
text segmentation. A rel-
evant work has been proposed by Yaari (Yaari,
1997) who used
divisive / agglomerative cluster-
ing
to perform
hierarchical segmentation. An-
other approach to clustering performs exact
and
global
optimization by dynamic programming;
this was used by Ponte and Croft (Ponte and Croft,
1997; Xu and Croft, 1996), Heinonen (Heinonen,
1998) and Utiyama and Isahara (Utiyama and Isa-
hara, 2001).
Finally, other researchers use probabilistic ap-
proaches to text segmentation including the use
of
hidden Markov models
(Yamron et al.,
1999), (Blei and Moreno, 2001). Also Beeferman
(Beeferman et al., 1997) calculated the probabil-
ity distribution on segment boundaries by utilizing
word usage statistics, cue words and several other
features.
2 The algorithm
2.1
Representation
Suppose that a text contains
T
sentences and its
vocabulary contains
L
distinct words (e.g words
that are not included in the stop list, other wise
most sentences would be similar to most others).
This text can be represented by aTxL matrix
F
defined as follows: for
t =
1, 2. ,
T
and
1 =
1, 2, ,
L
we set
{ 1 iff 1-th word is in t-th sentence
F1
=
0 else.
The
sentence similarity matrix
of the text is a
T
x
T
matrix
D
where for
s,
t
= 1, 2, ,
T
we set
D5.
1 if Ei
L
F
s
,iF
t
,/
> 0;
t
=
if
=
0.
This means that
D
8
,
1
=
1 if the s-th and t-th sen-
tence have at least one word in common Ev-
ery part of the original text corresponds to a sub-
matrix of
D.
It is expected that submatrices which
correspond to actual segments will have many sen-
tences with words in common, thus will contain
many "ones". Further justification for the use of
this similarity matrix and graphical representation
can be found in (Petridis et al., 2001), (Reynar,
1998; Reynar, 1999) and (Choi, 2000; Choi et al.,
2001)
We make the assumption that segment bound-
aries always occur at the ends of sentences. A
segmentation of a text is a partition of the set
{1, 2, , T} into
K
subsets (i.e.
segments,
where
K
is a variable number) of the form {1, 2, , 4},
{t
i
± 1,14 ± 2, , t
2
}, {tK_i ± 1,
tK_LL
2, , T} and can be represented by a vector
t
=
(t
o
, t
i
,
tK),
where t
o
, t
i
,
ti;
are the
seg-
ment boundaries
corresponding to the last
sen-
tence of each subset.
2.2 Dynamic Programming
Dynamic programming guarantees the optimality
of the result with respect to the input and the pa-
rameters. Following the approach of (Heinonen,
1998) we use a dynamic programming algorithm
which decides the locations of the segment bound-
aries by calculating the globally optimal splitting
t
on the basis of a similarity matrix (or a curve), a
preferred fragment length and a cost function de-
fined. Given a similarity matrix
D
and the param-
eters
it, a
,
r, 7 (the role of each of which will be
described in the sequel) the dynamic programming
algorithm tries to minimize a
segmentation cost
function J(t ; a
,
r, -y ) with respect to
t
(here
t
is
the independent variable which is actually a vector
specifying the boundary position of each segment
and the number of segments
K
while
,u a, r,
7
are
parameters) which is defined as follows:
j(t
r,
7
)
Ek
K
.
[
7
(tk-t2k 0_12_-P)2]
172
]
E
tk
=tk_i+i
tk
=tk_i+i
D
s
St
.
(1)
(tk
-
tk-i)
Hence the sum of the costs of the
K
segments
constitutes the total segmentation cost; the cost
of each segment is the sum of the following two
terms (with their relative importance weighted by
the parameter 7):
I. The term
(tk tk-
?
- /1)2
2.0-2
corresponds to the
length information measured as the deviation from
the average segment length. In this sense, bt and
a
can be considered as the mean and standard devia-
tion of segment length measured either on the ba-
sis of words or on the basis of sentences appearing
in the document's segments and can be estimated
from
training data.
E:
k
=t
k
i+iEt
t
=
k
ek 1+1D
8,t
2. The term
(tk -tk-
corresponds
to (word) similarity between sentences. The nu-
merator of this term is the total number of ones
in the
D
submatrix corresponding to the k-th
segment. In the case where the parameter r is
equal to 2,
(tk
—
tk_
O
r
correspond to the area
of submatrix and the above fraction corresponds
to "segment density". A "generalized density"
is obtained when
r
2 and enables us to con-
trol the degree of influence of the surface with
regard to the "information" (i.e the number of
ones) included in it. Strong intra-segment sim-
ilarity (as measured by the number of words
which are common between sentences belonging
to the segment) is indicated by large values of
E
t
,
k
-(
k
1+1 E
t
(
k-
tk 1+
1
D
'
t
(tk
-
tk-i)
act value of r.
Segments with high density and small deviation
from average segment length (i.e a small value
of the corresponding ,/(t; by
a,
r,
7 )
2
)
provide a
"good" segmentation vector
t.
The
global
mini-
mum of
J(t;
f
a,
r, ) provides the
optimal
seg-
mentation
t.
It is worth mentioning that the op-
timal t specifies both the optimal number of seg-
ments
K
and the optimal positions of the segment
boundaries
t
o
,
ti, tA
-
.
In the sequel, our algo-
rithm is presented in a form of pseudocode.
Dynamic Programming Algorithm
=
Small in the algebraic
sense: J(t;
14a,r,ry)
can take
both positive and negative values.
Input: The
T x T
similarity matrix
D;
the pa-
rameters
[1, a, r,
Initilization
For
t
1, 2,
T
Sum =
0
For
s
= 1, 2,
t
— 1
Stan =
Stan+ D s,t
End
ss,t
_
(t
Su
:s
rr
)
t
,
End
Minimization
Co = 0, Zo =
0
For
t
= 1, 2„
T
Ct = Do
For
s
= 1, 2,
t
— 1
If C
s
+
Ss,t+
C
t
= C
s
Zt
=
s
EndIf
End
End
BackTracking
K =
0,
s
k
=
T
While
Z
s
,
> 0
k = k + 1
sk =
End
K K +1,
Zk 0.10 =
0
For
k =
1, 2,
K
SK-k
End
_Output:
The optimal segmentation vector t =
(to,
•••, tA
-
)•
3
Evaluation
3.1 Measures of Segmentation Accuracy
The performance of our algorithm was evaluated
by three indices:
precision, recall
and Beeferman's
Pk
metric.
Precision and recall measure segmentation
ac-
curacy.
For the segmentation task,
Precision
is
defined as "the number of the estimated segment
boundaries which are actual segment boundaries"
divided by "the number of the estimated segment
boundaries". On the other hand, Recall
is defined
, irrespective of the ex-
2a2
++
(t-s-p)2
2o
-2
173
as "the number of the estimated segment bound-
aries which are actual segment boundaries" di-
vided by "the number of the true segment bound-
aries". High segmentation accuracy is indicated
by high values of
both
precision and recall. How-
ever, those two indices have some shortcomings
First, high precision can be obtained at the expense
of low recall and conversely. Additionally, those
two indices penalize equally every inaccurately es-
timated segment boundary whether it is near or far
from a true segment boundary.
An alternative measure
Pk
which overcomes the
shortcomings of precision and recall and measures
segmentation inaccuracy was introduced recently
by Beeferman et al (Beeferman et al., 1997). Intu-
itively,
Pk
measures the proportion of "sentences
which are wrongly predicted to belong to the same
segment (while actually they belong in different
segments)" or "sentences which are wrongly pre-
dicted to belong to different segments (while ac-
tually they belong to the same segment)".
Pk
is
a measure of how well the true and hypothetical
segmentations agree (with a low value of P, in-
dicating high accuracy (Beeferman et al., 1997)).
Pk
penalizes near-boundary errors less than far-
boundary errors. Hence
Pk
evaluates segmenta-
tion accuracy more accurately than precision and
recall.
3.2 Experiments
Our experiments were conducted using Choi's
publicly available text collection (Choi, 2000;
Choi et al., 2001). This collection consists of 700
texts, each text being a concatenation of ten text
segments. Each segment consists of "the first
n
sentences of a randomly selected document from
the
Brown Corpus
(Francis and Kucera, 1982).
(News articles ca**.pos and the informative text
cj**.pos)"
3
. The 700 texts can be divided into four
datasets Set0, Set 1 , Set2, Set3, according to the
range of n (the number of sentences in a docu-
ment) as listed in Table 1.
The sample texts were preprocessed i.e. punctu-
ation marks and stop words were removed, while
the remaining words were stemmed according to
Porter's stemming algorithm (Porter, 1980).
3
1t follows that segment boundaries will always appear at
the end of sentences.
Sett)
Set 1
Set2 Set3
Range of n
3-11
3-5 6-8
9-11
no. of texts 400
100
100
100
Table 1
Range of
n
(number of sentences) and number of documents
for the datasets Set0, Set!, Set2, Set3 (Choi's text
collection).
We next present two groups of experiments each
of which contains two suites of experiments. The
difference between the two suites lies in the selec-
tion of the parameter values. Our segmentation al-
gorithm uses four parameters:
/ y
a,
7 and r, where
p,
and
a
can be interpreted as the average and stan-
dard deviation of segment length; it is not immedi-
ately obvious how to calculate these. One possibil-
ity is to calculate the average and standard devia-
tion of the segment length based on the number of
sentences
appearing in the document's segments;
this is done in the first suite and for both groups of
experiments. The second is based on the number
of
words
apparearing in the document's segments;
this is done in the second suite and for both groups
of experiments.We want to examine this influence
on the length model as well as the influence of -y
and r in the segmentation accuracy (as measured
by B eeferman's
Pk)
.
In the first group of experiments and for both
suites, the following procedure is repeated for
Set0, Set 1 , Set2, Set3.
1.
Appropriate
p,
and
a
values are determined us-
ing all the texts of the dataset (using the standard
statistical estimates based either on the number of
sentences or on the number of words).
2.
Parameter -y is set to take the values 0.00, 0.01,
0.02, , 0.09, 0.1, 0.2, 0.3, , 1.0 and r to take
the values 0.33, 0.5, 0.66, 1. This yields 20 x 4=80
possible combinations of -y and r values.
3.Our segmentation algorithm is executed for each
(7, r) combination.
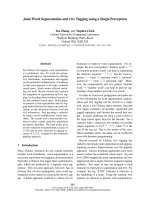
An idea of the influence of -y and r on
Pk
for
both suites of experiments of the first group can
be observed in Figures 1-4 (corresponding to Set0,
Set1, Set2, Set3). In those figures Exp 1
refers to
the first suite of experiments while
Exp
2 refers to
the second suite of experiments.
It can be seen from Figures 1-4 that the best
achieved values of
Pk
are the ones listed in Table
2 corresponding to the results of the first group,
174
where the first three rows correspond to the results
obtained by the first suite of experiments, and the
last three rows correspond to the results obtained
by the second suite of experiments. More pre-
cisely, the 1st and the 4th rows contain the values
of Precision, the 2nd and the 5th rows contain the
values of Recall, while the 3rd and the 6th rows
contain the values of
Pk.
Set0
Set]
Set2
Set3
All Sets
81.27%
89.54%
89.82%
94.22%
85.53%
84.20% 89.55%
90.00%
94.22%
87.24%
7.00%
4.75%
2.40%
1.00%
5.16%
81.47%
86.47%
83.03%
83.99%
82.77%
80.66%
82%
81.78%
85.22%
81.66%
8.43%
6.82%
5.97% 5.02%
7.36%
Table 2
Exp.Groupl: The best Precision, Recall and
Pk
values
for the datasets Set0, Set 1 , Set2, Set3 and the entire dataset
(Choi's text collection) obtained with optimal
7,
r
values for
both experiments of the first group (non validated).
However, only if the optimal values for
7,r
as
well as the values of /4
a
are known in advance,
we can obtain the results of Table 2. In a practi-
cal application none of these values will be a priori
available. A procedure for determining appropri-
ate values of
/4
a,-y,r
is necessary in order to pro-
vide a more realistic evaluation of our algorithm.
In the second group of experiments and for both
suites, for the determination of the appropriate
[I
a y,r
values, we first use
training data
and
a
parameter validation
procedure. Then our al-
gorithm is evaluated on (previously unseen)
test
data.
More specifically, for each of the datasets
Set0, Setl, Set2, Set3 we perform the procedure
described in the sequel:
1.
Half of the texts in the dataset are chosen ran-
domly to be used as training texts; the rest of the
samples are set aside to be used as test texts.
2.
Appropriate and
a
values are determined us-
ing all the training texts and the standard statistical
estimators.
3. Appropriate
7
and r values are determined
by running the segmentation algorithm on all the
training texts with the 80 possible combinations
of 7 and r values; the one that yields the mini-
mum
Pk
value is considered to be the optimal (7,
r) combination.
4. The algorithm is applied to the test texts using
previously estimated 7, r, p, and
a
values.
The above procedure is repeated five times
for each of the four datasets for both suites of ex-
periments and the resulting values of precision, re-
call and
Pk
are averaged. The results of those ex-
periments are listed in Table 3. Table 3 is exactly
the same with Table 2 but now contains the results
of the second group of experiments.
Set°
Sett
Set2
Set3
All Sets
82.66% 88.17%
88.68%
92.37%
85.70%
82.78% 87.70%
88.71%
92.44%
85.73%
7.00%
5.45%
3.00%
1.33%
5.39%
83.89%
84.69%
84.50%
88.30%
84.73%
81.41%
84.00%
83.37%
88.09%
83.02%
7.16%
7.54% 5.51%
3.08%
6.40%
Table 3
Exp.Group 2:The Precision, Recall and
Pk
values for the
datasets Set0, Setl, Set2, Set3 and the entire dataset (Choi's
text collection) obtained with optimal
7, r
values for both
experiments of the second group (validated).
Set()
Sett
Set2
Set3
All Sets
9.00%
10.00%
7.00%
5.00%
8.00%
14.00%
10.00%
11.00%
12.00% 13.00%
12.00%
10.00%
9.00%
8.00%
11.00%
12.00%
11.00%
10.00%
9.00%
11.00%
13.00%
18.00%
10.00% 10.00%
13.00%
23.00%
19.00%
21.00%
20.00%
22.00%
10.00%
9.00%
7.00% 5.00%
9.00%
11.00%
13.00%
6.00%
6.00%
10.00%
7.00%
5.45%
3.00%
1.33%
5.39%
7.16%
7.54%
5.51%
3.08%
6.40%
Table 4
Comparison of several algorithms with respect to the
Pk
values obtained for the datasets Set0, Set 1, Set2, Set3 from
both experiments and the entire dataset (Choi's text collec-
tion).
Table 4 provides all the results published so far
in the literature (Choi, 2000; Choi et al., 2001;
Utiyama and Isahara, 2001) regarding Choi's text
collection, where we list only the values of
since the ones of Precision and Recall are not
known. In Table 4, rows 4, 5 and 6 correspond
175
to C99, C99b and C99b,-r algorithms described
in (Choi, 2000). Rows 7 and 8 correspond to
U00 and U00b proposed in (Utiyama and Isa-
hara, 2001) while rows 1, 2 and 3 correspond to
CWM1, CWM2 and CWM3 proposed in (Choi et
al., 2001). Row 9 corresponds to the results ob-
tained by the first suite of experiments of our al-
gorithm while row 10 to the ones obtained by the
second suite of experiments, both rows for the sec-
ond group. In both cases, they are still better than
any previously reported on Choi's dataset, which
means that our algorithm performs considerably
better than all the remaining ones. It is worth
mentioning than, the best performance has been
achieved for -y in the range [0.08, 0.4] and for r
equal to either 0.5 or 0.66 for both suites of exper-
iments.
3.3 Discussion
From all the results obtained, we can conclude that
our segmentation algorithm on Choi's text collec-
tion achieves significantly better results than the
ones previously reported (Choi, 2000; Choi et al.,
2001; Utiyama and Isahara, 2001). The computa-
tional complexity of our algorithm is comparable
to that of the other methods (namely
0 (1
2
)
where
T
is the number of sentences)
4
.
Finally, our al-
gorithm has the advantage of automatically deter-
mining the optimal number of segments.
We believe that the good performance of our al-
gorithm is the result of the combination of the fol-
lowing facts: First, the use of a segment length
term in the cost function seems to improve seg-
mentation accuracy significantly, as it can be seen
in Figures 1-4. Second,
measuring segment length
on the basis of sentences rather on the basis of
words improves segmentation accuracy.
Third, the
use of "generalized density" (r 2) appears to
significantly improve performance. Even though
the use of "true density" (r = 2) appears more
natural, the best segmentation performance (min-
imum value of Pk)
is achieved for significantly
smaller values of r (as it can be see from the
4
Our algorithm was executed on a Pentium
III
600Mhz
computer with 256Mbyte RAM. For segmenting a single text,
our algorithm takes on average 0.91seconds, U00b (Utiyama
and Isahara, 2001) 1.37, U00 (Utiyama and Isahara, 2001)
1.36, C99b 1.45 (Choi, 2000), (Choi et al., 2001) and C99
(Choi, 2000; Choi et al., 2001) 1.49 seconds.
Figures 1-4 and the obtained results). This per-
formance in most cases is improved when using
appropriate values of and r derived from
training data and parameter validation.
Finally, it is worth mentioning that our approach
is "global" in two respects. First, sentence similar-
ity is computed globally through the use of the
D
matrix and dotplot. Second, this global similarity
information is also optimized globally by the use
of the dynamic programming algorithm. This is in
contrast with the local optimization of global in-
formation (used by Choi) and global optimization
of local information (used by Heinonen).
4 Conclusion
We have presented a dynamic programming algo-
rithm which performs text segmentation by global
minimization of a segmentation cost consisting
of two terms: within-segment word similarity and
prior information about segment length. The per-
formance of our algorithm is quite satisfactory
considering that it yields the best results reported
so far on the segmentation of Choi's text collec-
tion. In the future we intent to focus on the cal-
culation of the length model based on the aver-
age number of sentences as opposed to the calcu-
lation of the length model based on the average
number of words in the documents's segments.We
also intent to use other measures of sentece sim-
ilarity. We also plan to apply our algorithm to
a wide spectrum of text segmentation tasks. We
are interested in segmentation of non artificial e.g
real texts, texts having a diverse distribution of
segment length, long texts, change-of-topic de-
tection in newsfeeds and segmentation of non-
English (particularly Greek) texts.
References
Beeferman, D., Berger, A., and Lafferty, J. 1997.
Text
segmentation using exponential models.
In Proceed-
ings of the 2nd Conference on Empirical Methods in
Natural Language Processing, pp. 35-46.
Blei, D.M. and Moreno, P.J. 2001.
Topic segmentation
with an aspect hidden Markov model.
Tech. Rep.
CRL 2001-07, COMPAQ Cambridge Research Lab.
Choi, F.Y.Y. 2000.
Advances in domain independent
linear text segmentation.
In Proceedings of the 1st
176
Meeting of the North American Chapter of the As-
sociation for Computational Linguistics, pp. 26-33.
Choi, FYI, Wiemer-Hastings, P.
&
Moore, J. 2001.
Latent semantic analysis for text segmentation.
In
Proceedings of the 6th Conference on Empirical
Methods in Natural Language Processing, pp.109-
117.
Francis, W.N. and Kucera, H. 1982.
Frequency
Analysis of English Usage: Lexicon and Grammar.
Houghton Mifflin.
Halliday, M. and Hasan, R. 1976.
Cohesion in English.
Longman.
Hearst, M. A. and Plaunt, C. 1993.
Subtopic struc-
turing for full-length document access.
In Proceed-
ings of the 16th Annual International of Association
of Computer Machinery - Special Interest Group on
Information Retrieval (ACM / SIGIR) Conference
on Research and Development in Information Re-
trieval, pp. 59-68.
Hearst, M. A. 1994.
Multi-paragraph segmentation
of expository texts.
In Proceedings of the 32nd An-
nual Meeting of the Association for Computational
Linguistic, pp. 9-16.
Heinonen, 0. 1998.
Optimal Multi-Paragraph
Text Segmentation by Dynamic Programming.
In Proceedings of 17th International Conference
on Computational Linguistics (COLING-ACL'98),
pp.1484-1486.
Hirschberg, J., and Litman, D. 1993. Empirical studies
on the disambiguation and cue phrases.
Computa-
tional Linguistics,vol.19, pp.501-530.
Kan, M., Klavans, J.L. and McKeown, K. R. 1998.
Linear segmentation and segment significance.
In
Proceedings of the 6th International Workshop of
Very Large Corpora, pp. 197-205.
Kozima, H. 1993.
Text Segmentation based on similar-
ity between words.
In Proceedings of the 31st An-
nual Meeting of the Association for Computational
Linguistics, pp. 286-288.
Kozima, H and Furugori, T. 1993.
Similarity between
words computed by spreading activation on an En-
glish dictionary.
In Proceedings of 6th Conference
of the European Chapter of the Association for Com-
putational Linguistics, pp. 232-239.
Morris, J. and Hirst, G. 1991.
Lexical cohesion com-
puted by thesaural relations as an indicator of the
structure of text.
Computational Linguistics, vol.17,
pp.21-42.
Passoneau, R. and Litman, D.J. 1993.
Intention -
based segmentation: Human reliability and corre-
lation with linguistic cues.
In Proceedings of the
31st Meeting of the Association for Computational
Liguistics, pp. 148-155.
Petridis, V., Kaburlazos, V., Fragkou, P., Kehagias, A.
2001.
Text Classification using the -FLNMAP Neu-
ral Network.
Proceedings of the IJCNN'01 on Neu-
ral Networks.
Ponte, J. M. and Croft, W. B. 1997.
Text segmentation
by topic.
In Proceedings of the 1st European Con-
ference on Research and Advanced Technology for
Digital Libraries, pp.120-129.
Porter, M., F. 1980.
An algorithm for suffix stripping.
newblock Program, vol.14, pp.130-137.
Reynar, J.C. 1998.
Topic Segmentation: Algorithms
and Applications.
Ph.D. Thesis, Dept. of Computer
Science, Univ. of Pennsylvania.
Reynar, J.C. 1999.
Statistical models for topic segmen-
tation.
In Proceedings of the 37th Annual Meeting
of the Association for Computational Liguistics, pp.
357-364.
Roget, P.M. 1977.
Roget's International Thesaurus.
Harper and Row, 4th edition.
Utiyama, M., and Isahara, H. 2001. A
statistical
model for domain - independent text segmentation.
In Proceedings of the 9th Conference of the Euro-
pean Chapter of the Association for Computational
Linguistics, pp.491-498.
Xu, J. and Croft, W.B. 1996.
Query expansion us-
ing local and global document analysis.
In Proceed-
ings of the 19th Annual International of Association
of Computer Machinery - Special Interest Group on
Information Retrieval (ACM / SIGIR) Conference
on Research and Development in Information Re-
trieval, pp. 4-11.
Yaari, Y. 1997.
Segmentation of expository texts by hi-
erarchical agglomerative clustering.
In Proceedings
of the Conference on Recent Advances in Natural
Language Processing, pp.59-65.
J. Yamron, I. Carp, L. Gillick, S.Lowe, and P. van Mul-
bregt. 1999.
Topic tracking in a news stream.
In
Proceedings of DARPA Broadcast News Workshop,
pp. 133-136.
Youmans, G. 1991. A
new tool for discourse analysis:
The vocabulary management profile.
Language, vol.
67, pp.763-789.
177
Exp1 r = 1
Exp1 r=0.66
Exp1 r=0.5
0
Exp1 r=0.33
A
Exp2 r = 1
0
Exp2 r=0.66
Exp2 r=0.5
0
Exp2 r=0.33
0.45
0.4
0.35
0.3
if 0.25
4
0.5
0.5
Exp1 r = 1
o
Exp1 r=0.66
•
Exp1 r=0.5
•
Exp1 r=0.33
Exp2 r = 1
0
Exp2 r=0.66
•
Exp2 r=0.5
•
Exp2 r=0.33
0.45
0 4
0.35
0.3
0.25
0
0
()
4'
8
0.1
0
A
*
A
O.2
A*
0
0
*
A
4A *
+
0.15
2
o
x
4
A
tr
A
0
x
+
O.
o
x
+
*MOOD
0
x
>ccoAD
0
*
+
+
x
0.05
1
1
I
I
I
I
I
1
1
0
0.1
0.2
0.3
0.4
0.5
0.6
0.7
0.8
0.9
Y
0.2
0.15
0,x,
0
+
+
5+
0.05
-
0 +I+
01000
0850D
0
1
1
1
1
1
1
1
1
1
0.1
0.2
0.3
0.4
0.5
0.6
0.7
0.8
0.9
Y
(a) Figure 1:Pk plotted as a function of -y and r for Set()
(c)
Figure 3:Pk plotted as a function of -y and r for Set2
Exp1 r = 1
•
Exp1 r=0.66
•
Exp1 r=0.5
•
Exp1 r=0.33
Exp2 r = 1
0
Exp2 r=0.66
•
Exp2 r=0.5
•
Exp2 r=0.33
Exp1 r = 1
o
Exp1 r=0.66
•
Exp1 r=0.5
•
Exp1 r=0.33
Exp2 r = 1
0
Exp2 r=0.66
•
Exp2 r=0.5
•
Exp2 r=0.33
0.4
0.35
0.3
cf 0.25
0.2
0.15
0.45
0.4
0.35
0.3
A
0
+
x
0.25*
0.2
,P*
0.15
(
t
)
,A*
0
A
A
o*
0
0
A
0.45
0.05
0
0.1
+
0
aGo<
11
1*
0.1
0
+
+
0.2
0.3
0.4
1
1
1
1
1
0.5
0.6
0.7
0.8
0.9
Y
0 .1
x
+
0
+
i
x
A
4
0
o
9
+
t
0
o
a
+
o
+
+
0
*
+
0
c?
I
I
I
I
I
I
0.1
0.2
0.3
0.4
0.5
0.6
0.7
0.8
0.9
(b) Figure 2:Pk plotted as a function of -y and r for Setl
(d) Figure 4:Pk plotted as a function of -y and r for Set3
178