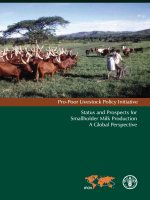
Status and Prospects for Smallholder Milk Production A Global Perspective doc
Bạn đang xem bản rút gọn của tài liệu. Xem và tải ngay bản đầy đủ của tài liệu tại đây (15.28 MB, 186 trang )
Status and Prospects for
Smallholder Milk Production
A Global Perspective
Pro-Poor Livestock Policy Initiative
A Living from Livestock
Pro-Poor Livestock Policy Initiative
Status and Prospects for
Smallholder Milk Production
A Global Perspective
Editors:
Torsten Hemme
Joachim Otte
FOOD AND AGRICULTURE ORGANIZATION OF THE UNITED NATIONS
Rome, 2010
iv
© IFCN 2008
Editors
Torsten Hemme
IFCN Dairy Research Center at University Kiel, www.ifcndairy.org
Schauenburgerstr. 116, 24118 Kiel, Germany
Joachim Otte
Pro-Poor Livestock Policy Initiative, www.fao.org/ag/pplpi.html
FAO Animal Production and Health Division
Rome, Italy
Recommended citation
FAO 2010: Status of and Prospects for Smallholder Milk Production – A Global Perspective, by T. Hemme and J. Otte. Rome
Credits
The photographs were provided by IFCN researchers and Katja Seifert
Cover photo 19312_R.Faidutti
Design, layout & image editing: Katja Seifert
Cover design: S. Villicana
The designations employed and the presentation of material in this information product do not imply the expression of any opinion whatsoever on the part of the
Food and Agriculture Organization of the United nations (FAO) or the International Farm Comparison Network (IFCN) concerning the legal or development status of
any country, territory, city or area or of its authorities, or concerning the delineation of its frontiers or boundaries. The mention of specic companies or products of
manufacturers, whether or not these have been patented, does not imply that these have been endorsed or recommended by FAO or IFCN in preference to others of
similar nature that are not mentioned. The views expressed in this information product are those of the authors and do not necessarily reect the views of FAO.
All rights reserved. Reproduction and dissemination of material in this information product for educational or other non-commercial purposes are authorized without
any prior written permission from the copyright holders provided the source is fully acknowledged. Reproduction of material in this information product for resale or
other commercial purposes is prohibited without prior permission of the copyright holders. Applications for such permission should be addressed to:
Chief
Electronic Publishing Policy and Support Branch
Communication Division
FAO
Viale delle terme di Caracalla, 00153 Rome, Italy
or by e-mail to:
ISBN 978-92-5-106545-7
© IFCN 2008
1
Preface
Of an estimated 2.6 billion people in the developing world
surviving on less than US$2 per day, some 1.4 billion are
classied as ‘extremely’ poor inasmuch as they live on less
than US$1.25/day. Although the incidence of extreme poverty
is highest in sub-Saharan Africa (50 percent), Asia is home
to the majority of the extremely poor (933 million). Poverty
is closely associated with malnutrition, particularly under-
nutrition; the Food and Agriculture Organization of the
United Nations (FAO) estimates that, in 2009, some 1.02 billion
people, or one sixth of the world’s population, were under-
nourished.
More than three quarters of these 1.4 billion extremely poor
live in rural areas and partly or wholly depend on agriculture
for their livelihoods; almost half a billion of them also partly
depend on livestock. Given that it is impossible for the
expansion of agricultural land to keep pace with population
growth in most developing countries, it is not easy to expand
agricultural production horizontally. Rather, productivity
gains that result in increased value of output per hectare of
land are essential for the purpose of improving rural incomes.
Livestock have a number of characteristics that contribute to
sustainable rural development: among other things, livestock
provide marketable products (generally of a higher value and
less vulnerable to critical harvest timing than many crops)
that can be produced by small-scale, household production
systems. Judicious development of the livestock sector could
thus make a substantial contribution to raising nutrition
levels, increasing agricultural productivity, improving the
lives of rural people, contributing to growth of the world
economy and achieving the Millennium Development Goal of
eradicating extreme poverty and hunger.
It is estimated that almost 150 million farm households,
i.e. more than 750 million people, are engaged in milk
production, the majority of them in developing countries.
Annual milk consumption growth rates in these countries
averaged 3.5 to 4.0 percent over the decade 1995-2005, at
least double the growth rates of 1.4 to 2.0 percent for major
staple foods over the same period. Therefore, if properly
directed, dairy sector development could serve as a powerful
tool for reducing poverty.
The aim of the present publication is to provide an overview
of the global dairy sector and of the forces shaping its
development vis-à-vis the characteristics of ‘typical’ dairy
farming systems. In this way, it is hoped to facilitate a
better understanding of the opportunities available for
improvement, as well as the constraints/threats faced by
smallholder dairy producers in a rapidly changing world.
It also attempts to chart an approach to dairy sector
development that will allow smallholder producers to
participate in the growing market for milk and milk products.
Samuel Jutzi
Director, Animal Production and Health Division, FAO
2
© IFCN 2008
Page No.
Abbreviations and acronyms 4
Note of the editors and acknowledgements 5
Executive Summary 6
1 Introduction 10
2 Global Dairy Sector: Status and Trends
2.1 Summary 16
2.2 Global price trends for feed and dairy products 18
2.3 Milk production trends 20
2.4 Farmers’ milk prices and milk:feed price ratio 22
2.5 Dairy farm numbers world wide 24
2.6 Pattern of dairy trade and milk processing 26
2.7 Milk consumption and its drivers 28
3 Milk Production and Dairy Sector Proles
3.1 Summary 34
3.2 India 38
3.3 Pakistan 42
3.4 Bangladesh 46
3.5 Thailand 50
3.6 Viet Nam 54
3.7 China 58
3.8 Uganda 62
3.9 Cameroon 66
3.10 Morocco 70
3.11 Peru 74
3.12 Germany 78
3.13 United States of America 82
3.14 New Zealand 86
4 International Competitiveness of ‘Typical’ Dairy Farms
4.1 Summary 94
4.2 Overview of selected dairy farm types 96
4.3 Overview of the whole farm 98
4.4 Farm income, prots and returns to labour 100
4.5 Asset structure and returns on investments 102
4.6 Producer milk prices and non-milk returns 104
4.7 Costs of milk production only; milk prices 106
4.8 Total milk production costs and returns to the dairy enterprise 108
4.9 Cost component: labour 110
4.10 Cost component: land 112
4.11 Cost component: capital (excluding land and quota) 114
Table of Contents
© IFCN 2008
3
Table of Contents
5 Special Studies
5.1 Summary 120
5.2 Impact analysis of dairy development programmes in Andhra Pradesh, India 122
5.3 Impact analysis of dairy development programmes in Uganda 124
5.4 Farm development strategies for dairy farms in Haryana (India) 126
5.5 Policy impact analysis for dairy farms in Thailand and Viet Nam 128
5.6 Comparison of dairy chains in Karnal, India 130
5.7 Cost of ‘quality milk’ in Karnataka, India: a case study 132
5.8 The competitiveness of skim milk powder from Uganda 134
5.9 The dairy feed chain in Peru: a case study 136
5.10 A comparison of dairy farming systems in India 138
5.11 A comparison of rural & peri-urban milk production systems in South Asia 140
5.12 Comparison of small- and large-scale dairy farming systems in India & US 142
5.13 Comparing household, whole farm and dairy enterprise levels in India 144
5.14 Methodological approach for guiding dairy development activities 146
5.15 Comparison of IFCN and Extrapolate approaches to impact analysis 148
5.16 Assessing the risks faced by dairy farms 150
5.17 Incorporating risk in dairy development strategy formulation 152
5.18 Carbon footprints of dairy farming systems 154
6 Conclusions and Recommendations for Smallholder Dairy Development 160
7 References 165
Annexes
A1 The International Farm Comparison Network (IFCN) 168
A2 FAO’s Pro-Poor Livestock Policy Initiative (PPLPI) 169
A3 Further reading / papers by IFCN and PPLPI 171
A4 Researchers who have contributed 172
A5 Farm description 176
A6 Description of data collection for typical dairy farms 178
A7 Exchange rates 1996 – 2007 179
A8 Assumptions for the calculations – farm economic indicators 180
4
© IFCN 2008
Abbreviations and acronyms
Currencies
ALL Albanian Lek
ARS Argentine Peso
AUD Australian Dollar
BDT Bangladeshi Taka
BGL Bulgarian Lev
BRL Brazilian Real
BYR Belarus Rouble
CAD Canadian Dollar
CHF Swiss Franc
CLP Chilean Peso
CNY Chinese Renminbi Yuan
CSK Czech Koruna
DKK Danish Krone
ECS Ecuador Sucre
EEK Estonian Kroon
EGP Egyptian Pound
ETB Ethiopian Birr
EUR European Euro
GBP British Pound
GTQ Guatemalan Quetzal
HUF Hungarian Forint
IDR Indonesian Rupiah
ILS Israeli New Shekel
INR Indian Rupee
IRR Iranian Rial
JOD Jordanian Dinar
JPY Japanese Yen
KRW South Korean Won
KZT Kazakhstan Tenge
LKR Sri Lankan Rupee
LTL Lithuanian Litas
Countries
AL Albania
AM Armenia
AR Argentina
AT Austria
AU Australia
AZ Azerbaijan
BA Bosnia and Herzegovina
BD Bangladesh
BE Belgium
BG Bulgaria
BR Brazil
BY Belarus
CA Canada
CH Switzerland
CL Chile
CM Cameroon
CN China
CY Cyprus
CZ Czech Republic
DE Germany
DK Denmark
EC Ecuador
EE Estonia
EG Egypt
ES Spain
ET Ethiopia
FI Finland
FR France
GB United Kingdom
GR Greece
GT Guatemala
HR Croatia
HU Hungary
ID Indonesia
IE Ireland
IL Israel
IN India
IR Iran
IS Iceland
IT Italy
Units
ct cent
Cwt hundredweight = 100 Ib (45.36 kg)
ECM Energy corrected milk 4% fat, 3.3% protein
g gram
h hour
ha hectare
Ib Pound (453.59 g)
kg kilogram
l litre
MCAL Mega calorie
ml millilitre
NE Net energy
ppl pence per litre
Snf Solids non-fat
t metric tons
yr year
Others
AI Articial insemination
CAP Common Agricultural Policy (in EU)
CIF Cost, insurance, freight
CIS Commonwealth of Independent States
(Countries of the former Soviet Union)
CPI Consumer Price Index
FAO Food and Agricultural Organisation
FOB Free on board
GDP Gross Domestic Product
HH household
IDF International Dairy Federation
IFCN International Farm Comparison Network
IMF International Monetary Fund
ME Milk Equivalent
OECD Organisation for Economic Co-operation
and Development
P&L Prot and loss account
PAM Policy analysis matrix
PPLPI Pro Poor Livestock Policy Initiative
sbm soya bean meal
SMP Skim milk powder
TIPI-CAL Technology Impact and Policy Impact Calculation Model
UHT Ultra High Temperature (milk)
VAT Value added tax
WTO World Trade Organization
ZMP Zentrale Markt- und Preisberichtstelle (Germany)
JO Jordan
JP Japan
KR Korea, Republic of
KZ Kazakhstan
LK Sri Lanka
LT Lithuania
LU Luxembourg
LV Latvia
MA Morocco
MD Moldova
MK Macedonia
MM Myanmar
MN Mongolia
MX Mexico
NG Nigeria
NL The Netherlands
NO Norway
NZ New Zealand
PE Peru
PH Philippines
PK Pakistan
PL Poland
PT Portugal
RO Romania
RU Russian Federation
SA Saudi Arabia
SD Sudan
SE Sweden
SI Slovenia
SK Slovakia
SY Syria
TH Thailand
TR Turkey
TW Taiwan
UA Ukraine
UG Uganda
US USA
UY Uruguay
UZ Uzbekistan
VN Viet Nam
ZA South Africa
LVL Latvian Lats
MAD Moroccan Dirham
MMK Myanmar Kyat
MNT Mongolian Tugrik
MXN Mexican Peso
NGN Nigerian Naira
NOK Norwegian Kroner
NZD New Zealand Dollar
PEN Peruvian Nuevo Sol
PHP Philippine Peso
PKR Pakistan Rupee
PLN Polish Zloty
RON Romanian New Lei
RUB Russian Rouble
SAR Saudi Riyal
SDD Sudanese Dinar
SEK Swedish Krona
SIT Sloveniaan Tolar
SKK Slovak Koruna
SYP Syrian Pound
THB Thai Baht
TRL Turkish Lira
TWD Taiwan Dollar
UAH Ukraine Hryvnia
UGX Uganda Shilling
USD US Dollar
UYP Uruguayan Peso
UZS Uzbekistani Soum
VND Viet Namese Dong
XAF Communaute Financiere
Africaine Franc
ZAR South African Rand
© IFCN 2008
5
Note of the editors and acknowledgements
Why dairy?
Since 2003, the Pro Poor Livestock Policy Initiative of the Food
and Agriculture Organization of the United Nations and the
IFCN (International Farm Comparison Network) have been
cooperating on the compilation and analysis of information
on dairy sector development and on the household
economics of dairy farming over a wide range of countries
across the globe. The aim of this book is to bring these studies
together and to provide a holistic picture on the trends and
drivers in the dairy sector as well as the implications these
may have for the future of dairy farming, in particular among
the smaller-scale producers. We consider the following to be
the salient ndings of the studies:
The dairy sector provides income and employment
to many, often poor, people:
It is estimated that some 12 to 14 percent of the world
population, or 750 to 900 million people, live on dairy farms
or within dairy farming households. The mean dairy herd size
is around two cows that give an average milk yield of 11 litres
per farm per day. Production of 1 million litres of milk per year
on small-scale dairy farms creates approximately 200 on-farm
jobs: in developed countries and in intensive dairy operations,
such a volume of milk creates less than ve on-farm jobs.
There is a great opportunity for dairy sector
development to contribute to poverty reduction:
Throughout the world, there are more than 6 billion
consumers of milk and milk products, the majority of them
in developing countries. As such, if it is to keep pace with
the growth in demand, milk production will need to grow by
close to 2 percent per year. If small-scale milk producers in
developing countries continue being in a position to compete
on a level ‘playing eld’ with large-scale, capital-intensive
dairy farming systems in developed (and developing)
countries, dairy-sector development will be a powerful tool
for reducing poverty and creating wealth in the developing
world.
A word of thanks:
We would both like to express our sincere thanks to all dairy
farmers, researchers and institutions that have contributed,
directly and indirectly, to this book. It is thanks to the passion
for dairy-sector development and the continuous input from
researchers from more than 60 countries cooperating under
the umbrella of the IFCN, that it has been possible to produce
this book. Among the researchers, special mention is due
to the contributions of Otto Garcia, Asaah Ndambi, Amit
Saha, Khalid Mahmood, Juliane Stoll, Carlos Gomez, Henning
Bendfeld and Martin Hagemann.
In addition to the dairy researchers who provided the
contents of the book, none of this would have been possible
without the help of those who worked behind the scenes
on the ‘organizational’ and ‘editorial’ aspects involved. In
this respect, we also wish to express our special gratitude
to Eva Asmussen, Katja Seifert and Brenda Thomas for their
contributions and dedication.
Joachim Otte, Torsten Hemme,
Coordinator of the PPLPI Chairman of the IFCN
6
© IFCN 2008
Executive summary
It is estimated that, throughout the world, almost 150
million farm households are engaged in milk production,
the majority of them in developing countries where annual
growth rates in milk consumption averaged 3.5 to 4.0 percent
in the decade 1995-2005. This is at least double the growth
rates of 1.4 to 2.0 percent for major staple foods over the
same period. Therefore, if properly directed, dairy sector
development could serve as a powerful tool for reducing
poverty.
With this in mind, the aim of the present publication is to
provide an overview of the global dairy sector and the forces
shaping its development with a focus on the characteristics
of, and implications for, ‘typical’, mostly smallholder, dairy
farming systems in developing countries.
Status and trends in the global dairy sector
Based on milk equivalents (ME), average per capita global
milk consumption amounts to about 100 kg of milk per year,
with very signicant dierences between countries/regions.
Per capita consumption in Western Europe is in excess of
300 kg of milk per year compared with less than 30 kg (and
even sometimes as little as 10 kg) in some African and Asian
countries. In the past, increases in global milk demand have
been mainly driven by population growth, whereas nowadays
they are increasingly also fuelled by rising per capita milk
consumption in some highly populated developing countries.
Increasing income levels are expected to raise the demand for
milk and dairy products by more than 1.8 percent per annum.
Should increases in milk production not follow suit, dairy
prices will rise signicantly over past levels.
South Asia and EU-25 are the most important dairy regions,
accounting for 44 percent of global milk production. In
the period 2002 to 2007, world milk production grew by
13 percent, or by an average of 15 million tons of energy-
corrected milk (ECM) per year – mainly through production
increases in China, India and Pakistan. Overall, therefore,
developing countries, which rely predominantly on
smallholder dairy production systems, have increased their
share in world milk production.
Milk is likely to become one of the most volatile agricultural
commodities owing to: (a) the strong inuence that small
changes in the quantities available internationally have on
world market prices; (b) the length of time required for milk
production to increase in response to rising prices; and (c) the
delayed reaction of consumer demand to changing dairy
commodity prices.
A key determinant of milk prices is the cost of feed, which
directly aects milk production through increased production
costs and, indirectly, higher land values. Demand for grain, an
ingredient of dairy rations, is driven by the need for food, feed
and fuel of a growing world population. Higher incomes in
developing countries raise the demand for food derived from
livestock, leading to more demand for animal feed. Higher
energy prices and policies that promote bio-fuels lead to an
increased use of crops for energy production and, thereby,
push up the prices of feed and land. The Organisation for
Economic Co-operation and Development (OECD) and
the Food and Agricultural Policy Research Institute (FAPRI)
forecast that, in the long term, feed price levels will increase
to about 50 percent above those of 2002-2006.
The milk:feed price ratio is one of the main factors
determining the choice of dairy production system. The
highest milk:feed price ratio (more than 2.5) is seen in North
America, where, as a likely consequence, the most intensive
milk production systems are found. Farming systems with
lower milk yields, making little use of compound feed, are
generally observed in countries with a milk:feed price ratio of
less than 1.5.
Very few countries are self-sucient with regard to milk. The
main milk-surplus countries are Argentina, Australia, New
Zealand, USA, Uruguay and countries of the European Union
(EU) and Eastern Europe. The main milk-decit countries are
Algeria, China, Japan, Mexico, the Philippines and Russia. Over
the period1990-2004, global milk exports increased from
4.4 to 7.1 percent of production, while the share delivered to
formal milk processors increased from 14 to 24 percent.
International competitiveness of ‘typical’
dairy farms
Farms representative of various dairy farming systems in
Bangladesh, Cameroon, China, India, Morocco, Pakistan, Peru,
Thailand, Uganda and Viet Nam were subjected to detailed
technical and economic analyses. For industrialized countries,
similar analyses were conducted for farms in Germany, New
Zealand and the USA.
Milk returns account for 55 to 95 percent of the returns of all
farm types analysed and range from US$12 to US$36/100 kg
of ECM. Non-milk returns range from US$2 to 38/100 kg ECM.
Non-milk returns were very low for the farms in India whereas
they were very high in Germany and Morocco.
Average milk production costs in the three industrialized
countries covered by the study stand at US$31.4/100 kg, or 56
percent above the average production cost of US$20.2/100 kg
calculated for the ten developing countries while the average
price of milk in the three industrialized countries (US$31.2/100
kg) is only 30 percent higher than that in the developing
countries (US$24.0/100 kg). Thus, the overall protability of
milk production appears to be higher in developing than in
industrialized countries, which may be one of the reasons
why developing countries are increasing their shares in global
dairy production.
© IFCN 2008
7
Given the major dierences in agricultural wage rates
between industrialized and developing countries, it could be
assumed that in the latter farms have a labour cost advantage.
However, this was found not to be the case when comparing
labour costs per litre of milk, mainly because countries with
higher salaries also tend to have a signicantly higher level
of labour productivity. Per litre of milk, the labour costs of
a nine-cow dairy farm in Punjab, India, are similar to those
of a 350-cow farm in the USA. The main cost advantage of
smallholder dairy farming lies in the use of low(er)-cost feed
and the overall ‘low-tech’ approach to milk production. Cows
fed on crop residues, such as straw, are signicantly lower-cost
producers of milk than high-yielding, grain-fed dairy cows.
Given the rapid increases in feed prices over the recent
past, it is important to consider how this trend aects the
competitiveness of small-scale dairy farmers in developing
countries. As these smallholder dairy systems normally use
much less compound feed per kilogram of milk than dairy
farms in industrialized countries, rising feed prices increase
the cost of milk production in the latter to a larger extent
than in the low-yield systems predominating in developing
countries. Thus, as feed prices increase, ‘typical’ smallholder
dairy farms become more cost-competitive.
For dairy farming to remain sustainable, it must be able to
compete for labour on local labour markets. If the ‘return to
labour’ in dairy farming (i.e. the ‘value-added’ per hour of
labour put into dairy farming) is higher than the average local
wage rate, the dairy farming system can pay competitive
wages and should be sustainable from the labour standpoint.
The average return to labour observed in the developing
countries covered by this study is US$0.45/hour, which is
45 percent higher than the average local wage of US$0.31/
hour. In the three industrialized countries covered, the
average return to labour is US$16.30/hour, which is still
22 percent above the average estimated wage of US$13.30/
hour. These gures indicate that it would be possible for
dairy farming to compete on local labour markets in both
groups of countries. However, milk production quickly loses
its competitive advantage when local wages rise faster than
labour productivity.
Conclusions for smallholder dairy development
The various analyses and case studies presented in this
document indicate that:
small-scale milk production not only improves the food
security of milk-producing households but also helps to
create numerous employment opportunities throughout
the dairy chain, i.e. for small-scale rural processors and
intermediaries; and
small-scale milk producers incur low production costs.
Thus, if well organized, they should be able to compete
with large-scale, capital-intensive ‘high-tech’ dairy farming
systems in industrialized (and developing) countries.
Dairy development may therefore serve as a powerful tool
for reducing poverty. Devising a viable dairy development
strategy for smallholders calls for a detailed analysis of strengths,
weaknesses, opportunities and threats posed by the external
environment. The strengths of smallholder dairy systems
are low production costs; high prot margins; low liabilities;
limited liquidity risk; and relative resilience to rising feed prices
– strengths that enable smallholders to serve as a competitive
source of milk supply. However, smallholder milk producers are
also beset by a number of weaknesses: lack of knowledge and
technical know-how; poor access to support services; low capital
reserves and limited access to credit; low (labour) productivity;
and poor milk quality – all of which limit their ability to take
advantage of market opportunities.
Major opportunities for smallholder producers engaged in
dairy production are: (i) growing demand for dairy products
in developing countries; (ii) probable milk price increases;
(iii) potential to increase milk yields through relatively few
additional inputs; (iv) potential to increase dairy labour
productivity; and (v) employment generation in the dairy
value chain (for example, absorbing family labour released by
higher on-farm labour productivity). However, smallholders
in developing countries also face major threats, namely (a)
policy support for (and competition from) dairy farmers in
OECD countries; (b) increased consumer demand for food
safety; (c) environmental concerns (low-yield dairy systems are
estimated to have higher carbon footprints per 100 kg of milk
produced than high-yield systems); (d) increasing local wage
rates; (e) intergenerational discontinuity (children of the better-
performing farmers leave the system); (f) under-investment
in dairy chain infrastructure; and (g) inappropriate dairy
development policies and investment plans.
Given the increasing ‘interconnectedness’ of global agriculture,
the ability of smallholder milk producers to participate in the
dairy market in a protable manner will depend not only on their
own competitiveness, mainly determined by production costs,
but also, and to an increasing extent, on the eciency of the
dairy chains of which they are part. Therefore, recommendations
for smallholder dairy development must include strategies
to increase the competitiveness in all segments of the dairy
chain, namely, input supply, milk production, processing,
distribution and retailing. In other words, to be successful, any
dairy development strategy must be based on the principle of
‘creating value’ in each and every segment of the dairy chain. This
makes formulation of a dairy development strategy a complex
task, involving a large number of stakeholders and requiring
comprehensive analysis and continuous reassessment.
Executive summary
China
Morocco
Chapter 1
Introduction
Pakistan
Pictures: Farmers with their animals (Pictures by: Katja Seifert, Otto Garcia, Khalid Mahmood)
10
© IFCN 2008
1.1 Introduction
It has been estimated that in 2005 some 1.4 billion people
lived in absolute poverty
1
and that almost 1 billion of them
were aected by chronic mal- or under-nutrition. Recent
food price increases are expected to have pushed many more
people – perhaps as many as 100 million – even further into
that dire situation. The ght against poverty and hunger is
thus a major global concern. Indeed, at the United Nations
Millennium Summit of September 2000, world leaders
pledged, inter alia, to halve by 2015 the proportion of people
living in extreme poverty and hunger.
An estimated 75 percent of the world’s poor live in rural
areas, and at least 600 million of these people keep livestock
to produce food, generate cash income, manage risks and
build up assets. With the valuable contribution livestock
makes to sustaining livelihoods, especially in rural areas, the
development of small-scale livestock enterprises must be
seen as a key element of any eorts to eradicate extreme
poverty and hunger.
Milk production is an important livestock-sector activity.
According to data gathered by the International Farm
Comparison Network (IFCN), in 2005 around 149 million farm
households throughout the world were engaged in milk
production. On average, these households keep two milking
cows (or bualoes) yielding about 11 litres/day. Assuming a
mean household size of ve to six, some 750 to 900 million
people (or 12-14 percent of the world population) rely on
dairy farming to some extent.
In view of the above, it is important to assess whether:
small-scale milk production can contribute to
signicantly reducing poverty and improving nutrition
and food security; and
small-scale milk producers will be able to compete with
large-scale, capital-intensive ‘high-tech’ dairy farming
systems such as those in the USA and other developed
countries.
If the answer to both questions is in the armative, the
promotion of small-scale dairy production may well serve
as an important tool for achieving the above-mentioned
Millennium Development Goal. Should the response to the
second question be negative, however, it is not clear what will
happen to the large numbers of people currently making at
least part of their living from milk production.
1
Surviving on an income below the international poverty line of $1.25/day.
© IFCN 2008
11
The purpose of the present publication is to help readers
gain a better understanding of the global dairy sector, and
the opportunities, constraints and threats facing smallholder
producers. To that end, the performance of ‘typical’ dairy
enterprises and their external environment, and the impact
of potential technical and policy interventions, have been
analysed for selected developing and developed countries.
The analytical tools developed by the IFCN form the
backbone of the various analyses undertaken, backed up by
dairy researchers from 72 countries and over 60 dairy-related
companies. The methodological framework is based on the
TIPI-CAL Model (Hemme, 2000) and on the concept of typical
farms (Richardson and Nixon, 1984). In order to provide the
necessary geographic coverage and thereby capture the
heterogeneity of dairy production systems across the world,
three developed dairy countries (Germany, New Zealand and
USA) and ten developing countries (Bangladesh, Cameroon,
the People’s Republic of China (henceforth China), India,
Morocco, Pakistan, Peru, Thailand, Uganda and Viet Nam)
were selected for study.
The time frames for some of the analyses dier inasmuch as
they draw on past work undertaken by IFCN in cooperation
with the Pro-Poor Livestock Policy Initiative (PPLPI). One
challenge was to dene the time frame for monitoring the
global market situation because price uctuations started to
become extreme as of June 2006. In Chapter 2 (global prices)
the authors undertook an in-depth review of developments
between 1996 and 2007, and incorporated updated
information from 2008.
The publication is divided into four main chapters and focuses
on:
Global dairy sector trends: an overview of the global
dairy sector and small-scale milk production (Chapter 2)
Country proles: proles of the dairy sectors of selected
developing and developed countries, highlighting
similarities and dierences among the countries
concerned (Chapter 3).
Competitiveness analyses of ‘typical’ dairy farms,
to (a) illustrate the diversity of milk production
systems throughout the world, and (b) assess the cost
competitiveness of small-scale dairy farming systems in
developing countries of Africa, Asia and Latin America
vis-à-vis dairy systems in North America, Oceania and
Western Europe (Chapter 4).
A summary of special in-depth studies on small-scale
dairy farming undertaken by IFCN in collaboration with
the PPLPI (Chapter 5).
Conclusions and recommendations: overall conclusions
with regard to small-scale dairy farming and dairy
development policies, and an analysis of strengths,
weaknesses, opportunities and threats (Chapter 6).
The authors are well aware of the complexity of the subject
but hope the publication will nevertheless contribute to a
better understanding of milk production worldwide.
1.1 Introduction
India
Pakistan
New Zealand
Germany
China
Chapter 2
Global Dairy Sector: Status and Trends
Photos previous pages: Harvesting grass in India, Egypt, New Zealand and Germany (Photos: Katja Seifert)
Germany
Pictures on this and previous double page: Harvesting (Pictures by: Katja Seifert, Khalid Mahmood)
2.1 Summary 16
2.2 Global price trends for feed and dairy products 18
2.3 Milk production trends 20
2.4 Farmers’ milk prices and milk:feed price ratio 22
2.5 Dairy farm numbers world wide 24
2.6 Pattern of dairy trade and milk processing 26
2.7 Milk consumption and its drivers 28
16
© IFCN 2008
2.1 Summary
Introduction
This chapter contains an analytical overview of major global
trends in milk and feed prices, milk supply, dairy sector
structures, trade in dairy products and consumption.
World market prices for feed and dairy products
During the period 1981 to 2005, the calculated world market
price for milk ranged between US$10/ton or and US$25/ton.
However, in 2007, it increased rapidly by 75 percent to more
than US$45/ton as a result of the rise in price of skimmed milk
powder (SMP) and butter from US$1 000 to 2 000/ton to US$4
000/ton in response to a shortfall in milk availability relative
to world demand.
In the past, increases in demand were driven mainly by
population growth, whereas they are now increasingly fuelled
by rising per capita milk consumption in developing countries
(see Section 2.7). The decit in world milk production since
2004 did not have a major eect on prices at rst as additional
supplies of about 2 million tons/year were available from
stocks in the United States of America (USA) and the European
Union (EU). However, prices increased dramatically once
these supplies were exhausted (SMP: end-2006; butter: mid-
2007). Climatic events and policy interventions (hindering
of exports) may also be seen as determinants of this price
development. IFCN estimates the additional volume of milk
needed to ’balance’ the markets at lower price levels as 2
to 4 million tons/year or about 0.5 percent of world milk
production.
Milk will likely become one of the most volatile agricultural
commodities in future. This is because of: (a) the strong
inuence that small changes in the quantities available
internationally have on world market prices; (b) the length of
time before there are increases in milk production as a result
of price changes; and (c) delayed reaction of the demand
to changing dairy commodity prices. The key challenges to
making a reliable forecast of world market prices for milk are
the nature of consumer reaction to rising milk prices and the
response of dairy farmers with regard to supply, especially
in low-cost dairy regions. Another key determinant of milk
prices is feed, which directly aects milk production through
increased costs and, indirectly, higher land prices.
World market prices for feed
In 2006, the world market price of the IFCN feed price
indicator, which is based on prices of soybean meal and corn,
was US$128/ton, and ranged from US$115/ton in Belarus to
US$467/ton in the Republic of Korea.
In 2007 the IFCN feed price indicator increased by 48 percent
from its historical level of US$150/ton. By June 2008, it had
reached US$350/ton, representing an increase of 133 percent
over the levels of 1981 to 2006.
The fact that growth in world supplies of grain has not kept
up with growing demand has led to historically high prices.
Demand for grain is driven by the need for food, feed and
fuel, and the nutriment needs of the ever-growing world
population. Higher incomes in developing countries push up
the demand for animal-based food, which leads to greater
need for feed. Higher energy prices and policies that promote
bio energy drive the use of crops for energy production and,
thereby, push up the prices of feed and land.
The Organisation for Economic Co-operation and
Development (OECD) and the Food and Agricultural Policy
Research Institute (FAPRI) forecast that, over the long term,
feed price levels will be about 50 percent higher than those of
2002 to 2006. It follows, therefore, that, compared with June
2008, grain prices will fall by about 30 percent in the coming
years.
2
The world market price for milk was calculated based on world market prices for butter and SMP and assumptions from ZMP on processing costs and technical coecients.
© IFCN 2008
17
2.1 Summary
Global milk production
South Asia and EU-25 are the most important dairy regions,
accounting for 44 percent of global milk production. In
the period 2002 to 2007, world milk production grew by
13 percent, or by an average of 15 million tons of energy-
corrected milk (ECM) per year – mainly driven by production
increases in China, India and Pakistan. Overall, therefore,
developing countries relying predominantly on smallholder
dairy production systems have increased their shares in world
milk production.
Producer milk prices in selected world regions
Section 2.4 illustrates the extent to which domestic milk
prices mirror/follow world market prices. As a general rule,
prices in Eastern Europe, Latin America, Oceania and indeed
in most developing countries, closely follow world market
levels. In contrast, milk prices in the USA and countries of
the EU, which have taris ranging from 50 percent to 120
percent, have been historically 50 to 150 percent above
the world market price. Other countries that protect their
dairy markets are Canada, Japan, Republic of Korea, Norway
and Switzerland, where milk prices exceed US$50/100 kg.
Nevertheless, milk prices vary from country to country,
determined by local milk supply and demand and degrees of
integration into the world dairy market. The lowest milk prices
(less than US$20/100 kg) were observed in Argentina, Belarus,
Indonesia, Pakistan, Uganda and Uruguay.
Milk:feed price ratios
The milk:feed price ratio is dened as the price of milk divided
by that of compound feed. The highest milk:feed price ratio
(more than 2.5) was observed in North America, where, as
a likely consequence, the most intensive milk production
systems are found. Farming systems that have lower milk
yields and make little use of compound feed are observed in
countries with a milk:feed price ratio of less than 1.5. However,
it should be borne in mind that this rule does not apply to all
the countries covered by the analysis.
Trade in dairy products and self suciency
Very few countries are self-sucient with regard to milk. The
main milk-surplus countries are Argentina, Australia, New
Zealand, USA, Uruguay and countries of the EU and Eastern
Europe. The main milk-decit countries are Algeria, China,
Japan, Mexico, the Philippines and Russia. In the period 1990
to 2004, overall milk exports increased from 4.4 percent to
7.1 percent of total production while the share delivered
to formal milk processors increased from 14 percent to 24
percent.
Global milk consumption
The majority of the world’s population lives in developing
countries, particularly in Asia. Population growth was the
main driver of increased demand for dairy products over the
period analysed. However, per capita consumption increased
signicantly in a few but highly populated countries, among
them China, Indonesia and Viet Nam.
Based on milk equivalent (ME), average per capita global milk
consumption amounts to about 100 kg of milk/year, with very
signicant dierences between countries/regions. Per capita
consumption in Western Europe is in excess of 300 kg of milk/
year compared with less than 30 kg (and even sometimes
as little as 10 kg) in some African and Asian countries. It may
be expected that increasing income levels will stimulate the
demand for milk and dairy products, meaning that future milk
production will need to increase by more than 1.8 percent
per annum. Should this not be the case, dairy prices will rise
signicantly over past levels.
18
© IFCN 2008
2.2 Global price trends for feed and dairy products
Introduction
The key determinants of milk production are world market
prices for milk and feed, as illustrated in this section.
World market prices for feed
Prices for corn, as energy feed, and soybean meal, as protein
feed, have been used for the purpose of this analysis. In 1981-
2006, the world corn price averaged US$109/ton, uctuating
between US$90/ton and US$120/ton. It rose to US$162/ton in
2007 and, in the rst six months of 2008, to US$241/ton or 121
percent above the 1981 to 2006 average and 48 percent over
the 2007 price. The time series shows that high prices were
recorded in 1996, 2007 and 2008 because of strong demand
for food, feed and fuel.
The average world market price of soybean meal in 1981-2006
ranged between US$150/ton and US$260/ton, averaging
US$212/ton. After the peak in 2004, it stayed close to US$200/
ton until it rose to US$307/ton in 2007 and averaged US$457/
ton in 2008 (January to June).
The IFCN feed price indicator - combining corn and soybean
meal prices - shows an average of US$140/ton for the period
1981-2006. It rose to US$206/ton in 2007 and to US$305/ton
in 2008 (January-June). In 2004, 2007 and 2008 prices were
signicantly above the historical average compared with
relatively low levels in the period 1999 to 2003.
World market prices for dairy products
The average world market price of butter in 1981-2006 was
US$1 580/ton, uctuating between US$1 000/ton and US$2
000/ton. It shot up to US$2 886/ton in 2007 and, in the rst six
months of 2008, increased further to US$4 021/ton.
Development of the average world market price for SMP
showed levels of less than US$1 000/ton between 1981 and
1987; moderate prices of US$1 000 to 2 000/ton, similar to
those of 1988 to 2004; and record prices of close to US$2 500/
ton in 2006, US$4 250/ton in 2007 and US$3 750/ton in the
rst six months of 2008. Prices of SMP in 2006 and 2007 were
signicantly higher than those of butter but fell below in the
rst half of 2008.
Butter and SMP prices can be converted into prices per
kilogram of fresh milk based on assumptions of the
processing cost and technical coecients provided by the
Zentrale Markt- und Preisberichtstelle GmbH (Central Market
and Price Reporting Agency, ZMP). Expressed in United States
dollars, three periods of ‘world market’ prices of liquid milk
can be distinguished:
Very low – 1981 to 1987: US$8-13/100 kg
Volatile – 1988 to 2006: US$12-26/100 kg
New levels since 2007: more than US$46/100 kg
Expressed in Euro, milk prices stayed at around €15/100 kg,
with signicant increases in 1989, 2000 and 2001, and with
major drops in 1986, 1987 and 1990 (see below for €/US$
exchange rate uctuations).
Milk:feed price ratios
From 1981 to 2007, milk prices were more volatile than
those of feed. The milk:feed price ratio, which indicates how
much feed a dairy farmer can buy with the proceeds of one
kilogram of milk, increased steadily from 0.7 kg in 1981 to
2.3 kg in 2007. The price of milk stabilized in the rst half of
2008 while that of feed continued to rise and the milk:feed
price ratio fell back to 1.5, a level at which low-input milk
production systems become more favourable. Milk prices
and farm prots were ‘high’ in 2007 but fell back in 2008,
as the milk price development was overtaken by feed price
increases, especially in high-input systems. With the new level
of milk and feed prices, the milk:feed price ratio will need to
be updated.
United States dollar/Euro exchange rate
developments
As far as exchange rates are concerned, this long-term series
shows that there was a slight devaluation of the United States
dollar against the Euro until 2001 and a stronger one since
then. The US dollar was very strong in the periods 1983 to
1985 and 2000 to 2002 but weakened in 2007 and 2008 when
it fell below the historic lows of 1992 and 1995.
Conclusions on future world market prices of milk
World milk prices have reached a record high, and a
signicant degree of volatility may be expected in the future.
This means that future world milk prices may well range
between US$15 and US$50/100 kg milk.
Explanation of variables/sources of data
2008*: Average January-June 2008.
Feed prices: World Bank. Soybean meal: CIF Rotterdam, Corn: FOB USA Gulf.
Butter and SMP prices: United States Department of Agriculture AMS Dairy Market News 2008, Oceania prices: SMP (1.25 percent fat), butter (82 percent fat).
IFCN feed price indicator: Calculation: 0.3 kg soybean meal price + 0.7 kg corn price.
Exchange rates: www.oanda.com, 2008. Exchange rates before introduction of the Euro are estimates based on the EU currencies.
Adapted from IFCN Dairy Report 2008, Chapter 2.2
© IFCN 2008
19
US$ / t
US$ / t
US$ / 100 kg milk
US$ / EUR
EUR / 100 kg milk
US$ / 100 kg
Milk price / feed price
2.2 Global price trends for feed and dairy products
20
© IFCN 2008
2.3 Milk production trends
Introduction
This section provides both an overview of milk production
levels in dierent parts of the world, and recent trends. The
milk production charts are based on an IFCN analysis for 2006-
2007 compared with 2002, undertaken in 2008. The analysis
was based on milk production surveys (cow and bualo milk)
in 78 countries and on secondary data from organizations
such as the Food and Agriculture Organization of the United
Nations (FAO). The milk production volumes of all animal
species have been standardized to ‘energy corrected milk’
(ECM, 4.0 percent fat and 3.3 percent protein). The data for
milk fat and protein content are based on national statistics
or, in the absence of such statistics, on estimates.
Shares in global milk production
World milk production is derived from cows, bualoes, goats,
sheep and camels. As shown in the map in 2007/2006 the
major milk production regions are:
South Asia: 23 percent of global production, mainly
India and Pakistan.
EU-25: 21 percent, mainly Germany and France.
USA: 12 percent.
CIS: 10 percent, mainly the Russian Federation and
Ukraine.
Latin America: 10 percent, mainly Argentina, Brazil,
Colombia and Mexico.
East and Southeast Asia: 8 percent, mainly China and
Japan.
Africa: 5 percent − the largest milk-producing countries
are Egypt, Kenya, South Africa and Sudan.
Oceania: 4 percent.
Near and Middle East: 4 percent, mainly Iran and
Turkey.
Trends in milk production
During the ve years analysed (2002 to 2007), world milk
production rose (by 13 percent) to 697 million tons, making
for an aggregate increase of 81 million tons or 15 million tons
per annum. China, India and Pakistan alone accounted for
about two thirds of all volume growth; most of the remaining
growth was in Brazil, Egypt, New Zealand, Turkey and the USA.
Together, these eight countries accounted for approximately
85 percent of all milk volume growth in 2002 to 2007.
Explanation of variables/sources of data
Milk: All types of milk (cow, bualo, goat, sheep and camel) converted to ECM. Data for fat and protein content: based on national statistics or estimates
Source of data: National statistics from IFCN partner countries (2002-2007); exception Iran, Ethiopia and Pakistan: data 2002-2006; FAO Production Yearbook data for all
other countries (2002 to 2006).
Adapted from IFCN Dairy Report 2008, Chapter 3.2
Source of data: National statistics, ZMP (for EU-15), FAOSTAT.
Milk production in 2007
O Milk production in mill tons ECM (4% fat, 3.3% protein)
(cows and buffaloes milk)
EU 25
143
79
26
114
36
32
28
10
17
© IFCN 2008
21
Q
-20 <= -5.0
Q
-5.0 <= -2.5
Q
-2.5 <= -0.5
Q
-0.5 <= 0.5
Q
0.5 <= 2.5
Q
2.5 <= 5.0
Q
5.0 <= 100
Annual growth rates in %
2002-2007 (or 2002-2006)
Source of data: National statistics from IFCN partner countries (2002-2007); Exception Iran, Ethiopia and Pakistan: data 2002-2006; FAO data for all other countries (2002-2006).
Milk production volume – Annual growth rates 2002-2007
Milk production – Annual growth rates 2002-2007
Source of data: National statistics from IFCN partner countries (2002-2007); Exception Iran, Ethiopia and Pakistan: data 2002-2006; FAO data for all other countries (2002-2006).
O Milk production increased (in mill tons milk per year)
O Milk production decreased (in mill tons milk per year)
Q
Decrease more than 0.05 mill tons per year
Q
Annual change less than 0.05 mill tons per year
Q
Increase more than 0.05 mill tons per year
Change in mill tons milk (ECM) per year
EU-25 : -0.4
-0.2
-0.4
0.5
1.3
0.9
-0.4
0.7
4.2
1.3
4.2
2.3 Milk production trends