Production and Cost in the U.S. Paper and Paperboard Industry pdf
Bạn đang xem bản rút gọn của tài liệu. Xem và tải ngay bản đầy đủ của tài liệu tại đây (192.79 KB, 23 trang )
1
Production and Cost in the U.S. Paper and Paperboard Industry
Patrick McCarthy
School of Economics and
Center for Paper Business and Industry Studies
Georgia Institute of Technology
and
Aselia Urmanbetova
School of Public Policy
Georgia Institute of Technology
CPBIS Working Paper
Abstract
The United States paper and paperboard industry has experienced significant structural changes
over the past twenty-five years, including reductions in the number of mills, lower rates of
capacity growth, employment cutbacks, and a loss of market share to foreign competitors. These
structural shifts portray an industry that increasingly has difficulty adapting to a more competitive
global environment. Based on aggregate data from 1965-1996, this paper estimates a short run
translog cost function for the industry. The estimated model fits the data well and all sample
points satisfy monotonicity and concavity conditions at all points. Among the findings, the
industry operates at slightly increasing returns to capital utilization and labor and energy are
Allen-Uzawa complements but Morishima substitutes in production. Technological progress
generated 0.02% reduction in annual operating costs and consistent with an ailing U.S. industry,
estimated marginal costs approximated average operating costs until 1982 after which marginal
costs significantly diverged from average operating costs.
JEL: D2, L11, L25, L67, L73
July 2008 (revised)
Please do not cite or quote without the explicit permission of the authors.
2
I. Introduction
During the past quarter century, the U.S. paper and paperboard industry has undergone
significant structural changes. The total number of paper and paperboard mills decreased from
351 to 220 (U.S. Census Bureau, />) between
1967 and 1997, with the number of large integrated mills decreasing 16.3% and experiencing a
65% survival rate during the period. Average annual capacity growth in paper, paperboard, and
market pulp fell from 2.4% in 1970-1980 to 1.9% in 1990-2000 (Ince et al., 2001, p. 6).
Consistent with these changes, paper and paperboard mills lost 65.9 thousand jobs between 1972
and 2000 (Economagic, />).
Part of the explanation for the changing industry structure is the competitive pressures
from Europe, Asia, and South America. As a proportion of world consumption of pulp and paper,
the U.S. industry share fell from 41.4% in 1965 to 28.1% in 2000. And notwithstanding
technological improvements during the past twenty-five years, growth in average annual output
per hour (1992 dollars) in the paper and allied products industry fell from 1.94% during 1970-
1980 to 1.57% for 1980-1990 (Bureau of Labor Statistics, Major Sector Multifactor Productivity
Indices, Paper Products, />).
A number of recent studies have analyzed the industry’s competitive structure and capital
investments. Based upon detailed mill data between 1900 and 1940, Ohanian (1994) found that
vertical integration in the U.S. industry was consistent with a transactions costs model of
consolidation, a result that Melendez (2002) confirmed using data for 1975-1995. Christensen and
Caves (1997) analyzed investment plans in the North American pulp and paper industry for the
period 1978-1991 and concluded that firms in the more competitive segment of the industry and
with fewer resources were more likely to abandon previously announced capacity expansions
whereas firms in the less competitive segment abandoned fewer projects and were more likely to
complete projects when rivals unexpectedly announced expansions. Subject to capacity
constraints, they also found that firms priced competitively. Bernstein (1992) developed a
3
dynamic model, incorporating capital adjustment costs and non-competitive behavior in the
product and factor markets. Analyzing the Canadian pulp and paper industry from 1963-1987, he
found that the industry was in short run equilibrium, competitive in both markets, and
experienced small scale economies. For the U.S. industry, Stier (1985) also found evidence of
scale economies whereas for fifteen EU countries Chas-Amil and Buongiorno (1999) estimated
scale economies that were in the constant returns range.
1
Comprising a very capital intensive industry, paper and paperboard firms operate at high
capital utilization rates. Combined with competitive pricing, this implies that industry wide
capital investments drive prices down to levels that cannot cover the cost of capital. One response
to this is industry consolidation. In an analysis of thirty-one horizontal mergers in the U.S. paper
and paperboard segment during the mid-1980s, Pesendorfer (2003) focused on capacity
investments and found that the increased capacity and a larger number of plants of the merged
firm generally reduced marginal costs. The mergers had little effect on consumer surplus,
consistent with a competitive environment, generally increased producer surplus, reflecting cost
reductions, and increased (decreased) profits overall for merged (unmerged) firms.
Aiginger and Pfaffermayr (1997) analyzed welfare losses for fifteen paper companies
operating in the European Union during 1989-1993. Arguing that cost differences among active
firms in an oligopolistic environment reflected cost inefficiencies, they demonstrated that the
associated welfare losses were primarily cost rather than demand side inefficiencies, consistent
with Pesendorfer’s welfare results and with short run pricing competition.
The objective of this paper is to better understand the production and cost characteristics
of the U.S. paper and paperboard industry, particularly in light of structural changes that have
occurred during the past twenty-five years. The analysis estimates a short run translog cost model
1
Stier (1985) found some wood-using bias over time. And in related work, Lee and Ma (2001) estimated a
translog restricted profit function on annual data for the paper sector from 1958 – 1985 to explore
substitution possibilities between unpriced pulp and wastepaper. The study found positive but statistically
insignificant substitution possibilities.
4
and contributes to the existing literature in at least three ways. First, the analysis covers a longer
time span, 1965-1996, than previous studies and uses price indices which are expected to more
accurately reflect input prices.
2
And in contrast to existing studies on the industry, we correct for
first-order serial correlation. Second, to analyze input substitutability, we report Allen-Uzawa
(one factor - one price) and Morishima (two factor - one price) elasticities of substitution. Third,
we explicitly analyze the behavior of short run average and marginal production costs in order to
get additional insight on the industry’s competitive environment.
II. Methodology
To explore the production structure of the paper and paperboard industry, we develop and
estimate a flexible form cost function model. Although there is no consensus among the several
candidate models, two popular forms are the generalized Leontief (Morrison, 1988) and the
transcendental logarithmic (translog) specification (Christensen, Jorgenson, and Lau, 1975). This
study adopts a translog specification because existing research suggests that a translog functional
form is as reliable (Guilkey, Lovell, and Sickles, 1983) as other commonly applied forms and less
sensitive to starting point values of the elasticity of substitution (Despotakis, 1986). Further, a
generalized Leontief model (with and without correcting for serial correlation) was estimated for
this study and the results were uniformly inferior to a translog specification in terms of statistical
significance and meeting concavity conditions.
3
2
The sample for this study ends at 1996 and uses input price indices from the NBER-CES Manufacturing
Industrial Database. The database was a joint effort between the National Bureau of Economic Research
(NBER) and U.S. Census Bureau's Center for Economic Studies (CES) (available at
/>). A major advantage of the NBER-CES database is that energy
and materials input prices reflect industry specific input mixes. Data on payroll, cost of material, energy,
and real capital stock are for paper and paperboard sub-sectors with 2621 and 2631 as their corresponding
SIC codes. Similarly, the NBER-CES weighted energy and material input deflators are calculated
specifically for each four-digit SIC sector, which take into account varying proportions of the inputs
employed in paper and paperboard mills. These input deflators, however, are available only through 1996.
3
In addition to the translog (TL) and GL models, other flexible form models include the generalized Cobb-
Douglas (GCD), the symmetric generalized McFadden (which is comparable to the GL functional form
(McFadden (1978)), and the normalized quadratic (NQ) functional form. The results of several assessment
studies are mixed. In their study of the TL, GL, and GCD, Guilkey, Lovell, and Sickles (1983) concluded
that the TL model was a ‘dependable approximation to reality provided that reality is not too complex’ (p.
5
Analyzing an industry’s cost function provides information on various production and
cost characteristics, including scale economies, input demands, substitution elasticities, and
measures of average and marginal cost.
4
Such traditional or smokestack industries as paper and
paperboard are capital intensive and unable to immediately adjust their levels of capital stock.
5
Short-term changes in output primarily occur through changes in variable inputs including labor,
energy, and materials. For this analysis we assume that capital K is quasi-fixed so that the
interpretation of scale economies is more appropriately associated with capital stock utilization.
Derived from a Taylor series approximation around the industry’s sample mean, the short run
translog cost function for this analysis is:
0
1
222
11
1
ln (ln ln ) (ln ln ) (ln ln ) (ln ln )
11 11
(ln ln ) (ln ln ) (ln ln ) (ln ln )(ln ln )
22 22
(ln ln )(ln ln ) (l
jt
n
tqt kt t iitit
i
nn
qq t kk t tt ij it it jt
ij
nn
iq it it t ik
ii
VC Q Q K K T T P P
QQ K K TT P PP P
PPQQ
=
==
=
=β +β − +β − +β − + β −
+β − +β − +β − + β − −
+β − − + β
∑
∑∑
∑∑
n ln )(ln ln ) (ln ln )(ln ln ),
it it t qk t t
PPKK QQKK−−+β−−
(1)
where VC
t
is the industry’s variable cost of producing output Q
t
at time t, P
it
(i = 1, … , i) is the
price of the i
th
input at time T, and K
t
is the quasi-fixed level of capital at time t. T is a time index
614), that, as noted in the text, the alternatives were no more reliable relative to a TL specification, and the
GL model was a ‘distant third’ (p. 614), except in cases characterized by small and positive elasticities of
substitution. In an analysis of dynamic factor demands, rather than focusing on regions where functional
forms are well behaved (the outer domain), Despotakis (1986) focuses on the inner domain, subregions of
the outer domain that provide ‘good approximations’ of the true technology. In his (with correction by
Kittelsen, 1989) analysis of a 3 input constant returns to scale technology, he finds that the TL model is less
sensitive than GL to starting point values of elasticities of substitution but that differences in the economic
performance of alternative models can be large. And in evaluating these models for use in applied general
equilibrium analysis, Perroni and Rutherford (1998) find that TL, GL, and the NQ all tend towards failing
concavity conditions when cross price elasticities are large and, collectively, perform poorer than globally
regular functions. In an analysis of dynamic factor demands, Mahmoud, Robb, and Scarth (1987) argue for
a GL over a NQ because the normalized factor demand in the NQ depends on a different set of variables
than those for other variable inputs. In addition, an advantage of the GL form for short run analysis is that
one can analytically compute the equilibrium level of the quasi-fixed factor (Morrison, 1988).
4
Shephard (1970) theoretically demonstrated that under the assumption of exogenously-determined output
levels and input prices there exists a unique relationship between an industry’s production and cost
functions.
5
Construction time of a new paper machine is 18-20 months (Diesen, 1998, p. 127).
6
which captures shifts in the cost function due to technological progress in the industry.
6
The bar
over a variable indicates a variable’s mean value.
To be well-behaved, a cost function with a quasi-fixed factor must satisfy several
conditions: (a) linear homogeneity in factor prices and (b) symmetry in factor prices, (c)
monotonicity and (d) concavity.
7
A cost function is homogenous of degree one in prices when a
given change in prices results in a proportionate change in total costs, all else equal. The
following restrictions ensure that the cost function satisfies these properties:
,1
1
∑
=
=
n
i
i
β
0
1111
∑∑∑∑
====
===
n
i
n
j
ij
n
j
ji
n
i
ij
βββ
(2)
∑
=
=
n
i
iq
1
0
β
;
∑
=
=
n
i
ik
1
0
β
;
∑
=
=
n
i
it
1
0
β
. (3)
The symmetry restriction requires that β
ij
= β
ji
. Under monotonicity input shares have positive
signs at all observations and under concavity the matrix of substitution elasticities is negative
semidefinite for any combination of cost shares.
8
The translog cost function in (1) imposes no a priori restrictions on input substitution
possibilities and allows for scale economies to vary with output and for input shares to vary with
time. Further, by differentiating the cost function with respect to factor prices (Shephard, 1970)
one can get cost share equations S
i
’s for each of the i inputs in the total variable cost:
).KlnK(ln)QlnQ(ln)PlnP(ln
2
1
S
tiktiqjtjt
n
1i
ijii
−+−+−
∑
+=
=
ββββ
(4)
Allen-Uzawa (Allen 1938, Uzawa 1962) and Morishima partial substitution elasticities,
A
U
ij
σ and
M
ij
σ
,
provide two alternative measures of substitution between factor inputs. Based upon
estimated factor shares S
i
and price elasticities of demand η
ij
, the Allen-Uzawa elasticities are one
6
Significant technological improvements in paper industry are typically achieved through changes in speed
and capacity-handling of paper/paperboard machines. For example, in 1955 the maximum speed on a new
newsprint machine was 400 meters/minute. In 1995, speed on new newsprint machines was 1,600
meters/minute, a fourfold increase (Diesen, 1998, p. 145).
7
Berndt and Wood (1975), Christensen, Jorgenson, and Lau (1975), and Caves et al. (2002).
8
A cost function satisfies monotonicity when it is non-decreasing in factor prices. A symmetric matrix is
negative semidefinite if all characteristic roots are nonpositive (Greene, 2000, p. 47).
7
factor - one price measures, reflecting the impact on the use of factor x
i
due to an increase in the
price of factor x
j
, all else constant:
()/
AU
ij ij i j i j
SS SSσ=β+ =
ij
AU
ij
j
S
η
σ= (5)
An alternative to Allen-Uzawa is Morishima’s measure of substitution between inputs, a two
factor - one price measure, which more closely reflects substitutability between inputs. In
response to a factor price increase, Morishima’s measure gives the impact on the input ratio:
ln( / )
ij
M
ij ij jj
j
x
x
P
∂
σ=η−η=
∂
, (6)
where P
j
is the price of factor j (Chambers, 1988). In contrast to Allen-Uzawa, the Morishima
measure is not sign symmetric. Also, although Allen-Uzawa substitutes are Morishima
substitutes, two factors may be Allen-Uzawa complements but Morishima substitutes. Both
measures are reported in this paper.
When factors of production are difficult to adjust, the standard formula for calculating
returns to scale must be adapted to account for these quasi-fixed factors. Caves et al. (2002)
demonstrate that for the single output case, returns to scale at time t are:
ES
t
=
t
t
t
t
K
VC
K
VC
ln
ln
ln
ln
1
∂
∂
⎟
⎟
⎠
⎞
⎜
⎜
⎝
⎛
∂
∂
−
=
.
)ln(ln)ln(ln)ln(ln(
)ln(ln)ln(ln)ln(ln)ln(ln1
tit
n
i
iqtqktqqq
tit
n
i
iktqktkktk
PPKKQQ
PPQQKKQQ
−+−+−+
⎟
⎠
⎞
⎜
⎝
⎛
−+−+−+−−
∑
∑
ββββ
ββββ
Note that at mean values of production, capital, and input prices, ES
t
is simply (1/
β
q
). Finally, the
translog cost function enables one to incorporate technological change and its effects on input
factors. For this study, β
t
and β
tt
identify shifts in the cost function, with positive (or negative)
values for β
it
indicating increases (or decreases) in the shares of the respective factor.
8
III. Estimation Considerations
Let Y
t
be a (n x 1) vector of variable production costs and input cost shares, X
t
is a (n x m)
matrix that includes output Q, capital stock K, input prices P
i
, and year t, and u
t
is a (n x 1) vector
of disturbance terms. Following Berndt (1991), we specify the seemingly unrelated regression
(SUR) equation system as:
,uXY
ttt
+=
β
(10)
where
t is time and
,eRuu
ttt
+=
−1
(11)
which controls for 1
st
order serial correlation. R is a (n x n) autocovariance matrix and e
t
is vector
of disturbances with mean zero and constant variance. Lagging equation (10), premultiplying by
R, and subtracting from Y
t
yields:
.e)RXX(RYY
ttitt
+
+=
−−
β
11
(12)
To estimate the model using maximum likelihood (12), one of the share equations is dropped.
Berndt and Savin (1975) demonstrate that the resulting parameter estimates will be invariant to
the equation dropped if
R is diagonal and its diagonal elements are equal.
Further, the statistical procedure enables us to test various hypotheses related to the
production technology that underlies the cost function. Specifically, adding restrictions (13)
through (16) to restrictions (2) and (3) enables one to test, respectively, for homotheticity (13),
0=
iq
β
(13)
0=
iq
β
, 0=
β
(14)
0=
iq
β
, 0=
β
, 0=
ij
β
, (15)
0=
iq
β
, 0=
β
, 0=
ij
β
, and 1
=
q
β
(16)
homogeneity (14), unitary elasticity of substitution (15), and constant returns to scale (16).
Finally, the usual measure of goodness of fit,
R
2
, is not appropriate for the system of
equations. Berndt and Khaled (1979) propose a “generalized
R
2
” or pseudo R
2
:
9
]},/)(2exp[1{
~
2
TLLR
unr
−−= (17)
where
L
r
and L
un
is the log-likelihood ratio from the restricted and unrestricted models,
respectively, and
T is the total number of observations. This analysis uses a likelihood-ratio test
statistic
)
~
1ln(
22
RT −−=
χ
to test the hypotheses embodied in equations (13) – (16).
IV. Data
Table 1 presents descriptive statistics for the U.S. paper and paperboard output and production
costs for a 32-year period from 1965 to 1996. The American Forest and Paper Association
(AF&PA) 2003 Statistics provided data on paper and paperboard output, which averaged 66,390
thousand short
Table 1
Descriptive Statistics
Variable N Mean
Standard
Deviation
Real Ouput Thousand Short Tons 32 66,390 14,183
Total Short-Run Cost Millions Current Dollars 32 21,666 12,258
Cost of Materials Millions Current Dollars 32 13,346 7,948
Real Capital Stock Millions of 1987 Dollars 32 200 63
Fringle Benefits Percentage of Total Compensation 32 0.15 0.03
Payroll without Fringe Millions Current Dollars 32 1,615 9,862
Payroll with Fringe Millions Current Dollars 32 5,519 2,842
Energy Costs Millions Current Dollars 32 2,801 1,634
Share of Materials Input Cost of Materials / Short-run Costs 32 0.61 0.02
Share of Labor Input Payroll with Fringe / Short-run Costs 32 0.27 0.03
Share of Energy Input Energy Input / Short-run Costs 32 0.12 0.03
Price for Materials Weighted Price Deflator, 1965=100 32 295 139
Price for Labor Payroll with Fringe / Employment, 1965=100 32 370 207
Price for Energy Weighted Price Deflator, 1965=100 32 435 240
Authors’ calculations.
tons over the sample period. 1975 and 1982 are years of sharp drops in output – 14% and 5% in
comparison to the previous year, respectively.
10
Short run variable costs, which include labor, energy and the cost of materials, and input
cost shares are calculated using data from the NBER-CES Manufacturing Industry Database
(Bartlesman, Becker, and Gray, 2000). In order to better reflect total compensation to labor, we
supplemented the NBER payroll data with fringe benefits using the share of fringe benefits
implicit in the Bureau of Economic Analysis (BEA) labor compensation data.
9
Based on the BEA
data, Paper and Allied (SIC 26) industries exhibit a steady increase in fringe benefits, from 9%
($152.7 million) in 1965 to 18% ($1,699.8 million) in 1994, and 17% ($1,663.9 million) in 1996.
Actual labor share decreases from 30% of total short-run costs in the 1960s to about 20% in 1996.
Similar to other cost studies, dividing total compensation by total employment in paper and
paperboard sub-industries is a proxy for the price of labor.
Materials costs, consisting of roughly 40% of pulpwood for paperboard and 20% for
paper production, present the highest share of short run costs for the industry and exhibit the
highest growth rates.
10
Actual shares of materials costs are relatively constant at 60% of total
short-run costs, but increase to 70% in 1996. In nominal terms, materials costs grew from $3 to
9
The share of fringe benefits was calculated as the percentage of total labor compensation. In contrast to
the NBER-CES payroll information, the BEA labor compensation series includes fringe benefits but covers
the entire Paper and Allied Products industry, i.e. a more aggregated two-digit SIC industry (SIC 26). Also,
the BEA paper industry mix changes twice, once in 1987 and again in 1997 when the NAICS system
replaces the SIC industry re-numeration system. Hence due to potential data mismatching, using the BEA
data on total compensation was not desirable. The BEA data are available from its website on Industry,
Annual Industry Accounts, GDP by Industry ( />).
10
Material input mix also differs by type of paper produced. For instance, the single largest input (up to
40%) for paperboard production is pulpwood, while paper production uses pulpwood, chemicals, and
woodpulp in approximately equal shares of about 20% with the woodpulp portion declining through the
1980s and 1990s. Such variation in material composition among grades presents difficulties in constructing
appropriate materials price proxies. Earlier studies employ a variety of approaches to accomplish the task.
Stier (1985) constructs the proxy by weighting the prices of southern pine, northern hardwood and northern
softwood pulpwood according to the weights that reflect the share of each group in total production. This
approach appears as the most comprehensive and was attainable for the studied period (1948-1972) given
the availability of annual data on pulpwood usage. Eckstein and Wyss (1972), Strazheim and Strazheim
(1976), and Chung (1979) choose a lumber price index as a proxy for the price of materials. Boungiorno,
Farimani, and Chuang (1983) argue that paper mills use lumber, or more accurately lumber residues, to a
very limited extent and its price index is not representative of materials input prices for paper production.
By the same token we argue that a woodpulp index is unsuitable for paperboard cost function as it
constitutes only 1-2% of total material input costs for paperboard production. As discussed in footnote 2,
this paper uses the NBER-CES material cost price deflator because it incorporates material input mixes
specific to paper and paperboard sectors.
11
$26.5 billion dollars.
11
Actual average cost shares for energy are around 12% but markedly
increase after 1973, peaking to about 18% in the early 1980s, falling back to the 10% level by the
end of the 1990s. Despite the oil shocks of the 1970s-1980s, nominal energy costs remained
relatively flat.
12
Material and energy prices are approximated by relevant NBER deflators which
take into account industry-specific input mixes.
13
Total short-run nominal costs grew from $5.23 billion in 1965 to $41.06 billion in 1995,
reflecting an annual average increase equal to 21.4%. The largest increases in operating costs
occurred after the two oil shocks in the 1970s. Operating costs increased 15% and 30% in 1972
and 1973 and 16% in 1979 and again in 1980.
14
V. Estimation Results
Table 2 presents the results for estimating equations (1) and (4) subject to the conditions
in equations (2)-(3) and (13)-(16). Following Lau and Tamura (1972), who argue that output
exogeneity is a reasonable assumption for large capital intensive manufacturing facilities that
produce intermediate goods as inputs to other production activities and that have long term supply
agreements, this analysis assumes that paper and paperboard output is exogenous. In addition, in
order to avoid potential problems associated with price endogeneity, price lagged one year is
included as an instrumental variable for each of the input prices.
15
11
In real terms, the increase is from $3 to $6 billion (1965) dollars.
12
Similar to material costs, industry-specific energy consumption patterns and volatile energy markets
complicate obtaining appropriate proxies for energy input prices. According to the AF&PA 2003 Statistics,
over the 20-year period the shares of energy inputs have steadily increased with the exception of residual
fuel oil, which dropped from over 40% in the early 1970s to only about 13% in the 1990s. In 1996, the
three top energy sources for the industry were natural gas, coal, and electricity with 40%, 28%, and 14%
shares. 1965-1996 marks the period of high volatility in energy prices with especially dramatic increases in
the mid-1980s. Finally, AF&PA 2003 Statistics also report that the share of purchased energy decreased
from 60% to 45% during 1972-1996 with the rest generated internally at the mills. As with material input
prices, we selected the industry-specific and weighted energy deflator from the NBER-CES database.
13
All factor prices are normalized to 1965.
14
Real operating costs increased on average 1% per year. The largest drop, at 15%, mirrored the 1975 drop
in nominal costs and the largest increases in real costs, at 9%, occurred in 1976 and 1984.
15
To assess whether the results were robust to price indices, the model was also estimated using more
aggregated input price indices, i.e. indices that do not reflect industry-specific input mixes. Consistent with
expectations, the results led to an inferior fit. The log-likelihood at convergence was lower (277.27 versus
12
Table 2
Translog Cost Function – Parameter Estimates
Standard
Parameter Estimate Error t Value Pr > |t|
β
0
9.991 0.058 172.26 <.0001
β
q
0.818 0.510 1.61 0.125
β
k
0.203 0.395 0.52 0.612
β
l
0.267 0.013 21.25 <.0001
β
e
0.128 0.012 11.17 <.0001
β
-1.652 2.225 -0.74 0.467
β
kk
-0.706 0.771 -0.91 0.372
β
ll
0.131 0.020 6.41 <.0001
β
ee
0.069 0.047 1.48 0.151
β
qk
0.411 1.296 0.32 0.755
β
lq
-0.121 0.110 -1.11 0.280
β
lk
-0.008 0.082 -0.1 0.921
β
eq
-0.047 0.108 -0.43 0.669
β
ek
0.060 0.080 0.75 0.461
β
le
-0.038 0.012 -3.12 0.004
β
t
-0.306 0.112 -2.73 0.013
β
tt
-0.111 0.025 -4.35 0.000
ρ
1
0.679 0.255 2.67 0.013
2
~
R
= .9857
Number of Observations: 32
Log-likelihood at convergence: 298.132
______________________________________________________________
Authors’ calculations.
The overall fit of the model is good with a system
2
~
R
equal to 0.9857 indicating that the
model explains 98.5% of the system wide variance.
16
In addition, the estimated cost function
satisfies the monotonicity and concavity conditions. For monotonicity, the cost function must be
nondecreasing in input prices, which requires that the fitted shares be positive at each
observation. For the reported model, the fitted shares are non-negative at all points, are highly
correlated with the actual shares, and (necessarily) sum up to one. Concavity requires that the
298.13) and fewer variables were statistically significant. In addition, the Allen-Uzawa own elasticity of
substitution for labor was half the value reported in Table 4(a) and more than twice the value for energy.
There were also large differences in the elasticities of demand for labor and energy.
16
Normality tests on the residuals produced mixed results. The Shapiro-Wilk W univariate test rejected the
null hypothesis of normality for the cost and labor share equation but could not reject the null for the
energy share equation. In contrast, the Henze-Zirkler T multivariate (system) normality test could not reject
the null hypothesis of normality (Henze and Zirkler, 1990).
13
matrix of substitution elasticities, which are based on the fitted factor shares, is negative semi-
definite and this condition is also satisfied at all points in the sample.
Adjusting for serial correlation, the model’s parameters are invariant to the equation
dropped if the autocorrelation coefficient is restricted to be equal across share equations. From
Table 2, we see that the estimated autocorrelation coefficient is 0.679 and rejects the null
hypothesis of no serial correlation at the 0.025 level.
From the descriptive statistics, mean industry production throughout the sample period
was 66.4 million short tons at a mean cost of $21.6 billion (current dollars). The first order
coefficients for labor and energy,
β
l
and
β
e
, respectively, are significant at a 0.01 level and
indicate that, at mean production, labor and energy comprised 26.7% and 12.8% of production
costs, consistent with the mean values presented in Table 1.
17
And the linear homogeneity
restriction implies that materials comprise 60.5% (1 –
β
l
–
β
e
) of operating costs at mean
production. Also at mean production, estimated short run costs are $21.5 billion, less than 1/2%
difference from the actual costs reported in Table 1. An analysis of fitted shares and costs found
that the fitted input shares generally tracked the actual shares well, particularly for materials.
Fitted energy shares tended to underestimate actual shares until 1987 when fitted shares were
consistently greater than actual shares. Actual and fitted short run costs track well, with a 0.993
correlation coefficient and a root mean square error equal to 0.069.
V.1 Returns to Capital Utilization
The first order coefficient for output,
β
q
, is 0.818 and significant at a 0.12 level on a two-
sided test.
18
Given that capital is a fixed factor of production, a value of
β
q
that is less than 1
indicates that the paper and paperboard industry is operating under increasing returns to capital
utilization. At mean production, a 1% increase in output leads to a 0.818% increase in short run
17
The maximum likelihood parameter estimates presented in Table 2 normalize on materials input shares.
18
Theoretically, an increase in output increases costs justifying a one-sided test. On this basis, the
coefficient for output is significant at a 0.062 level.
14
costs, implying returns to capital utilization equal to (1/
β
q
) = 1.22. However, the test statistic for
the null hypothesis that
β
q
= 1 is
q
ˆ
q
ˆ
)1
ˆ
(
β
σ−β
= (0.818 – 1)/0.51 = -0.364, that is, we cannot reject
the null hypothesis that, at mean production, inputs, and quasi-fixed factor, the industry in the
United States operated under constant returns to capital stock utilization.
Further, at mean production, the coefficient for capital is positive (0.203) but we cannot
reject the null hypothesis that the coefficient is zero at any reasonable level of significance. This
suggests that capital stock increases had relatively little impact on short run operating costs. With
large fixed costs, capital intensive industries have strong economic incentives to operate their
capital at full capacity (capital utilization percentage generally ranges from the upper 80’s to
lower 90’s) and these results are consistent with an industry whose scale of operations is
sufficiently large that further capital investments have little impact upon operating costs.
19
V.2 Technological Change
The estimated model reported in Table 2 also includes time in order to capture
technological and other time-related changes that have occurred in the paper and paperboard
industry throughout the sample period. Based upon preliminary work, the best model included (ln
T) and (ln T )
2
as explanatory variables. The estimated coefficient for the level and squared
specification is significant at the 0.025 and 0.01 levels, respectively. The results suggest that
technological progress generated a very modest 0.02% annual reduction in short run operating
costs.
20
19
Also consistent with this result is that capital investment and changes in real capital stock often reflect
machine rebuilds rather than new capacity.
20
From (1), the elasticity of short run costs with respect to time is ( / )(ln ln )
ttt
TT Tβ+β − . Evaluating the
time index t, which runs from 1 through 32, at its mean of 16.5, substituting the estimated coefficients for
β
t
and
β
tt
, calculating the elasticity for each observation and taking the mean gives 0.02. Various
specifications for technology change were estimated, including ln T and (ln T)
2
without normalizing at the
mean and T and T
2
, with and without normalizing at the mean. The reported model was uniformly superior
to these specifications. Also, models which accommodated factor augmentation for the variable and quasi-
fixed factor of production were estimated. In these alternative models, the time variables were either not
15
V.3 Tests on Properties of the Production Function
Table 3 reports results for testing more restrictive forms of the cost function and
underlying production technology. To test for homotheticity, set all coefficients of the cross terms
Table 3
Hypotheses # Restrictions
χ
2
value
p-value
Homotheticity (equation 13) 2 8.58 0.0190
Homotheticity and output homogeneity,
degree (1/β
q
) (equation 14)
3 15.86 < 0.01
Homotheticity and output homogeneity,
degree 1 (equation 15)
4 44.56 < 0.01
Cobb-Douglas (equation 16) 5 47.55 < 0.01
___________________________________________________________________________
Authors’ calculations.
between input prices and output equal to 0, i.e.
β
iq
(i = 1, …, n) = 0. If, in addition,
β
= 0, then
the cost function is homothetic and homogeneous in output of constant degree (1/
β
q
). And
restricting
β
q
to 1 yields a homothetic and homogeneous function with constant returns to scale.
Further restricting the cross price terms to 0, i.e.
β
ij
(i, j = 1, …, n; i ≠ j) = 0, gives a Cobb-
Douglas specification under constant returns to scale. Based upon a likelihood ratio test (equation
18), the results reject the null hypothesis in each case at a 0.05 critical value, indicating that the
underlying production technology in the paper and paperboard industry is neither homogeneous
nor homothetic. However, using a more restrictive 0.01 level, the null hypothesis for
homotheticity is accepted, providing some evidence that output can be increased at constant input
ratios. Also, given the reported test results for homotheticity and output homogeneity, it is not
surprising that the estimation results also reject a Cobb-Douglas technology.
significant or less significant, not all observations satisfied concavity conditions, and none of the biased
technology coefficients were significant.
16
V.4 Substitution and Demand Elasticities
Table 4(a) and 4(b) report the Allen-Uzawa and Morishima elasticities of substitution.
From Table 4(a) we see that materials input is a substitute for labor and energy in the production
of paper and paperboard. Further, the extent of substitutability is similar as reflected in the
Table 4
Elasticity of Substitution Measures
____________________________________________________________________________
(a) Allen-Uzawa
a
A
U
ll
σ -0.894
A
U
le
σ -0.236
A
U
ee
σ -2.175
A
U
lm
σ 0.429
A
U
em
σ 0.561
A
U
mm
σ -0.304
(b) Morishima
a
M
ll
σ 0.0
M
el
σ
0.215
M
ml
σ
0.529
M
le
σ 0.252
M
ee
σ
0.0
M
me
σ
0.620
M
lm
σ 0.449
M
em
σ
0.529
M
mm
σ 0.0
____________________________________________________________________________
Authors’ calculations.
a
ij
AU
ij
j
S
η
σ=
,
M
ij ij jj
σ=η−η
where η
ij
is the input (cross) price elasticity of demand and S
j
is input j’s
cost share. Each measure approximates the percentage change in the marginal rate of substitution resulting
from a 1% increase in input price ratio.
()
A
UM
ij ij
σσ
is a one (two) factor - one price measure.
quantitative estimates at mean production. In both cases, a 1% increase in the relative price of
labor and energy, respectively, increases the relative productivity of materials on the order of
0.4% - 0.5%.
21
Energy, on the other hand, is complementary to labor in the production process.
All else constant, a 1% increase in the price of labor relative to the price of energy generates a
0.23% reduction in the relative productivity of energy.
Table 4(b) presents the Morishima elasticity of substitution estimates which, with one
exception, are generally consistent with the Allen-Uzawa measures. Labor-materials and energy-
21
This interpretation assumes that input markets are competitive.
17
materials are substitutes in production, and materials use is more sensitive to the price of labor
and price of energy, respectively, than the reverse (0.529 versus 0.449 for labor; 0.620 versus
0.529 for energy). However, labor and energy are Allen-Uzawa complements but Morishima
substitutes in production. From equations (5) and (6), the substitute relationship reported in Table
4(b) indicates that with an increase in the price of labor (energy), labor (energy) use falls more
quickly than energy (labor) use resulting in an increase in the labor-energy (energy-labor) input
ratio, that is, raising the input price increases the relative use of the other input consistent with a
substitution relationship. Because the Morishima measure is not symmetric and accounts for
changes in both factors from the input price change, the resulting elasticities provide additional
insights into the production relationship between factors.
Table 5 reports the estimated input own and cross price elasticities with industry demand
most sensitive to energy prices. A 10% increase in energy prices reduces industry demand by a
__________________________________________________________________________
Table 5
Own and Cross Price Elasticities
Standard Range
Mean
Deviation Min, Max
η
ll
-0.239 0.018 -0.267, -0.216
η
ee
-0.277 0.118 -0.406, -0.063
η
mm
-0.186 0.007 -0.200, -0.168
η
le
-0.024 0.015 -0.047, 0.005
η
lm
0.263 0.030 0.220, 0.319
η
em
0.343 0.062 0.233, 0.401
__________________________________________________________________________
Authors’ calculations.
bit less than 3%. Demand for labor is less sensitive to changes in materials prices
(η
labor, materials
= 0.263) than is the demand for energy (η
energy, materials
= 0.343). In contrast, and
consistent with the Allen-Uzawa results, labor and energy are complements in production with a
cross price elasticity, η
labor, energy
, equal to -0.024. Over the sample period, the own price elasticity
for labor and materials remained relatively stable, varying between (-0.27, -0.22) and
18
(-0.19, -0.17) respectively. Whereas energy was relatively price inelastic in the early part of the
sample, during the oil price shocks of the 1970s, there was a dramatic and permanent increase, in
absolute value, in the own price elasticity of demand, reflected in Table 5 by a large range and a
standard deviation which is at least an order of magnitude larger than that for labor and materials.
In the last year of the sample, the own price elasticity for energy was double its value in 1965.
The cross price elasticity between labor and energy moved within a relatively small
range, (-0.047, 0.005). Although for most of the period, and at mean production, labor and energy
were complements, they were substitutes in production for the years 1982, 1983, and 1985. Labor
was consistently a substitute for materials with relatively little absolute variation, ranging
between 0.22 and 0.32.
22
In contrast, there was greater movement in the cross price elasticity
between energy and materials, with a (0.23, 0.40) range and increasing from 0.25 in 1965 to 0.40
in 1981 and remaining just below that level for the rest of the sample period.
V.5 Industry Operating Profits
At the sample mean, the average cost of production was 0.301 million, significantly
above the estimated marginal cost at 0.230 million. As a result of increasing competition from
Europe, South America, and Asia, the U.S. paper and paperboard industry struggled throughout
this period, particularly since the 1980s. Historically, the U.S. industry has not enjoyed significant
pricing power and the increased competition from abroad reinforces the competitive environment
that the U.S. industry faces. In the absence of pricing power, profit maximization implies
22
From Tables 4 and 5, labor and materials are consistently substitutes in production. To understand this,
grades produced (e.g. coated and uncoated groundwood, coated and uncoated freesheet, tissue and sanitary,
unbleached kraft, recycled paperboard, solid bleached paperboard) reflect different types and levels of
materials (e.g. hardwoods, softwoods, chlorine, lime, sodium hydroxide) used in pulping and papermaking
processes. Different grades have different implications for the amounts of employed labor and materials
implying trade-offs between the inputs. To illustrate, using indices of hours worked and non-energy
materials inputs in paper and allied products (SIC 26), non-energy materials per hour worked was regressed
on the annual capacity shares of newsprint, groundwood, coated freesheet, uncoated freesheet, tissue and
paper, other recycled paperboard, and solid bleached paperboard for the period 1970-2000. Relative to the
capacity shares of other products, an increase in the share of all but coated and uncoated freesheet reduced
materials per labor hour required. Coated freesheet was not significant at a .05 level and uncoated freesheet
significantly increased materials per hour worked.
19
marginal cost pricing. And the results of this analysis suggest that marginal cost pricing will not
cover operating costs let alone the industry’s total costs of production.
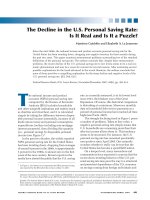
Figure 1 depicts the estimated marginal and average operating costs for the paper and
paperboard industry during the sample period. Through 1982, average and marginal costs were
Figure 1
Paper and Paperboard Operating Costs, 1965 - 1996
reasonably close. However, after 1982 the industry’s average operating costs were significantly
above its marginal cost of production. Consistent with Bernstein’s (1992), Christensen and
Caves’ (1997), and Pesendorfer’s (2003) findings of competitive pricing, this suggests that
industry pricing generated a return on investment that was insufficient to cover its cost of capital.
For the period 1985 – 1996, the estimated average cost of production was 0.419, 72% higher than
the estimated marginal cost at 0.244. This difference seems to have been apparent to the industry
as the 1980s were a period of significant merger activity, industry consolidation (Pesendorfer,
2003), and, relative to the 1970s, lower capacity growth.
VI. Summary and Conclusions
In order to better understand the production and cost characteristics of the U.S. paper and
paperboard industry in a competitive environment that has changed significantly, this paper
20
presents new estimates for the industry’s short run operating costs. The results indicate that the
industry operates at constant or slightly increasing returns to capacity utilization, similar to
Bernstein (1992), and are consistent with an environment of competitive pricing, as found in
Bernstein (1992) and Christensen and Caves (1997). And notwithstanding significant
consolidation in the mid-1980s, industry’s attempt to ‘get control’ of its capacity and pricing was
unsuccessful, which is consistent with the generally failing economic health of the industry.
Between 1975 and 2002, the North American industry earned an average 6.7% return on total
capital in comparison with a 11% average cost of capital during this period.
23
. The results also
identified large volatility in the own price elasticity of energy during the 1970s oil crises, which
has direct relevance in today’s environment where the price of oil has increased from $60 a barrel
in the early part of 2007 to $140 a barrel in summer 2008.
There are a number of extensions to this work. Although the paper and paperboard
industry is often identified as relatively homogeneous, there are differences among industry sub-
sectors. Analyses of these product categories (e.g. wrapping and packaging, newsprint, printing
and writing papers, and household and sanitary papers) would improve our understanding of the
competitive differences among these groups and this could help explain differences in the
economic performance and growth of the industry. Second, this study focused on the industry’s
short run production and cost characteristics and a natural extension would explore long run
production and cost to determine where on the long run average cost curve a ‘representative’ firm
in the industry operates. A third area of future research relates to globalization and its affect on
industry cost structures. Although interpreted as technological progress, the time variable also
reflects other significant developments that have occurred over time including globalization and
increasing competition from abroad.
23
McNutt, J. A. 'State of the North American (and Maine) Pulp and Paper Industry', in, Maine Pulp and
Paper Industry Foundation, 2003.
21
References
Aiginger, K. and Pfaffermayr, M. (1997), “Looking at the Cost Side of ‘Monopoly’”, Journal of
Industrial Economics
XLV, 245-267.
Allen, R. G. D. (1938),
Mathematical Analysis for Economists, London: MacMillan.
American Forest and Paper Association (AF&PA) 2003 Statistics
Bartelsman, E., Becker, R. and Gray, W. (2000), NBER-CES Manufacturing Industry Database,
/>.
Berndt, E. R. (1991),
The Practice of Econometrics: Classic and Contemporary, Reading, Mass.;
Tokyo; Wokingham, U.K. and Sydney: Addison-Wesley.
Berndt, E. R., and Khaled, M. S. (1979), "Parametric Productivity Measurement and Choice
among Flexible Functional Forms”,
Journal of Political Economy, 87, 1220-1245.
Berndt, E. R., and Savin, N. E. (1975), "Estimation and Hypothesis Testing in Singular Equation
Systems with Autoregressive Disturbances”,
Econometrica, 43, 937-957.
Berndt, E. R., and Wood, D. O. (1975), "Technology, Prices, and the Derived Demand for
Energy”,
Review of Economics and Statistics, 57, 259-268.
Bernstein, J. (1992), “Price Margins and Capital Adjustment: Canadian Mill Products and Pulp
and Paper Industries”,
International Journal of Industrial Organization, 19, 491-510.
Buongiorno, J., Farimani, M., and Chuang, W. (1983), "Econometric Model of Price Formation
in the United States Paper and Paperboard Industry”,
Wood and Fiber Science, 15, 349-363.
Bureau of Labor Statistics, Major Sector Multifactor Productivity Indices, Paper Products
Industry, />.
Caves, D. W., Christensen, L. R., Swanson, J. A., Nash, C. e., and et al. (2002),
Productivity in
U.S. Railroads, 1951-1974
(Vol. 3: Classics in Transport Analysis), Cheltenham, U.K. and
Northampton, Mass.: Elgar; distributed by American International Distribution Corporation,
Williston, Vt.
Chambers, R. (1988),
Applied Production Analysis, Cambridge: Cambridge University Press.
Chas-Amil, M. L., and Buongiorno, J. (1999), "Determinants of Prices of Paper and Paperboard
in the European Union from 1969 to 1992”,
Journal of Forest Economics, 5, 7-22.
Christensen, L. R. and Caves, R. (1997), "Cheap Talk and Investment Rivalry in the Pulp and
Paper Industry”,
Journal of Industrial Economics XLV, 47-73.
Christensen, L. R., Jorgenson, D. W., and Lau, L. J. (1975), "Transcendental Logarithmic Utility
Functions”,
American Economic Review, 65, 367.
Chung, J. W. (1979), "The Effects of Material Costs on Inflation”,
Applied Economics, 271-287.
22
Despotakis, K. (1986), “Economic Performance of Flexible Functional Forms: Implications for
Equilibrium Modeling”,
European Economic Review 30, 1107-1143.
Diesen, M. (1998),
Economics of Pulp and Paper Industry, eds. J. Gullichsen and H. Paulapuro,
Helsinki, Finland: Fapet Oy.
Eckstein, O., and Wyss, D. (1972), "Industry Price Equations”, in
The Econometrics of Price
Determination
, ed. O. Eckstein, Washington D.C.: Board of Governors, Federal Reserve System,
pp. 267-286.
Economagic, />
Greene, W. H. (2000),
Econometric Analysis, Upper Saddle River, NJ: Prentice-Hall, Inc.
Guilkey, D., Lovell, K., and Sickles, R. (1983), “A Comparison of the Performance of Three
Flexible Functional Forms”,
International Economic Review 24, 591-616.
Henze, N., and Zirkler, B. (1990), "A Class of Invariant Consistent Tests for Multivariate
Normality”,
Communications in Statistics, Part A - Theory and Methods, 19, 3595-3617.
Ince et al. (2001), United States Paper, Paperboard, and Market Pulp Capacity Trends by Process
and Location 1970-2000. United States Department of Agriculture Forest Service, Forest
Products Laboratory, Research Paper FPL RP 602.
Kittelsen, S. (1989), “Economic Performance of Flexible Functional Forms: A Correction and
Comment”,
European Economic Review 33, 825-838.
Lau, L. J., and Tamura, S. (1972), "Economies of Scale, Technical Progress, and the
Nonhomothetic Leontief Production Function: An Application to the Japanese Petrochemical
Processing Industry”,
Journal of Political Economy, 80, 1167-1187.
Lee, M., and Ma, H. (2001), "Substitution Possibility between Unpriced Pulp and Wastepaper in
the U.S. Paper and Paperboard Industry”,
Environmental and Resource Economics, 18, 251-273.
Mahmoud, S., Robb, A. and Scarth, W. (1987), “On Estimating Dynamic Factor Demands”,
Journal of Applied Econometrics 2, 69-75.
McFadden, D. (1978), “General Linear Profit Function”, in M. Fuss and D. McFadden (eds.),
Production Economic: A Dual Approach to Theory and Applications, Volume 1, Amsterdam:
North-Holland, 269-86.
McNutt, J. A. (2003), "State of the North American (and Maine) Pulp and Paper Industry”,
Maine
Pulp and Paper Industry Foundation
.
Melendez, M. (2002), "
A Dynamic Model of Vertical Integration for the American Pulp and
Paper Industry
”, Ph.D., Yale University.
Morrison, C.(1988), “Quasi-Fixed Inputs in U.S. and Japanese Manufacturing: A Generalized
Leontief Restricted Cost Function Approach”,
Review of Economics and Statistics 70, 275-87.
23
Ohanian, N. (1994), “Vertical Integration in the U.S. Pulp and Paper Industry, 1900-1940”,
Review of Economics and Statistics 76, 202-207.
Pesendorfer, M. (2003), “Horizontal Mergers in the Paper Industry”,
RAND Journal of
Economics
34, 495-515.
Perroni, C. and Rutherford, T. (1998), “A Comparison of the Performance of Flexible Functional
Forms for Use in Applied General Equilibrium Modelling”,
Computation Economics 11, 245-
263.
Shephard, J. M. (1970), "Functional Specialization, Alienation, and Job Satisfaction”,
Industrial
and Labor Relations Review
, 23, 207-219.
Stier, J. C. (1985), "Implications of Factor Substitution, Economies of Scale and Technological
Change for the Cost of Production in the United States Pulp and Paper Industry”,
Forest science,
803-812.
Strazheim, D. H., and Strazheim, M. R. (1976), "An Econometric Analysis of the Determination
of Prices in Manufacturing Industries”,
Review of Economics & Statistics, 191-201.
U.S. Census Bureau, />.
Uzawa, H. (1962), "Production Functions with Constant Elasticities of Substitution”,
Review of
Economics & Statistics
, 44, 291-299.