PROFITABILITY AND COST MANAGEMENT IN FORMER STATE OWNED ENTERPRISES IN VIETNAM
Bạn đang xem bản rút gọn của tài liệu. Xem và tải ngay bản đầy đủ của tài liệu tại đây (298.61 KB, 25 trang )
1
PROFITABILITY AND COST MANAGEMENT IN
FORMER STATE OWNED ENTERPRISES IN VIETNAM
ABSTRACT
We provide evidence on the impact of privatisation and listing of former state owned enterprises (SOEs) in
Vietnam, by examining changes in the profitability and cost management practices of a sample of former
SOEs now listed on one of the two Vietnamese stock exchanges under the “Doi Moi” reform program. This
evidence contributes to the literature by examining profit makeup at a component level, rather than on the
aggregate basis which has been adopted in prior studies. This allows the development of richer insights
than have previously been possible into the factors contributing to observed changes in post privatisation
profitability.
Keywords: privatisation, Vietnam, state owned enterprises, performance measurement
JEL classification: L33, M48
2
i. INTRODUCTION
It has been argued that the antecedents of the phenomenon which has come to be described as
New Public Management (NPM) lie in conditions of economic and fiscal adversity (Gruening, 2001).
Viewed through this lens, a key goal of new public management reform has been to improve economic
efficiency and thus overall welfare by driving change through the public sector, with the result of leaner,
more competitive, flexible, responsive and transparent government (OECD, 1994).
In advanced jurisdictions characterised by high levels of private sector participation and
integration with the global economy via trade and financing flows, the capacity of governments to wield
strong control over the domestic economy is constrained. Consequently, the focus of much reform activity
lies on that domain capable of being directly and profoundly influenced by government, the public sector
(Lapsley, 2008).
By contrast, many developing economies are characterised by low levels of private sector
participation and weak integration into the global economic system. There, the role of government decision
making and the influence of the state sector are typically more profound, particularly in socialist one party
states (Chu, 2004).
In jurisdictions characterised by relatively low international openness and high state sector
dominance, the impact of public sector reform initiatives has the capacity to be of particular significance.
However, while a wealth of literature focused on the impact and implications of public management reform
in developed economies exists, comparatively little is known about the process and results of public
management reform in lesser developed economies (Pollitt & Bouckaert, 2000).
The literature on public management evidences the application of a wide variety of techniques
towards the end of improving cost effectiveness and efficiency in government, including contracting out,
commercialization, corporatization and privatization. Of these techniques, privatization has been perhaps
most consistently employed throughout the world. Further, there is evidence to the effect that the
application of this technique continues to become more widespread, with much of the growth in the use of
the technique exhibited in emerging and lesser developed economies (Megginson & Netter, 2001).
However, it is in relation to the effect of privatisation in these settings that the extant research
literature is least clear. For example, Boubakri and Cosset (1998) studied a sample of companies from
3
developing countries which underwent full or partial privatization over the period from 1980 to 1992. Their
results suggested that after being privatized, former SOEs increased sales, became more profitable,
increased levels of capital spending, improved operating efficiency levels, had lower debt and increased
dividend payouts.
By contrast, Wei et al (2003) conducted a study of privatized firms in China, covering the period
from 1990 to 1997. Their results suggest that after being privatized, the former state owned enterprises in
their sample did not exhibit improvements in profitability. Studies of privatisation in Latin America (e.g
Galal et al, 1994) and Eastern Europe (e.g Brezis & Schnytzer, 2003) have also thrown up inconsistent and
inconclusive results in relation to the impact of privatisation.
Thus despite the consistent recourse to the notion that privatisation is associated with improved
enterprise efficiency and performance with consequential societal welfare benefits (e.g Bortolotti &
Fantini, 2001) the empirical evidence on the subject is mixed, particularly as regards the experience of
lesser developed and emerging economies.
This paper contributes to the literature on public management reform and privatisation in lesser
developed and emerging economies by providing detailed empirical evidence in relation to changes in post
privatisation profit and cost management performance of a sample of former SOEs in Vietnam. The
methodology employed draws on detailed firm level data, rather than high level aggregate data.
Consequently, the paper contributes insights not only into the post privatisation profitability trajectory of
former SOEs in Vietnam, but importantly, into the behaviour and changes in key profit driver vectors over
the initial post privatisation period.
In pursuing this objective, the remainder of the paper is structured as follows. Section 2 provides
an overview of the background to the embrace of privatisation as an element of reform in Vietnam. Section
3 sets out details of the data drawn upon for the purposes of analysis and the research methodology
employed. Section 4 comprises a discussion and analysis of the results of the study, whilst Section 5 sets
out conclusions and incorporates suggestions for further research.
4
ii. REFORM AND PRIVATISATION IN VIETNAM
In 1954, in the wake of the defeat of French forces at Dien Bien Phu, Vietnam was divided at the
17
th
The stresses already evident by the mid 1970s were compounded by the decision to invade
Cambodia in December 1978 (Vo 1990; Klintworth 1991; Fforde and Vylder 1996; Harvie and Tran 1997;
Chu 2004). Along with the human casualties, the involvement in Cambodia cost substantially more in
financial and material terms than had been anticipated (Klintworth 1991; Harvie and Tran 1997). These
unanticipated costs included the resources necessary for maintaining troops in Cambodia and the need for
parallel. The northern regime, which fell under the Soviet and Chinese sphere of influence, adopted a
single party socialist mode of government, characterised by central planning, collectivization and
nationalization. The southern regime, capitalist and nominally democratic, was a client state of the United
States and its allies (Vo, 1990).
With the defeat of U.S backed forces the south by northern forces in 1975, national reunification
commenced. By late in that year, the united Politburo decided that Vietnam should move directly to the
consistent application of a fully socialist model. Consequently, the centrally-planned economic mechanism
which had previously applied in the North began to be implemented in the South. The task for economic
development in this period was described as "…involving continued socialist construction in the North and
transforming the South's capitalist economy to a socialist one" (Harvie and Tran 1997, p.34). This already
complex task was rendered more difficult by the near collapsed state of the South Vietnamese economy by
1975 (Vo, 1990).
Policy settings adopted in the immediate wake of reunification gave particular prominence to the
ideal of rapid socialization and industrialisation. This soon resulted in the emergence of substantial
distortions in the structure and functioning of the economy (Harvie and Tran 1997). Socialisation of
ownership led directly to diminishing production levels in the agricultural sector. Simultaneously, most
government investment funding was directed to industrial development. Set in the context of very high
population growth rates, episodic food shortages emerged throughout the country (Fforde and Vylder
1996).
5
troop deployments to the northern border region to fight against Chinese forces which invaded as a means
of "punishment" by China in retribution for Vietnam’s decision to invade Cambodia.
Losses also included the loss of substantial foreign aid from the international community as a form
of sanction consequential upon the decision to embark upon the Cambodian campaign (Fforde and Vylder
1996; Harvie and Tran 1997). Vietnam also suffered substantially as a result of the enforcement by the
United States of a trade embargo which prevented Vietnam penetrating into international goods and capital
markets.
The generally weak economic conditions, combined with the impact of a series of material shocks
caused substantial fiscal distress. For example, Vietnam suffered a sharp reduction in foreign loan and aid
funding between 1975 and 1979, with receipts from these sources falling from 60 per cent of total funding
in 1975 to 32 per cent in 1978. Over the same period, domestic source revenues did not grow at anywhere
close to a sufficient pace to close the gap which resulted in the sudden fall in external source revenue
(Harvie and Tran 1997).
This triggered the onset of substantial fiscal stress, a matter of particularly high significance in a
centrally planned economy in which the state plays a highly material role (Fforde and Vylder 1996).
Resource shortages became endemic throughout the economy.
Chronic shortages of resources in turn led economic entities to look for better ways to do business.
This kind of spontaneous bottom-up pressure was described as "fence breaking" or "pha rao" in
Vietnamese. In effect, this represented the emergence of widespread disobedience in the face of
government issued economic edicts. This placed increasing stress on the government to conduct reform to
avoid the collapse of the economy or having its authority substantially undermined (Fforde and Vylder
1996; Harvie and Tran 1997).
Responses to this situation were evident in the edicts of both the Fourth Congress of the
Communist Party of Vietnam (1979) and the Fifth Congress of the Communist Party of Vietnam (1982).
However, the policy responses offered at the conclusion of both of these gatherings were minimalist and
incrementalist in their orientation and had little impact on the worsening economic and fiscal situation (Le,
Doanh D 1991).
6
However, the Communist Party of Vietnam’s Sixth Congress yielded a very different result. At the
conclusion of proceedings, the following assessment of the state of the nation and its prior policy settings
was offered by the Communist Party:
“There has been a lacuna in assessing the economic situation, in determining objectives and
setting the pathway of socialist development. In the five years from 1976 to 1980, we conducted an
industrialization process without the presence of necessary supporting conditions; policy initiatives were
marred by haste, relaxation in the degree of socialist transformation; and inadequate reconfiguration of
obsolete economic mechanism. In a further five-year period from 1981 to 1985 there has been no serious
implementation of the edicts of the Fifth Congress in relation to economic strategy […], new and serious
mistakes have emerged in distribution and trade circulation […] There have been serious mistakes in
guidelines, in macro policies, in steering and in implementation”
1
Undoubtedly, the Sixth Congress marked an important milestone and major turning point in the
history of economic development of Vietnam (Harvie and Tran 1997; Chu 2004). Arguably, the most
important element of the reformist agenda advanced during the sixth congress was the acceptance of non-
socialist economic components besides state and collective ownership (Le, Doanh D 1991; Harvie and Tran
1997).
.
This self-assessment of the Communist Party of Vietnam has been seen as the main achievement
of the Congress (Le, Doanh D 1991). At the congress, a new team of leaders was elected with responsibility
to steer the economy to overcome problems such as chronic food shortages, hyperinflation, and structural
imbalances in the economy.
After the Sixth National Congress a comprehensive reform program, titled "Doi Moi" or
Renovation was introduced. The objectives of this reform program were to liberalize and deregulate the
centrally-planned economic mechanism (Harvie and Tran 1997).
During the congress, the General Secretary of the Communist Party of Vietnam, Truong Chinh,
commented on the problems faced by Vietnam and some of the factors which were perceived to have
caused them, stating that: "… the state apparatus and those of the party and mass organization were left to
grow too big, overlapping and dispersed" (Thayer, 1991, p.24).
1
(Cited from the Resolution of the Sixth Congress: )
7
So much was clearly stated in the Resolution of the Fourth Plenum of December 1987: "The state
encourages and accepts the long-term existence and positive effects of the family, individual and private
economies active in production and services; it guarantees the rights to property, to inherit and to legal
income for people active in these sectors; it accepts their legal incorporation/identity and equality before
the law in their production and business activities" (cited from Harvie and Tran (1997, p.49)).
Thus, the decisions of the Sixth Congress cleared the path for the adoption of privatisation as a
legitimate element of a sweeping set of economic reforms implemented from the mid 1980s onwards in
Vietnam. At the beginning of “Doi Moi” in 1986, Vietnam had around 12,300 SOEs many of which were
unprofitable and exhibited signs of substantial inefficiency.
A concerted effort to attack this problem commenced in 1989 with the dissolution of many
unprofitable SOEs and rearrangement of others through mergers or liquidation. As a result, by the
beginning of 1992, the number of SOEs in Vietnam had declined to around 6,500 enterprises (CIEM 2002;
Vu, Anh T. T. 2005).
The process of privatization, or equitization as it is known in Vietnam was launched in 1992. The
objectives of privatization included the creation of a new method for developing a multi-sectoral economy
by diversifying the ownership structures of SOEs; the mobilisation of funds into shares of enterprises for
development and the facilitation of SOEs restructuring with the aim of improving their performance and
efficiency, thereby making them capable of maintaining a leading role in the economy (Le (1996) cited
from Chu (2004)).
The privatization of SOEs began to be brought into effect via the implementation of a pilot
program which called for the transformation of a limited number of viable or potentially viable small scale,
non strategic SOEs into private companies subject to Enterprise Law. This program was undertaken
through share issues sold to employees at preferential prices, to private owners, and to foreign investors on
a limited basis. However, because of gaps in the legal framework and the lack of a sense of urgency about
the process, only five SOEs had been privatized by the end of 1995 (Webster and Amin 1998; Truong,
Lanjouw et al. 2006).
To increase the pace of privatization, the government promulgated Decree No. 28/CP in May,
1996. This disbanded pilot privatisation programs and defined a comprehensive set of policies relating to
8
the privatisation of SOEs. This Decree maintained the general principles of the pilot program and expanded
the scope of privatization to all non-strategic small and medium-sized SOEs. It also required the agencies
controlling SOEs such as ministries and people’s committees to select candidate enterprises for
privatization (Truong, Lanjouw et al. 2006). This resulted in a measurable acceleration of the pace of
privatisation, a process which continues to the present.
However, despite this, there exists very little evidence in relation to the impact of privatisation in
Vietnam which would assist in evaluating the effectiveness of the policy in that setting. Section 3 sets out
details of the data and methodology employed within this study towards the end of partly filling that gap in
the extant literature.
iii. DATA AND METHODOLOGY
The objective of this study is to provide detailed evidence pertaining to the impact on a key
dimension of financial performance, profitability, of the transition from State-Owned enterprises to private
venture. Thus, it was a necessary precondition for inclusion in the research sample that firms studied had
originally been configured as SOEs and were subsequently privatised.
A second qualifying criterion for inclusion in the research sample was the availability of financial
statement data
2
Previous studies have documented the very poor levels of compliance among companies with their
obligations in relation to the preparation and disclosure of financial statements, even though this is required
, the key source of data relied upon for the purposes of the study. This was required because
the research question addressed relates not just to the degree of observable change in profitability over
time, but also the development of an understanding of the changes in key profit drivers. Only firm financial
statements contain a sufficiently rich dataset to facilitate such a form of analysis.
By the conclusion of 2007, Vietnam had completed the privatisation of approximately 3,800 SOEs
(Nguyen 2007). Ostensibly, this suggests the existence of a potentially very large data set upon which to
construct a study of the financial performance of former SOEs. However, in the context of Vietnam,
obtaining reliable financial data relating to firms is difficult and often impossible.
2
Under Vietnam Accounting law, all financial statements have to be prepared in unified formats.
9
by law (Pham 2004; Truong, Lanjouw et al. 2006). This inconsistency in mode of presentation and
availability of financial statements makes the execution of a research methodology based on a study of
detailed financial disclosures challenging.
Therefore, a further narrowing of the scope of the research sample was to limit the study to the
inclusion of former SOEs which had obtained a listing on one of Vietnam’s stock exchanges. These firms
face stricter disclosure standards and scrutiny of their compliance with reporting obligations, and are
required to produce and make available audited financial statements in a standard format on an annualised
basis (National Assembly of Vietnam 2006).
The first stock exchange to come into existence in Vietnam was opened in Ho Chi Minh City in
2000 and is generally referred to by the acronym HOSE. Vietnam’s second public equity capital market
opened in Hanoi in 2005 and is referred to as the Hanoi Securities Trading Centre - or HASTC. The listing
eligibility criteria and rules applying to these two equity markets are essentially the same and there is
evidence to suggest that the spread of firms in terms of size, industry and geography is comparable across
both markets (NDCP 2007). Therefore, it was judged appropriate to include firms listed on both markets in
the final research sample, where they met all stipulated sample selection criteria.
By the end of 2007 there were total of 244 firms listed on HOSE and HASTC. Of these, 133 firms
were listed on HOSE and 111 on HASTC. Among this group 213 firms had been SOEs prior to
undergoing privatisation and listing. The remaining 31 firms had originated in the private sector. These
were not eligible for inclusion in the research sample. Thus the potential research population consisted of
the 213 market listed former SOEs in existence by the conclusion of 2007.
In Vietnam, the accounting and reporting rules pertaining to financial services firms (e.g banks,
insurers, investment firms, securities firms) differ substantially from those applicable to other types of
organisation. This raised the prospect of data incompatability problems, and given the small number of
such organisations in the context of the total potential research population, and the lack of viability of
deriving a meaningful data subsample from these firms (given their small numbers), these too were
excluded from the final research sample. There were 13 such listed firms by the conclusion of 2007. This
left a total researchable population of 200 listed former SOEs, 104 of which were listed on HOSE and the
remaining 96 on HASTC.
10
However, not all of these firms could be included in the final research sample. This is due to the
nature of the research question being investigated. In short, the research focuses on evidence of change in
financial performance (if any) associated with privatisation. However, given that it is unlikely that change
in performance will be evident in the immediate wake of an entity’s transformation to a private firm,
prosecution of the research question requires the existence of multiyear datasets. Further, given that
according to the Vietnamese process, privatisation precedes listing (that is, the two events are not usually
simultaneous, though they are typically broadly contemporaneous
3
Consequently, without 2006- and 2007-listing firms in the research sample, the remaining dataset
consists of 6 listing year cohorts, including 5 firms listed in 2000; 4 firms listed in 2001; 10 firms listed in
2002; 2 firms listed in 2003; 3 firms listed in 2004 and 9 firms listed in 2005. None of these represent
viable datasets to study in their own right. Consequently, for the purposes of data analysis, it was necessary
to adopt a data pooling methodology. In essence, this approach obviates the problems inherent in small
), and the desirability of establishing
performance baselines from which to gather evidence of change, the availability of pre listing financial
statements was a necessary pre-condition for inclusion in the final research sample.
Specifically, it in order to be incorporated into the final research sample, it was necessary that
financial statement data for the two years prior to listing were able to be obtained. In the case of one of the
200 firms adverted to above, this was not possible, reducing the potential researchable sample to 199 firms.
In examining this group of firms it is notable that the greatest majority of listings occurred in 2006
and 2007. In combination, these two years account for 166 of 199 potentially researchable firms. However,
given the emphasis on the study of change over time, it was also necessary to exclude these firms from the
analysis, given the lack of post listing year data for the 2007 listing cohort, and the very limited (1 year)
post listing track record of the 2006 cohort. Ultimately, the minimum criteria required for inclusion in the
research sample were the availability of 2 years of pre and post listing financial statement data.
3
By scanning the privatizing years and listing years for all of 200 firms in both securities trading centres, it
shows that almost all firms privatized one or two years before listing. It is understandable in the context of
Vietnam where the privatization process is gradual, cautious process and the stock market is very young.
However, this led to the fact that it is impossible to capture the data in relation to the before-and-after
privatizing point. This difficulty continues driving us to study the changes of
financial performance of
privatized firms caused by the listing event. In other words, instead of comparing the financial performance
before and after privatizing we compare the financial performance of divested firms before and after listing
year.
11
calendar year listing cohorts by changing the focus of attention from listing year to year relative to listing
point.
As a simple example of the manner in which pooled datasets were produced, if a firm listed in
2000, then financial data relating to that firm for 2000 would be coded as falling within the t=0 dataset. If a
firm listed in 2003, then financial data relating to that firm for 2003 would be coded as falling within the
t=0 dataset. Thus, the t=0 dataset comprises observations pertaining to the year of listing, irrespective of
which calendar year the year of listing was. The same pooling procedure was used to generate the t -2, t-1,
t+1, t+2 and t+3 datasets.
For the purposes of analysis, the pooled data observations generated through the application of the
above process was divided into two subsamples. The first of these contained data sets in which
performance was tracked from t-2 through t+3. This included all firms which listed between 2000 and 2004
(inclusive). There were 24 such firms. Consequently, given that for each of these firms 6 observations were
available, the first data subsample consisted of 144 firm year observations for each financial variable of
interest.
The second subsample contained data sets in which performance was tracked from t-2 through
t+2. This included all firms which listed between 2000 and 2005 (inclusive). There were 33 such firms.
Consequently, given that for each of these firms 5 observations were available, the second data subsample
consisted of 165 firm year observations for each financial variable of interest.
Performing analysis on both a two and three year horizon post listing increases the quantum of
data available for analysis, and increases the degree of potential statistical and econometric robustness of
the analysis undertaken. In the case of the three year post listing data set, a greater period of time post
listing allows observations of more seasoned organisations which have had a longer period to adapt to the
realities of existence in private rather than public form.
A fundamental premise of the pooling methodology is that there is no systematic variation in the
characteristics of firms listed in each successive annual listing cohort, or the nature of each cohort’s post
listing experience. It is on this assumption that each firm’s base year data is treated as being comparable,
irrespective of whether the base year occurred in 2000 or at some later point.
12
There is the possibility however, that this assumption is not adequately descriptive of the
underlying empirical reality and that as a result, bias has been induced into the results. Several factors
mitigate against this possibility. First, during the period studied there was no political fluctuation which
changed or redirected the privatization program or firms’ operating environment. Thus, the institutional and
regulatory climate faced by each successive annual listing cohort was essentially static, a factor which
obviates against the likelihood of systemic bias characteristics between years in the research dataset.
Secondly, it is notable that over the entire time span covered by the study, Vietnam’s real GDP
growth rate, a broad proxy for economic conditions, was at all time within a band between 6 and 8% (Asian
Development Bank 2008), with growth rates slowly accelerating as time advanced. This suggests the
existence of a stable economic climate and suggests that no particular listing year cohort would have been
subjected to exogenous shocks which would have been likely to induce bias into the dataset and hence
results of analysis.
Thirdly, as suggested in section 2, in pursuing privatisation, Vietnam adopted a slow, cautious,
and gradual approach (Vu 2005). In consequence firms which were subjected to privatization during the
period studied were similar in their capital size, performance levels and endemic inefficiency factors, and
were not viewed as holding systemically strategic roles within the economic system.
From a technical perspective the application of a pooling approach yields some significant
benefits. The first and most important advantage is that it makes the data sample large enough to support
the conduct of meaningful and robust statistical and econometric testing. From a statistical perspective,
larger sample size will tend to minimize the standard error of any predicted variable, for example the
sample mean, resulting in greater robustness. Furthermore, results from larger samples can be more readily
used for the purpose of developing generalisable propositions or insights (Black 1999; Swift and Piff
2005).
The second benefit which is brought by this technique is the ability to have insight the
performance of firms in different industries. Of 33 firms in the two-year post listing subsample there were
21 manufacturing firms with the remaining 11 firms falling into the category of trading and services
organisations. And among the 24 firms in the three-year post listing subsample there were 16
13
manufacturing firms and 8 which fell into the trading and services category. Thus, analysis was undertaken
not only on two time horizon subsamples, but also in relation to two industry sub samples.
Given the focus of the research on firm profit and cost structure, the variables of interest for the
purposes of the study included; before tax net profit margin
4
, gross profit margin
5
, cost of goods sold,
selling & administration expense and cost of doing business
6
Values for each measure described above were calculated for each firm year. This yielded the final
research dataset, comprising 945 datapoints. Mean and weighted mean values
. Together, these allowed a detailed
deconstruction of firm profit and loss functions, including the development of insights into the key vectors
of cost and revenue side value generation. To control for variation in firm size, all raw data was scaled by
and expressed as a proportion of sales.
7
4
Defined as operating profit before tax divided by net sales revenue.
5
Defined as gross profit divided by net sales revenue where gross profit is net sales revenue less cost of
goods sold.
6
Defined as accrual operating expenses less cost of goods sold, less depreciation & amortisation less
financing costs.
7
Weighted mean values were calculated with reference to share of total assets (balance sheet measures) and
share of revenue (P+L and cashflow measures).
were calculated for each
variable of interest for each relevant time point (e.g t-2, t-1 etc). These mean values formed the basis of the
datasets drawn upon for statistical and econometric testing. Results were partitioned by time, and also into
industry subsamples (manufacturing and services & trading).
The research question centres on the development of insights into changes in the financial
performance, specifically, the profitability of former SOEs post listing. A key means of testing for the
presence of changed financial performance is to gather evidence of changes in the mean values of various
driver ratios over time. This requires not only observation of the direction of changes in mean variable
values (if any) but also statistical confirmation that the magnitude of the difference between sample means
over time is significant.
The dataset was subjected to the Kolmogorov-Smirnov as a means of testing the distributions of
sample variable data for normality. Based on the values the distribution of values for a majority of the
research variables was judged not to follow a normal distribution. Consequently, testing for differences in
means required the application of a non parametric Wilcoxon signed rank test (Field, 2005). The results of
the application of the method described above are set out and discussed in Section 4, below.
14
iv. RESULTS AND ANALYSIS
As discussed above, the process of privatization has frequently been justified on the premise that a
move from the public to the private sector should improve efficiency thus stimulating greater profitability,
the extant literature has reported mixed ex post outcomes on this dimension for privatized former SOEs.
Some studies have provided indicative evidence of profitability improvements while other researchers have
uncovered evidence of profitability declines in the immediate post privatization phase. The potential
confusion generated by the existence of such conflicting results is compounded by the general lack of
explanation available in the literature for reported post privatization profitability changes. This lack of
clarity as to the factors driving observed changes in post privatisation has generally resulted from the
application of methodologies drawing upon large sample aggregate data (for example from government
census surveys), in which only headline measures such as “revenue” and “profit” but not decomposed
driver element data is available.
This gap in the literature is addressed in this study through the examination of evidence relating to
the composition of sample firm profit and loss data. A key difficulty with the interpretation of observed
changes in profitability is the fact that profit represents an aggregated summary measure of performance,
incorporating the influence of a range of factors on the revenue and expense side of the calculation. These
factors may be imperfectly correlated, resulting in partial offsets such that while the headline measure
(profit) may not demonstrate significant change, the underlying financial structure of organizations may
have undergone substantial evolution.
Thus, in contemplating an analysis of profitability, it is useful to dissect the profit and loss
function into a variety of elements, each of which may be subject to substantially different influences. The
starting point for the profit and loss calculation is sales revenue.
A review of the data indicates that firms included in the research sample achieved substantial
cumulative sales growth in the first two and three years post listing. For manufacturers, this amounted to
41.43% and 63.66%, respectively, while for trading and services firms the cumulative growth exhibited at
the two and three year mark was 68.72% and 73.55%.Holding all other factors equal, this would generally
lead to the expectation of increased profitability.
15
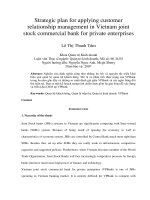
However, as the data in Tables 1, 2 and 3 below demonstrate, the profitability of former SOEs in
Vietnam (as measured by before tax net profit margins) suffered, rather than expanded post privatization
and listing. The first of these tables contains data pertaining to all firms included in the research sample,
irrespective of industry membership. It shows that compared with before tax profit margins enjoyed in the
year prior to privatization and listing (which averaged 11.7%), profitability at the second and third years
post listing was substantially lower, falling into the early 9% range. That is, by the second and third years
post privatization and listing, average before tax net profit margins of the former SOEs studied had been
compressed by approximately 25% compared to the immediate pre listing point
8
One factor causally linked to the observed changes (where present) in before tax net profit margins
is the gross margin experience of sample firms. Here, the story is universal. On average, both
manufacturing and services & trading firms exhibited statistically significant declines in mean gross margin
levels at the second and third year post listing compared to the position one year prior to listing
.
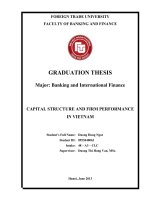
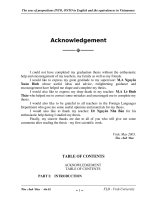
The observed decline in profitability was not evenly distributed across all firms studied. As Table
2 shows, manufacturing firms fared measurably worse than the average experience for all firms, while
Table 3 shows that trading and services firms experienced less pressure on their before tax net profit
margins. Indeed, there is no statistical basis for concluding that the profitability of trading and services
firms exhibited material differences at either the two or three year post listing point compared to the year
immediately prior to listing. By contrast, there is compelling evidence that manufacturing firms
experienced declines in before tax net profit margins in the range of 25% to 35% depending on the point of
measurement.
9
It would appear that a significant driver of gross margin compression was inventory cost pressure,
with cost of goods sold as a proportion of sales increasing by approximately 2 – 4% over the first two and
three years post listing (compared to the year prior to listing) for manufacturing firms and by in the range of
. These
were more dramatically pronounced among trading and services firms than among the manufacturing
enterprises included in the research sample.
8
The difference between the observed mean value of before tax net profit margins at t-1 versus t+2 and t+3
is statistically significant at the 99% confidence interval.
9
All variations in mean values were negative, and all were statistically significant to at least the 95%
confidence level.
16
10 – 15% for trading and services firms over the same timeframe. This is consistent with arguments
advanced in extant literature on the subject of reform in Vietnam to the effect that pressures faced by
former SOEs post privatization have included the loss of preferred trading terms and a range of subsidies
(Henrik, 2005).
Removal of these factors would tend to have the effect of increasing the economic cost of
acquiring business inputs such as inventory. In addition, it is also likely that an element of the margin
compression experienced by firms in the research sample was driven by pricing side pressure
10
This pattern, while contradictory on a prima facie basis, is able to be explained by the divergent
experience of manufacturing firms compared to trading and services firms in relation to the management of
non inventory related costs. In summary, whilst manufacturing firms experienced smaller gross margin
declines than trading and services firms, their overall cost of doing business (including selling &
administrative costs) increased at both the two and three year mark post listing, compared to the pre listing
position. By contrast, trading and services firms aggressively reduced their cost of doing business
, as SOEs
faced greater competition in their private guise than that to which they had been exposed whilst subject to
state ownership (Hoang & Carlin, 2008).
The cross sectionally consistent decline in gross profit margins achieved by the firms included in
the research sample at the two and three year mark post listing (in the order of 10 – 20% for manufacturing
firms and 30 – 35% for trading and services firms) contrasts starkly with the variation in before tax net
profit margin performance exhibited by manufacturing and trading & services firms, respectively. As
discussed previously, while the before tax net profit margin of manufacturing firms declined at both the two
and three year point post listing in comparison to the position these firms enjoyed in the year immediately
prior to listing, there was no statistically meaningful variation in the observed before tax net profit margins
of trading and services firms over the same intervals.
10
For example, at the two year point post listing, the gross profit margin of the manufacturing subsample
had declined by 398 basis points compared to the pre listing year position. Over the same period, cost of
goods sold as a proportion of sales revenue increased by only 282 basis points. A similar pattern is evident
in the trading and services firm data. This suggests that pricing side pressure as well as cost side pressure
contributed to margin compression in many of the firms studied.
17
(including selling & administrative costs) by in the order of 33% by the second year post listing and
approximately 45% by the third year post listing
11
.
Overall, the profit and cost management performance of the former SOEs studied was mixed. The
data supports the proposition that declining post privatization profitability was driven substantially by
exogenous factors (supply side cost pressure, pricing and margin pressure in the face of increased
competition). Manufacturing firms also experienced internal cost structure inflation, though at relatively
modest rates, while trading and services firms sought and achieved material efficiencies in their cost of
doing business.
It is not clear why this divergence in cost management outcomes between manufacturing and
trading and services firms arose. One conjectural explanation lies in the observation that the far steeper
declines in post listing gross profit margins on the part of trading and services firms (when compared to
manufacturing firms) may have driven a greater sense of urgency in seeking internal cost reductions
amongst these firms. Irrespective, sharpened cost management was not a universal characteristic of the
firms studied.
11
By contrast, cost of doing business in manufacturing firms increased by 6% in comparison to the pre
listing year by the second year post listing and 15% by the third year post listing.
18
Table 1: Cost, pricing, and profit of listed firms in year two and year three post-listing: whole sample
Two years post listing
Three years post listing
N Mean
(w.mean)
at t-1
Mean
(w.mean)
at t+2
Difference
of mean
(w.mean)
Wilcoxon test
Z (sig. level)
Proportion
of firm has
decrease
(increase)
N Mean
(w.mean)
at t-1
Mean
(w.mean)
at t+3
Difference
of mean
(w.mean)
Wilcoxon test
Z(sig. level)
Proportion
of firm has
decrease
(increase)
Profit Margin 33 11.70
(11.53)
9.01
(8.32)
-2.68
(-3.21)
-2.546
(0.011)
66.67
(33.33)
24 11.97
(11.85)
9.11
(8.31)
-2.86
(-3.54)
-2.543
(0.011)
79.17
(20.83)
Gross profit margin 33 21.09
(19.34)
15.94
(14.02)
-5.15
(-5.32)
-3.100
(0.002)
75.76
(24.24)
24 21.92
(19.07)
17.56
(15.69)
-4.36
(-3.38)
-2.771
(0.006)
79.17
(20.83)
Cost of goods sold on sales 33 78.91
(80.66)
83.06
(85.36)
4.15
(4.70)
-2.493
(0.013)
30.30
(69.70)
24 78.08
(80.93)
82.44
(84.31)
4.36
(3.38)
-2.771
(0.006)
20.83
(79.17)
Selling & Admin on sales 33 10.09
(8.71)
8.70
(7.36)
-1.39
(-1.34)
-1.724
(0.085)
69.70
(30.30)
24 10.70
(8.28)
9.24
(7.50)
-1.46
(-0.78)
-1.229
(0.219)
70.83
(29.17)
CODB on net sales 33 10.31
(8.89)
8.91
(7.60)
-1.39
(-1.29)
-1.653
(0.098)
66.67
(33.33)
24 10.84
(8.46)
9.46
(7.75)
-1.37
(-0.71)
-1.229
(0.219)
70.83
(29.17)
19
Table 2: Cost, pricing, and profit of listed firms in year two and year three post-listing: manufacturing firms
Two years post listing
Three years post listing
N Mean
(w.mean)
at t-1
Mean
(w.mean)
at t+2
Difference
of mean
(w.mean)
Wilcoxon test
Z (sig. level)
Proportion
of firm has
decrease
(increase)
N Mean
(w.mean)
at t-1
Mean
(w.mean)
at t+3
Difference
of mean
(w.mean)
Wilcoxon test
Z(sig. level)
Proportion
of firm has
decrease
(increase)
Profit Margin
21
12.03
(11.02)
7.59
(7.28)
-4.44
(-3.74)
-3.319
(0.001)
76.19
(23.81)
16
11.56
(10.16)
8.50
(7.60)
-3.06
(-2.55)
-2.637
(0.008)
87.50
(12.50)
Gross profit margin
21
19.07
(19.25)
15.09
(13.94)
-3.98
(-5.31)
-2.242
(0.025)
71.43
(28.57)
16
18.18
(18.30)
17.03
(16.83)
-1.85
(-1.47)
-1.965
(0.049)
81.25
(18.75)
Cost of goods sold on sales
21
80.93
(80.75)
83.76
(85.08)
2.82
(4.33)
-1.825
(0.068)
33.33
(66.67)
16
81.12
(81.70)
82.97
(83.17)
1.85
(1.47)
-1.965
(0.049)
18.75
(81.25)
Selling & Admin on sales
21
8.08
(9.38)
8.61
(8.66)
0.52
(-0.72)
-0.261
(0.794)
61.90
(38.10)
16
8.36
(9.32)
9.59
(9.26)
1.23
(-0.06)
-0.259
(0.796)
62.50
(37.50)
CODB on net sales
21
8.21
(9.47)
8.73
(8.75)
0.52
(-0.72)
-0.261
(0.794)
57.14
(42.86)
16
8.50
(9.42)
9.19
(9.34)
1.29
(0.05)
-0.207
(0.836)
62.50
(37.50)
20
Table 3: Cost, pricing, and profit of listed firms in year two and year three post-listing: trading and services firms
Two years post listing
Three years post listing
N Mean
(w.mean)
at t-1
Mean
(w.mean)
at t+2
Difference
of mean
(w.mean)
Wilcoxon test
Z (sig. level)
Proportion
of firm has
decrease
(increase)
N Mean
(w.mean)
at t-1
Mean
(w.mean)
at t+3
Difference
of mean
(w.mean)
Wilcoxon test
Z(sig. level)
Proportion
of firm has
decrease
(increase)
Profit Margin 12 11.12
(12.15)
11.50
(9.55)
0.39
(-2.61)
0.000
(1.000)
50.00
(50.00)
8
12.80
(14.41)
10.32
(9.37)
-2.48
(-5.04)
-0.560
(0.575)
62.50
(37.50)
Gross profit margin 12 24.64
(19.45)
17.45
(14.11)
-7.19
(-5.35)
-2.197
(0.028)
83.33
(16.67)
8
28.00
(20.22)
18.60
(14.00)
-9.40
(-6.22)
-2.100
(0.036)
75.00
(25.00)
Cost of goods sold on sales 12 75.36
(80.55)
81.82
(85.69)
6.46
(5.14)
-1.647
(0.099)
25.00
(75.00)
8 72.00
(79.78)
81.40
(86.00)
9.40
(6.22)
-2.100
(0.036)
25.00
(75.00)
Selling & Admin on sales 12 13.61
(7.89)
8.87
(5.84)
-4.74
(-2.06)
-2.432
(0.015)
83.33
(16.67)
8
15.37
(6.72)
8.52
(4.90)
-6.85
(-1.82)
-2.380
(0.017)
87.50
(12.50)
CODB on net sales 12 13.97
(8.17)
9.24
(6.24)
-4.73
(-1.93)
-2.432
(0.015)
83.33
(16.67)
8
15.51
(7.01)
8.81
(5.20)
-6.70
(-1.80)
-2.380
(0.017)
87.50
(12.50)
21
v. CONCLUSIONS
Privatisation has often been argued to represent a potent means through which it is possible to
transform the efficiency of previously economically moribund state owned enterprises. However, the
empirical evidence accumulated to date casts doubt on whether mere change in the locus of firm
ownership interests is in and of itself sufficient to drive desired changes in performance.
Increased post privatisation profitability has often been drawn upon as a proxy for efficiency
improvement and there can be no doubt that in some settings, remarkable improvements have been
observed on this dimension of performance in the post privatisation period. It has been documented, for
example, that former state owned natural monopoly utilities have often exhibited substantial
profitability acceleration in their post privatisation phase (Buckland & Fraser, 2000).
However, much of the observed improvement in post privatisation profitability in such
settings may have stemmed not from efficiency gains, but rather from the application of favourable
regulatory settings (Shaoul, 2005). Further, as discussed above, the evidence on post privatisation
profitability performance has been mixed, depending on the jurisdiction in which the privatisation
occurred.
The inconsistencies in the accumulated empirical evidence on the impact of privatisation on
performance suggest that ownership change is not likely, in and of itself, to effectuate material
performance improvements. Other factors may dominate. These may include the nature of regulatory
regimes faced by firms in the wake of their transition to private ownership, the impact of having
securities listed for trade on an organised equity capital market (the governance effect), the loss of
access to privileges such as hard and soft subsidies and the degree to which competition may be
brought to bear on the newly privatised firm, amongst others.
The firms examined for the purposes of this study faced substantial financial challenges in the
years immediately post privatisation. Their gross profit margins declined measurably. Further, their
capacity to recover the loss of trading margins by slicing other business costs was varied and
inconsistent. While the evidence suggests that a substantial portion of the gross margin declines
experienced by the firms studied was due to the imposition of external pricing and cost pressure, not all
of the financial fate of the sample firms lay in the hands of others.
22
Among the variables studied, a number – including selling & administrative expenses and cost
of doing business might be expected to be dominantly subject to the influence of internal decision
making. Yet in the face of in some cases severe gross margin capitulation, many firms in the research
sample were unable to respond, even over a three year timeframe post listing, with improvements in
their internal operating cost structures.
This raises the question of whether a key overlooked variable in the study of the impact of
privatisation might be the role and skill of management teams, the composition of which is likely to
substantially transcend the point of privatisation. If organisations are to perform in a materially
different manner post privatisation than in their pre privatisation guise, management skill – along with
a range of other factors, including the impact of regulation and competition is likely to represent a key
contributing factor. This is recommended as a matter for contemplation both by policy makers and by
scholars conducting future studies into the privatisation phenomenon.
23
REFERENCES
Asian Development Bank, (2008), "Key Indicators for Asia and the Pacific 2008", ADB, Retrieved from:
www.adb.org/Documents/Books/Key_Indicators/2008/pdf/Key-Indicators-2008.pdf
Black, T. R., (1999), Doing quantitative research in the social sciences, SAGE Publication Ltd, London.
Bortolotti, B., and Fantini, M., (2001), “Privatisation Around the World: New Evidence from Panel Data”,
CESifo Working Paper No. 600, October.
Boubakri, N. & Cosset, J C., (1998), "The financial and operating performance of newly privatized firms:
Evidence from developing countries", The Journal of Finance, vol. 53, iss. 3, pp. 1081-1110.
Brezis, E., and Schnytzer, A., (2003), “Why are the Transition Paths in China and Eastern Europe Different?”,
Economics of Transition, Vol 11, pp. 3 – 23.
Buckland, R., and Fraser, P., (2000), “Abnormal Returns in the UK Water Industry Since Privatisation”,
Aberdeen Papers in Accountancy, Finance & Management, Working Paper 00-10.
Carlin, T., (2005), “Debating the Impact of Accrual Accounting and Reporting in the Public Sector”, Financial
Accountability & Management, Vol. 21, No. 3, pp. 309 – 336.
Chu, T., (2004), Accounting Changes in a Transition Economy: The Case of Vietnam, PhD Thesis, University of
Wollongong.
Central Institute for Economic Management (CIEM), (2002), "Vietnam's equitized enterprises: An ex-post study
of performance, problems and implication for policy", Report, CIEM. Retrieved from:
/>uitization.pdf
Fforde, A. and Vylder, S., (1996), “From Plan to Market: The Economic Transition in Vietnam, (New York,
Westview Press).
Field, A., (2005), Discovering statistics using SPSS, SAGE publication, London.
Galal, A., Jones, L., Tandon, P., and Vogelsang, I., (2004), Welfare Consequences of Selling Public Enterprises,
(New York, Oxford University Press).
Gruening, G., (2001), “Origin and Theoretical Basis of New Public Management”, International Public
Management Journal, Vol. 4, No. 1, pp. 1 – 25.
24
Harvie, C., and Tran, H., (1997), Vietnam's Reforms and Economic Growth, (Basingstoke, Macmillian).
Henrik, M., (2005), “Private Sector Development in a Transition Economy: The Case of Vietnam”,
Development in Practice, Vol. 15, pp. 349 – 361.
Hoang, H., & Carlin, T., (2008), “Ownership Structure and Determinants of Efficiency in Vietnam’s Industrial
Sector, 2001 – 2005”, Global Review of Business and Economic Research, Vol. 4, No. 1, pp. 25 – 49.
Klintworth, G. (1991). Vietnam: forces of change. Doi Moi: Vietnam's Renovation- Policy and Performance. D.
Forbes, T. H. Hull, D. G. Marr and B. Brogan. Canberra, Department of Political and Social Change,
ANU.
Lapsley, I., (2008), “The NPM Agenda: Back to the Future”, Financial Accountability & Management, Vol. 24,
No. 1, pp. 77 – 96.
Le, D., (1991), Economic renovation in Vietnam: achievements and prospects. Doi Moi: Vietnam's Renovation-
Policy and Performance. D. Forbes, T. H. Hull, D. G. Marr and B. Brogan. Canberra, Department of
Political and Social Change, ANU.
Megginson, W., and Netter, J., (2001), “From State to Market: A Survey of Empirical Studies on Privatisation”,
Journal of Economic Literature, Vol. 39, No. 2, pp. 321 – 389.
National Assembly of Vietnam, (2006), "Stock Law (Luat Chung khoan)", National Politics Publisher, Vietnam,
N. A. O., 70/2006/QH11
NDCP, (2007), Nghi dinh 14/2007/NDCP ngay 19/01/2007 quy dinh chi tiet thi hanh mot so dieu cua Luat
chung khoan (Decree 14/2007/NDCP: Detail of clauses of the Stock Law).
Nguyen Ha, (2007), "Co phan hoa DNNN: No xau la luc can chinh (Privatization of State-Owned-Enterprises:
Bad debts are key obstacle)", Retrieved from:
OECD, 1994, Non-financial Enterprises Financial Statistics 1993, (Paris, OECD Publications).
Pham, D. C., (2004), "Hoan thien che do bao cao tai chinh Doanh nghiep trong cac cong ty co phan (Improving
regulations of financial accounting statement in privatized companies)", Tap chi Kinh te phat trien
(Economic and Development Magazine)- Dai hoc Kinh te Quoc dan, Vol. Iss. 2/2004,
Pollitt, C., and Bouckaert, (2000), Public Management Reform; A Comparative Analysis, (Oxford, Oxford
University Press).
25
Shaoul, J., (2005), “A Critical Financial Analysis of the Private Finance Initiative: Selecting a Financing
Method or Allocating Economic Wealth?”, Critical Perspectives on Accounting, Vol. 16, No. 4, pp.
441 – 471.
Swift, L. & Piff, S., (2005), Quantitative methods for business, management and finance, Palgrave Macmillan,
New York.
Thayer, C., (1991), "Renovation and Vietnamese society: the changing role of government and administration",
in Forbes, D., Hull, T. H., Marr, D. G. & Brogan, B. (eds.), Doi Moi: Vietnam's Renovation- Policy and
Performance, Department of Political and Social Change, ANU, Canberra.
Than, M. & Tan, J., (Eds.) (1993) The Vietnamese economy in transition: Introductory overview, Institute of
Southeast Asian Studies, Singapore.
Truong, L. D., Lanjouw, G. & Lensink, R., (2006), "The impact of privatization on firm performance in a
transition economy", Economics of Transition, vol. 14, iss. 2, pp. 349-389.
Vo, T., (1990), Vietnam's Economic Policy Since 1975. (Singapore, Institute of Southeast Asian Studies).
Vu Anh, T. T., (2005), "Vietnam- The Long March to Equitization", The William Davision Institute at the
University of Michigan. Retrieved from:
Webster, L. & Amin, R. M., (1998), "Equitization of state enterprises in Vietnam: Experience to date", Report,
MPDF. Retrieved from:
Wei, Z., D'Souza, J., Varela, O. & Hassan, K. M., (2003), "The financial and operating performance of China's
newly privatized firms", Financial Management, vol. 32, iss. 2, pp. 107-126.