Pre diagnostic faecal calprotectin levels in patients with colorectal cancer a retrospective study
Bạn đang xem bản rút gọn của tài liệu. Xem và tải ngay bản đầy đủ của tài liệu tại đây (1.04 MB, 7 trang )
(2022) 22:315
Blad et al. BMC Cancer
/>
Open Access
RESEARCH
Pre‑diagnostic faecal calprotectin
levels in patients with colorectal cancer:
a retrospective study
Nathalie Blad1, Richard Palmqvist2 and Pontus Karling1*
Abstract
Background: Faecal calprotectin (FC) is a potential biomarker for colorectal cancer (CRC) screening. There is uncertainty if tumor characteristics are associated with FC levels. We investigated how tumor stage and tumor localization
influence the extent of FC levels in patients with CRC in clinical practice.
Methods: In two cohorts of patients with CRC, we retrospectively analyzed FC tests (CALPRO®) performed within
three months prior to diagnosis. One hundred twenty-four patients with CRC were included (mean age 68 years, 44%
women).
Results: Ninety-eight patients with CRC (79%) had a FC ≥ 50 µg/g. FC correlated positively with tumor stage (UICC
based on WHO TNM classification) (rs 0.24; p = 0.007) and with CRP levels (rs 0.31, p = 001), and a negatively with
B-haemoglobin (rs -0.21; p = 0.019). The patients with right-sided CRC had significantly more often a FC ≥ 50 µg/g
than patients with left-sided CRC (92% vs 74% p = 0.027). In a binary logistic regression analysis, tumor stage III/IV
(adjusted OR 3.47; CI 1.27–9.42) and right-sided tumor localization (adjusted OR 3.80; CI 1.01–14.3) were associated
with FC ≥ 50 µg/g. Tumor stage III/IV (adjusted OR 2.30; CI 1.04–5.10) and acetylsalicylic use (adjusted OR 3.54; CI
1.03–12.2) were associated with FC ≥ 100 µg/g. In a cox regression analysis, a FC ≥ 100 µg/g was not associated with
survival (Hazard OR 0.61; CI 0.24–1.52).
Conclusions: Elevated pre-diagnostic FC levels were common in patients with CRC in close proximity to diagnosis.
Right-sided localization and tumor stage were significantly associated with a rise in FC levels.
Keywords: Calprotectin, Colorectal cancer, Rectal cancer, Tumor localization, Tumor stage
Background
Colorectal cancer (CRC) is globally the third most common cause of cancer, and in the Western population
approximately 5% will be diagnosed with CRC during
their lifetime [1]. CRC incidence is strongly related to
age, and in developing countries the median age at diagnosis is 68 years for men and 73 years for women [2].
Most CRC cases are sporadic and progress gradually
*Correspondence:
1
Department of Public Health and Clinical Medicine/Medicine, Umeå
University, S90185 Umeå, Sweden
Full list of author information is available at the end of the article
over time through the adenoma-carcinoma sequence
[3]. Commonly symptoms of CRC (i.e. change in bowel
habits, haematochezia) are presented late in the course
of the disease. However, the most important prognostic
factor is the stage of the disease at diagnosis [3]; therefore screening programs for CRC have been established
in many countries on subjects beyond 60 years of age [4].
The golden standard for CRC screening is colonoscopy but this has the disadvantage of being invasive,
more resource demanding and expensive [5]. Instead, the
method of screening for CRC used in most countries is
the faecal haemoglobin (F-Hb) test followed by a colon
© The Author(s) 2022. Open Access This article is licensed under a Creative Commons Attribution 4.0 International License, which
permits use, sharing, adaptation, distribution and reproduction in any medium or format, as long as you give appropriate credit to the
original author(s) and the source, provide a link to the Creative Commons licence, and indicate if changes were made. The images or
other third party material in this article are included in the article’s Creative Commons licence, unless indicated otherwise in a credit line
to the material. If material is not included in the article’s Creative Commons licence and your intended use is not permitted by statutory
regulation or exceeds the permitted use, you will need to obtain permission directly from the copyright holder. To view a copy of this
licence, visit http://creativecommons.org/licenses/by/4.0/. The Creative Commons Public Domain Dedication waiver (http://creativeco
mmons.org/publicdomain/zero/1.0/) applies to the data made available in this article, unless otherwise stated in a credit line to the data.
Blad et al. BMC Cancer
(2022) 22:315
investigation in those subjects with a positive test [4]. The
accuracy of the F-Hb test depends on the method used
and the cut-off value for defining a positive test [6]. The
faecal immunochemical tests (FIT) perform better than
the guaiac based F-Hb test, and FIT has a specificity of
94% in detecting CRC [7]. In contrast, FIT has only a
modest sensitivity 74% and it fails to detect precancerous
stages (polyps and adenomas) [7].
The lack of sensitivity for FIT to detect early tumor
stages of CRC highlights the need to find novel biomarkers that could improve the screening detection rate for
CRC. Faecal calprotectin (FC) is a marker that is currently being used to differentiate between organic and
functional disorders of the colon. Calprotectin is a calcium binding protein that is abundant in the cytosol of
neutrophils, and accordingly, the levels of FC will rise
in faeces when active inflammation is present [8]. Previous studies have shown that patients with CRC have
increased FC levels, and that FC reverts to normal levels
after resection surgery [9]. The reason for why patients
with CRC have elevated FC levels is not known. Possible
causes are occult bleeding or tumor leakage. In addition,
recruitment of neutrophils at the tumor site has been
suggested. For example, a local acute inflammatory reaction of variable intensity has been seen in patients with
CRC [10].
The primary aim of the present study was to determine to what extent FC levels are associated with tumor
localization and tumor stage. We hypothesized that distal
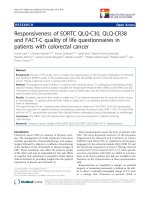
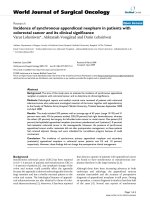
Fig. 1 Flow chart of the selection process of patients for the study
Page 2 of 9
location, advanced stage and inflammatory activity are
associated with higher FC levels. The secondary aim
was to study the association between FC levels within
three months prior to diagnosis and common serum
biomarkers.
Material and methods
Study design
A retrospective, observational study of patients with CRC
in clinical practice.
Study population
The study included two cohorts. The first cohort included
all patients between January 1, 2013 to September 14,
2017 in Västerbotten County Sweden with newly diagnosed CRC according to International Classification of
Diagnosis (ICD) codes C18-21 and D37.4–5. Västerbotten County is situated in Northern Sweden and has a
population of 220,000 inhabitants. There are three hospitals in the area. The entire region shares the same computerized medical record system, which enables easy
access to all chemical laboratory analyses, diagnostic
imaging, and all sections of the medical record (i.e. from
the Department of Surgery and Department of Oncology, etc.). A medical chart review that included journals
from Surgery, Endoscopy, Radiology and Pathology was
performed to confirm diagnosis and inclusion/exclusion
criteria. An inclusion criterion was a FC test performed
within three months prior to CRC diagnosis (Fig. 1). All
Blad et al. BMC Cancer
(2022) 22:315
patients diagnosed with inflammatory bowel disease [11]
were excluded from the study.
A second cohort of patients with CRC were recruited
from the Faecal and Endoscopic Colorectal study in
Umeå (FECSU); FECSU has been described in detail previously [12]. Briefly, in the FECSU study, all out-patients
referred for colonoscopy from 2008 to 2013, regardless of
underlying indication, were offered to undergo a FC test
and a FIT on the day before the start of the bowel preparation for colonoscopy. Exclusion criteria in the FECSU
were planned colonoscopy within one week, dementia
and low-performance status that included mentally or
physically disabled persons. In the FECSU, 1136 patients
were enrolled of which 41 patients were diagnosed with
CRC at the colonoscopy.
CRC diagnosis and observational time
For all patients in the present study, the diagnostic date
for CRC was defined by when the tumor was located for
the first time with either endoscopy, imaging or surgery.
The characteristics of the CRC, i.e. location and tumor
stage according to the TNM classification [13], was
defined by information from endoscopy reports, surgery
reports as well as judgement from the pathologists. For
those patients who received radiation therapy prior to
surgery, the clinical tumor stage before the start of radiation therapy was used. A tumor located proximal of the
splenic flexure was defined as right-sided, and a tumor
located distally of splenic flexure to the rectum was
defined as left-sided. Observational time was defined as
the time period between the date at diagnosis and medical chart review date of October 2018.
Faecal and blood markers
Patients in both cohorts received the same instructions
for the collection procedure of the FC test. Stool samples were stored at room temperature for a maximum
of 7 days before being processed at the lab facility. The
FC analyzing method used during this period at the
accredited Department of Laboratory Medicine, Clinical
Chemistry, University Hospital of Umể was CALPRO®
(calprotectin ELISA test) and was performed according to the manufacturer’s instructions. Assay sensitivity
for FC is between 20 µg/g and 10,000 µg/g. We used two
cut-off levels to define a pathological FC test. The cut-off
level of ≥ 50 µg/g for the CALPRO® that was used in the
original studies by Tibble et al. [14, 15]. The cut-off level
of ≥ 100 µg/g which is standard to use in clinical practice
[16].
FIT was recorded as positive > 40 ng/ml of human haemoglobin, or negative. FIT was analyzed using the immunological analysis FOB test (FIT) (ANL products AB,
Sweden) according to the manufacturer’s instructions.
Page 3 of 9
When serum C-reactive protein (CRP), serum carcinoembryonic antigen (CEA), blood haemoglobin (Hb),
mean corpuscular volume (MCV), serum ferritin and FIT
tests were performed in clinical practice, the tests that
were sampled in closest proximity to the performed FC
sample were noted. Blood tests that were performed after
treatment (i.e. surgery) of the tumor, or blood test done
more than three months from the performed FC were
not included in the study.
Statistical analysis
To analyze the relationship between serum biomarkers and FC we used the Spearman correlations test. The
Mann–Whitney U test was used for categorical variables. The
chi2 test was used for cross-table analysis.
Logistic regression was used for dependent variable
FC ≥ 100 µg/g and FC ≥ 50 µg/g and adjusted for the
independent variables gender, age, localization (rightsided versus left-sided), tumor stage (stage III/IV vs I/
II) and the use of acetylsalicylic acid (ASA) prescription
[17]. We adjusted only for confounders that more than
10 subjects reported. Only six patients were on non-steroidal anti-inflammatory drugs (NSAID) [18] and were
therefore not included in the logistic regression model.
In all analyses, a p-value ≤ 0.05 was considered statistically significant. The survival time was analyzed using
the Kaplan–Meier method and Mantel-Cox test. A Cox
regression analysis was performed for the covariates age
at diagnosis, male gender, tumor stage III/IV, right-sided
tumor localization, ASA use and FC ≥ 100 µg/g. All statistics were calculated using SPSS version 27.
Results
A total of 124 patients were included in the analyses
(Fig. 1). Patients´ baseline characteristics are summarized
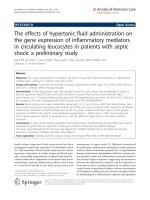
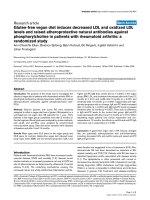
in Table 1. The distribution of FC levels is shown in Fig. 2.
When excluding the patients in the FECSU study (those
performing the FC test the day before the preparation for
colonoscopy), the median time period between FC sample and CRC diagnosis was 29 days (25th-75th percentile
14–63 days). The frequency of concurrent medications
that could have impact on FC values was acetylsalicylic
acid (ASA) for 21 patients and non-steroid anti-inflammatory drug (NSAID) for 6 patients.
Tumor localization and stage
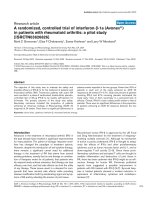
There was no difference in tumor stage between the
patients with right-sided vs left-sided CRC (56% vs 51%
had tumors in stage III or IV; p = 0.66). Patients with
right-sided tumors showed higher median FC values
than patients with left-sided tumors (206 vs 122 µg/g)
(Fig. 3), but the difference was not significant (p = 0.061).
The patients with right-sided CRC had significantly more
Blad et al. BMC Cancer
(2022) 22:315
Page 4 of 9
Table 1 Clinical characteristics of patients with colorectal cancer
who performed a CALPRO® faecal calprotectin (FC) test within
three months prior to diagnosis (n = 124)
Mean age, years (SD)
68 (11)
Gender
Women
44% (n = 55)
Men
56% (n = 69)
Colorectal cancer diagnosed at:
Colonoscopy
92% (n = 114)
Imaging
6% (n = 7)
Surgery
2% (n = 3)
Median F-calprotectin level (μg/g) (25th-75th percentile)
149 (67–392)
Proportion of patients with:
F-calprotectin ≥ 50 μg/g
79% (n = 98)
F-calprotectin ≥ 100 μg/g
60% (n = 74)
Positive faecal immunchemical test (n = 76)a
89% (n = 68)
Tumor characteristics (n = 108)a
Low-grade
85% (n = 92)
High-grade
15% (n = 16)
Non-Mucinous
85% (n = 92)
Mucinous
15% (n = 16)
Vascular invasion (n = 103)a
18% (n = 19)
Perineural growth (n = 103)a
19% (n = 20)
TNM classification
Tumor (T) (n = 109)a
T1
3% (n = 3)
T2
19% (n = 21)
T3
61% (n = 66)
T4a
9% (n = 10)
T4b
8% (n = 9)
Nodes (N) (n = 106)a
N0
49% (n = 54)
N1
25% (n = 29)
N2
20% (n = 23)
Metastasis (M):
M0
80% (n = 99)
M1
20% (n = 25)
Tumor Stage
I
20% (n = 24)
II
28% (n = 35)
III
32% (n = 40)
IV
20% (n = 25)
Tumor localization
Right colon
23% (n = 29)
Transverse colon
6% (n = 7)
Left colon
29% (n = 36)
Rectum
42% (n = 52)
Median values (25th-75th percentile) of:
C-reactive protein (mg/L) (n = 100)a
4.5 (1.5–13)
B-haemoglogin (g/L) (n = 121)a
133 (108–142)
Mean corpuscular volume (fL) (n = 121)a
88 (82–92)
Serum carcinoembryogenic antigen (μg/L) (n = 116)a
3.1 (1.8–6.9)
Serum ferritin (μg/L) (n = 48)a
42 (13–88)
a
Number of subjects with available data
Fig. 2 The distribution of pre-diagnostic fecal calprotectin
(CALPRO®) in 124 patients with colorectal cancer
often a FC ≥ 50 µg/g than patients with left-sided CRC
(92% vs 74%; p = 0.027). The patients with right-sided
CRC also more often showed a FC ≥ 100 µg/g than the
patients with left-sided CRC but the difference was not
significant (72% vs 54%; p = 0.069).
There was no difference in the median FC values
between patients with tumor stage III/IV vs patients
with tumor stage I/II (Table 2), but there was a statistically significant correlation between FC levels and tumor
stage (rs 0.24; p = 0.007). Patients with tumors in stage I
had significant lower FC levels than patients with stage II
(p = 0.010), stage III (p = 0.026) and stage IV (p = 0.005).
Patients with tumors in stage IV had significantly higher
FC levels than patients with tumor stage III (p = 0.020),
but there was no difference in FC levels between patients
with tumor stage II and III (p =
0.318) or between
patients with stage II and IV (p = 0.248) (Fig. 3).
Patients with mucinous tumors showed significantly
higher FC levels compared to patients with non-mucinous tumors. There was no difference in FC levels
between patients in regard of tumor grade, vascular
invasion and perineural growth (Table 2).
Blad et al. BMC Cancer
(2022) 22:315
Page 5 of 9
Fig. 3 The distribution of pre-diagnostic fecal calprotectin (CALPRO®) in 124 patients with colorectal cancer according to tumor localization and
tumor stage
Table 2 Pre-diagnostic faecal calprotectin (FC) levels in patients with colorectal cancer (n = 124) in relation to tumor localization and
tumor characteristics. Statistics: Mann Whitney U test
% (n)
Median F-calprotectin, μg/g (25th-75th
percentile)
p-value
0.061
Tumor localization
Left-sided colorectal cancer
72% (n = 88)
122 (48–380)
Right-sided colorectal cancer
28% (n = 36)
206 (86–435)
Tumor stage
I-II
48% (n = 59)
122 (32–392)
III-IV
52% (n = 65)
172 (86–412)
0.157
Tumor grade
Low-grade
85% (n = 92)
150 (75–374)
High-grade
15% (n = 16)
201 (73–480)
0.647
Other tumor characteristics
Tumor type
Non-Mucinous
85% (n = 92)
146 (73–227)
Mucinous
15% (n = 16)
457 (122–596)
0.006
Vascular invasion:
No
85% (n = 84)
168 (77–392)
Yes
18% (n = 19)
94 (74–312)
0.395
Perineural growth
No
81% (n = 83)
150 (75–341)
Yes
19% (n = 20)
159 (74–424)
The association of FC and serum markers
A moderate but statistically significant correlation was seen
between FC levels and serum CRP levels (rs 0.31; p = 0.001).
Furthermore, a significant inverse correlation was seen
between FC levels and B-haemoglobin (rs -0.21; p = 0.019)
0.742
and a significant inverse correlation was seen between FC
levels and MCV (rs -0.30; p = 0.001). There were no significant correlations between FC levels and serum CEA (rs
0.12; p = 0.17) and serum ferritin (rs 0.045; p = 0.63).
Blad et al. BMC Cancer
(2022) 22:315
FC levels and survival
Twenty-eight patients (23%) deceased within 36 months.
There were no significant differences in survival time
between patients with FC ≥ 100 µg/g versus patients with
FC ≤ 100 µg/g (Fig. 4). In a Cox regression analysis with
the covariates: age at diagnosis, male gender, tumor stage
(III/IV vs I/II), tumor localization (right vs left), ASA use
and FC ≥ 100 µg/g, age at diagnosis (HR 1.09; CI 1.03–
1.15), tumor stage III/IV (HR 69.6; CI 8.66–560) and
right-sided tumor localization (HR 3.01; CI 1.31–6.92)
were associated with mortality. FC ≥ 100 µg/g showed no
association with survival (HR 0.61; CI 0.24–1.52) in the
Cox regression analysis.
Logistic regression
To adjust for possible confounders, we performed a logistic regression with FC as a dependent variable, and age,
gender, tumor localization (right vs left-sided), tumor
stage (III/IV vs I/II) and ASA use as independent variables. In the multivariate analysis for FC ≥ 50 µg/g, tumor
stage and right-sided localization were significantly associated with FC. Using FC ≥ 100 µg/g as dependent variable, tumor stage and the use of ASA was significantly
associated with FC (Table 3). Excluding the six patients
Page 6 of 9
with NSAID did not change the Hazard Ratios for tumor
localization and tumor stage.
Discussion
The aim of the present study was to investigate how the
tumor characteristics are associated with pre-diagnostic
FC levels in patients with CRC. In line with previous
studies [9, 19–22] we found a high prevalence of elevated
FC levels in patients with CRC, and 4 out of 5 patients
showed a FC ≥ 50 µg/g just prior to diagnosis.
A positive correlation between FC levels and the degree
of tumor growth (TNM stage) was shown in previous
studies [9, 10], and the present study confirms in a large
cohort that patients with CRC at more advanced stages
have higher FC levels. To our knowledge, this is the first
study that also showed a moderate significant association between the proximal location of CRC and FC levels. Nine out of 10 patients with right-sided CRC had a
FC ≥ 50 µg/g, which was significantly more common
than in patients with left-sided CRC. We found only one
published report on FC levels that included information
on tumor location [19]. When combining the patients
included in that previous study with our data, patients
with right-sided CRC still show significantly higher FC
Fig. 4 The survival of patients with colorectal cancer (n = 124) according to pre-diagnostic faecal calprotectin levels (Kaplan–Meier)
Blad et al. BMC Cancer
(2022) 22:315
Page 7 of 9
Table 3 Logistic regression with pre-diagnostic faecal calprotectin (FC) ≥ 50 μg/g and ≥ 100 μg/g as a dependent variable adjusted
for age, gender, tumor localization, tumor stage, and the use of acetylsalicylic acid in patients with colorectal cancer (n = 124).
OR = Odds Ratio
Patients with F-calprotectin ≥ 50 μg/g (n = 98)
Patients with F-calprotectin ≥ 100 μg/g
(n = 74)
Univariate OR ( 95th
confidence interval)
Multivariate OR (95th
confidence interval)
Univariate OR ( 95th
confidence interval)
Multivariate OR (95th
confidence interval)
Age
1.03 (0.99–1.08)
p = 0.118
1.02 (0.98–1.08)
p = 0.261
1.02 (0.99–1.07)
p = 0.114
1.02 (0.98–1.07)
p = 0.248
Male gender
1.62 (0.68–3.87)
p = 0.276
1.65 (0.64–4.27)
p = 0.297
0.98 (0.47–2.01)
p = 0.948
0.91 (0.41–1.97)
p = 0.804
Right-sided vs Left-sided colorectal cancer
3.89 (1.08–14.0)
p = 0.037
3.80 (1.01–14.3)
p = 0.048
2.17 (0.93–5.03)
p = 0.072
2.05 (0.85–4.94)
p = 0.108
Tumor stage III/IV vs I/II
2.52 (1.02–6.21)
p = 0.045
3.47 (1.27–9.42)
p = 0.015
1.76 (0.85–3.65)
p = 0.124
2.30 (1.04–5.10)
p = 0.039
The use of acetylsalicylic acid
6.41 (0.81–50.3)
p = 0.077
7.30 (0.86–62.2)
p = 0.069
3.43 (1.07–10.9)
p = 0.037
3.54 (1.03–12.2)
p = 0.045
levels than patients with left-sided CRC (median 214 µg/g
vs 129 µg/g; p = 0.03).
It is known that right-sided CRC is more clinically quiescent than, for example rectal cancers, and consequently
presents with symptoms at a more advanced stage
than distal tumors [23]. However, when using a logistic
regression model, adjusting for tumor stage, right-sided
CRC location still shows a significant association with
increased FC levels. In a recent review by Baran et al.
[24], the differences between left-sided and right-sided
CRC were investigated. The authors stated that there are
differences between right-sided CRC and left-sided CRC
in embryological origin, tumor histology and therapy
response. Right-sided CRC was predominately characterized by high microsatellite instability and mutations
in KRAS or BRAF in comparison to the left-sided tumors
that instead showed a higher chromosomal instability.
The high microsatellite instable tumors were shown to
carry more immunogenic mutation and histologically
resembled a lymphoid reaction similar to that seen in
Crohn´s disease. Previous research has argued that the
most likely mechanism for increased FC levels in patients
with CRC is an increased permeability of the tumor pathologic mucosa membrane that leads to high amounts of
neutrophils in the gut lumen. Another contributing factor to FC levels in patients with CRC could be an effect of
chemotactic stimuli from the tumor that recruits granulocytes containing calprotectin [25]. For example, calprotectin has been shown to reduce tumor cell growth by
inducing apoptosis of the cancerous cells [26].
Perhaps, a tumor located on the right-sided colon
shows a more immunogenic tumor characteristics than
a left-sided tumor and therefore presents with a higher
FC level. If this is so, adding a FC test to CRC screening
programs could improve the detection of right-sided
CRCs. Interestingly, the patients in our study showed a
positive correlation between serum CRP levels and FC
levels; this may reflect increased inflammatory activity
at the tumor site. However, in a study by Lehman et al.,
there was no correlation between histological inflammation at the tumor and FC levels [10].
Calprotectin in the stool has its source mainly from
the leakage of white blood cells into the lumen. Therefore, bleeding from the tumor could also be a cause of
an elevated FC level in a patient with CRC. A positive
FIT was common in the patients in our study, and both
B-haemoglobin and MCV inversely correlated to FC
levels in our patients. It is reasonable to presume that
a tumor that has reached a more advanced stage is also
easier to bleed. But on the other hand, it would require
a large volume of blood to produce significant increases
in FC levels, which indicates that factors other than
bleeding contribute to the rise in FC levels in patients
with CRC [27].
The present study has some limitations. The main
limitation is that the study included only approximately
10% of all patients with a CRC diagnosed during the
study period. For example, in the cohort of patients
recruited 2013 to 2017, the doctor´s decision to test
for FC in most cases was probably due to the investigation of diarrhea with other diagnoses other than CRC
in focus. The slightly higher proportion than expected
of patients with rectal cancer in our study might have
been due to rectal cancers that affect defecation more
than for other CRCs. GI symptoms often present late
when the tumor has reached a more advanced stage.