Affordable-Accessible Housing In A Dynamic City potx
Bạn đang xem bản rút gọn của tài liệu. Xem và tải ngay bản đầy đủ của tài liệu tại đây (1.38 MB, 52 trang )
www.vtpi.org
250-360-1560
Todd Alexander Litman © 2011
You are welcome and encouraged to copy, distribute, share and excerpt this document and its ideas, provided the author is
given attribution. Please send your corrections, comments and suggestions for improvement.
Affordable-Accessible Housing In A Dynamic City
Why and How To Increase Affordable Housing Development In
Accessible Locations
12 March 2013
Todd Litman
Victoria Transport Policy Institute
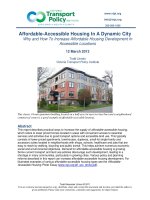
This classic 34-unit apartment building located on a half-acre lot near two bus lines and a neighborhood
commercial center is a good example of affordable-accessible housing.
Abstract
This report describes practical ways to increase the supply of affordable-accessible housing,
which refers to lower priced homes located in areas with convenient access to essential
services and activities due to good transport options and accessible land use. This typically
consists of lower-priced apartments, townhouses, duplexes, small-lot single-family and
accessory suites located in neighborhoods with shops, schools, healthcare and jobs that are
easy to reach by walking, bicycling and public transit. This helps achieve numerous economic,
social and environmental objectives. Demand for affordable-accessible housing is growing.
Some current transport and land use policies discourage such development, leading to a
shortage in many communities, particularly in growing cities. Various policy and planning
reforms described in this report can increase affordable-accessible housing development. For
illustrated examples of various affordable-accessible housing types see the Affordable-
Accessible Housing Photo Essay (www.vtpi.org/aff_acc_photo.pdf).
Affordable-Accessible Housing In A Dynamic City
Victoria Transport Policy Institute
2
Contents
Executive Summary 3
Introduction 6
Defining Affordability 9
Defining Accessibility 14
Defining Affordable-Accessible Housing 15
Affordable-Accessible Housing Benefits and Cost 17
Dynamic City Planning 19
Barriers to Affordable-Accessible Development 21
Affordable Housing Economic Analysis 22
Affordable-Accessible Housing Development Strategies 28
Examples 37
Conclusions 43
References 46
Affordable-accessible housing typically consists of lower-priced, low-rise apartment buildings,
townhouses and small-lot single-family homes located in urban neighborhoods with nearby services,
good walking conditions, and moderate- to high-quality public transit service.
Affordable-Accessible Housing In A Dynamic City
Victoria Transport Policy Institute
3
Executive Summary
This report integrates three planning issues:
1. Affordability. Experts recommend spending less than 32% of total household budget on
housing (rents or mortgages, basic utilities and maintenance) and less than 18% on
transportation, or 45% on housing and transport combined. Many lower- and middle-income
households exceed these levels (Figure ES-1).
2. Accessible (also called “location efficient”) development. People who live or work in more
accessible, multi-modal areas have better access to goods, services and activities, tend to own
fewer vehicles, drive less, and rely more on alternative modes than in more automobile-
oriented, sprawled communities.
3. Dynamic planning. Communities must respond to changing demands and conditions. Current
demographic and economic trends are increasing demand for affordable-accessible housing,
and increasing the benefits to society of accommodating this increased demand.
Affordable-accessible housing refers to lower priced housing located in areas with good access to
basic services and activities. Increasing the supply of affordable- accessible housing can provide
various savings and benefits, including reduced homelessness and associated problems,
government savings, consumer savings, improved safety and public health, energy conservation
and greenspace preservation. It increases economic, social and environmental sustainability.
Figure ES-1 Housing and Transport Expenditures by Income Quintile (BLS 2007)
Housing and transport are unaffordable for many lower- and medium-income households.
Many current policies and planning practices discourage accessible-affordable housing
development. These include restrictions on building height, density and type; generous minimum
parking requirements; and fees and taxes structured to favor fewer, more expensive units. Many
of these barriers reflect inaccurate assumptions (affordable housing occupants are dangerous),
and outdated policies (generous parking supply is necessary and beneficial to society). Dynamic
cities must adjust these policies to reflect growing demands for affordable-accessible housing.
Affordable-Accessible Housing In A Dynamic City
Victoria Transport Policy Institute
4
There are many possible ways to increase housing and transport affordability, as summarized in
Table ES-1, but some are better than others because they reduce rather than shift costs and
support other strategic objectives such as reducing vehicle traffic and sprawl. For example,
special rent subsidies benefit some groups but displace others, and rent controls reduce the
incentive to develop lower-priced housing. Urban fringe development reduces land costs but
increases transport costs (including user costs, accidents and pollution emissions) and sprawl-
related costs (including higher costs of providing public services, and openspace loss). The
Housing Affordability Analysis Spreadsheet developed for this study can help evaluate the effects
of various policy changes on total housing and transport affordability.
Some relatively modest policy reforms can greatly improve affordability and accessibility, and
therefore the lives of physically and economically disadvantaged people. These include changes
to zoning codes to allow more diverse housing types, reduced parking requirements, improving
walking and cycling conditions, and improved public transit service. Even if the new housing is
moderate price, it will contribute to future affordable housing supply as it depreciates.
Figure ES-2 illustrates housing and transport costs for various housing types and locations.
Dashed lines indicate the maximum combined housing and transport expenditure levels considered
affordable (up to 45% of household income) for each income quintile (fifth of total households).
Figure ES-2 Annualized Expenses Compared
$0
$10,000
$20,000
$30,000
$40,000
$50,000
$60,000
Inner Urban
Outer Urban
Suburban
Inner Urban
Outer Urban
Suburban
Inner Urban
Outer Urban
Suburban
Inner Urban
Outer Urban
Suburban
Annualized Costs
Transportation expenses
Housing operating costs
Parking costs
Construction costs
Land costs
Single-Family
Townhouse
1,000 sq. ft Apt.
600 sq. Ft. Apt
First ($4,618)
Second ($12,349)
Third ($21,238)
Fourth ($33,341)
Fifth ($71,313)
This figure compares housing and transport costs of various housing types. Dashed lines indicate the
maximum combined housing and transport expenditures considered affordable (up to 45% of household
income) for each income quintile (fifth of total households).
For small low-income households (one or two people with less than $2,400 monthly budget), the
most practical affordable housing options are usually secondary suites, small apartments or
shared single-family houses in accessible areas where services and activities are easily reached
without a car. Multi-modal accessibility is particularly important for people who cannot drive
due to disabilities or legal constraints. Such housing is not appropriate for all households, but it
should be available to anybody who needs it.
Affordable-Accessible Housing In A Dynamic City
Victoria Transport Policy Institute
5
Table ES-1 Affordable-Accessible Housing Development Strategies
Strategies
Impacts
Ineffective and Sometimes Harmful
Cheap suburban development
Reduces housing costs but increases transport and sprawl costs
Rent control
Benefits existing residents but reduces the incentive to build more
lower-priced housing
Forbidding rental-to-owner conversions
Benefits existing residents but reduces incentive to build more
lower-priced housing
Urban blight (allow some neighborhoods to
become undesirable)
Reduces housing costs but harms communities and concentrates
poverty
Targeted housing subsidies
Benefits people who receive subsidies, but not others
Effective But Costly
General housing construction and purchase
subsidies
Reduces total housing costs, but does little to increase overall
affordability
Inclusionary zoning
Helps some households purchase homes but seldom includes
rentals and may reduce total housing development
Large social housing developments
Concentrates poverty
Subsidizing suburban transportation
Requires significant subsidies and imposes external costs
Most Effective and Beneficial
Affordable housing targets
Encourages communities to accept affordable housing
Address community concerns
Reduces neighborhood opposition to affordable housing
Density bonus
Encourages developers to build more affordable housing
Density requirements
Encourages developers to build more housing
Structure Fees and Taxes to Favor Affordable-
Accessible Development
Reduces the costs of affordable-accessible housing compared with
more costly and sprawled housing
Allow and Encourage Secondary Suites
Encourages homeowners to provide rental housing
Improve design process
Improves design quality which can reduce opposition
Affordable housing maintenance programs
Preserves existing affordable housing stock
Smart growth reforms
More compact development, which reduces costs such as parking
Improve affordable transportation options
Improves accessibility and reduces household costs
Implement transportation management policies
Supports use of efficient modes
Expedite development review
Reduces affordable housing development costs and delays
Reduced and more accurate parking requirements
Reduces parking costs, particularly for affordable-accessible
housing
Unbundle parking
Reduces housing costs for households with low vehicle ownership
More accessible, multi-modal suburban
development
Reduces housing and transportation costs in suburban areas
Identify parcels suitable for affordable-accessible
development
Helps developers find sites for affordable, infill development
Dynamic zoning
Allows development policies and zoning codes to respond to
changing demands
Brownfield remediation
Makes contaminated land available for development
Provide free or inexpensive land
Encourages development of affordable housing.
Resource efficiency design
Reduces occupant utility costs
Targeted tax and fee exemptions
Reduces affordable-accessible housing costs
More favorable tax policies
Reduces affordable-accessible housing costs
Allow and encourage condominium rentals
Increases supply of rentals and the profitability of condominiums
This table summarizes strategies identified in this study to increase affordable-accessible housing supply.
Affordable-Accessible Housing In A Dynamic City
Victoria Transport Policy Institute
6
Introduction
People need adequate housing to be healthy, happy and successful. Housing inaffordability is a
major problem, particularly in growing cities where affordable housing demand exceeds the
existing stock of older, less expensive residences. Increasing housing affordability is both an act
of generosity and a practical way to solve problems and achieve various planning objectives:
Reduced homelessness and associated problems.
Financial savings and flexibility to lower-income households.
Accommodating more lower-wage workers, students and retirees, thus supporting local
economic development.
Yet, despite broad support for more affordable urban housing, many current planning practices
discourage such development, particularly within existing urban neighborhoods. Some obstacles
reflect legitimate concerns, such as traffic and parking congestion, that can be addressed with
appropriate policies, but many objections reflect outdated and inaccurate assumptions, such as
fear that affordable housing attracts dangerous residents and reduces nearby property values.
Castana Development Example (www.cookstreetvillage.ca)
The Cook Street Village is a popular neighborhood commercial center in Victoria, BC. It contains
about fifty businesses along six blocks. Buildings on the street range from one to four stories.
In 2003 a developer proposed building the Bohemia, a three-story mixed-use commercial and
residential building with 26 residential units, and the Castana, a four-story building with 45
residential units on land previously occupied by three single-family homes. A third of the units
would be moderate-price rentals. The city council rejected the proposal due to objections by the
neighborhood association and local residents to the project’s excessive size, parking and traffic
generation, and modern design. In 2006 the developer proposed an alternative, three-story design
with 19 units in the Bohemia and 22 units in the Castana, which was approved. The total number of
residential units declined from 71 to 51. These units are larger and none will be rentals.
This illustrates typical resistance to affordable-accessible development. Community objections lead
developers to build fewer, higher-priced units. Affordable rental units are the first to be eliminated.
Affordable-Accessible Housing In A Dynamic City
Victoria Transport Policy Institute
7
Some programs to address housing inaffordability target specific groups with special housing
needs, such as people with disabilities or single-parent households, but such programs only
address a small share of the problem. Most households burdened by unaffordable housing are
lower-income workers, students and pensioners that fail to quality for special housing support.
Affordable housing programs that favor specific groups can reduce housing affordability for
other groups, unless they increase total affordable housing supply.
True affordability requires more than low rents and mortgages. Housing is not really affordable
if located in isolated areas with high transportation costs. True affordability therefore requires
affordable-accessible housing, that is, appropriate, lower-priced housing located where basic
services and activities are easy to access without using an automobile. Affordable-accessible
housing is the opposite of gentrification: it allows households with diverse incomes, abilities and
needs to live together in attractive, diverse and dynamic neighborhoods.
In traditional peasant societies, rural land reform is often promoted as a way to increase poor
household’s economic opportunity. In modern, industrial societies, affordable urban housing
plays a similar role: it allows poor households to access economic opportunities, including better
education, employment and affordable services.
Affordable-accessible housing development was common at most times and most parts of the
world. Apartments and small houses were constructed where residents could easily walk to
services and reach jobs by public transit. However, between 1970 and 2000 relatively little
affordable-accessible housing was built in North America, leading to a shortage of such housing
in many cities. Many factors contributed to this decline, some of which reflect outdated policies
and planning practices. It now makes sense to reexamine and reform such outdated policies.
There are many possible ways to increase housing affordability, but some are better than others
because they:
Reduce rather than shift costs, and so minimize subsidy requirements.
Reduce total costs, including utilities and transport expenses, not just rents and mortgages.
Increase consumer options, allowing households to choose the bundle of housing and
transport that best meets their needs.
Support other strategic planning objectives such as reducing government costs, energy
consumption, pollution emissions and land consumption.
This report investigates these issues. It identifies current policies that discourage affordable
housing development in accessible locations, explores why such policies exist, and describes
strategies that reduce the costs of constructing basic housing in accessible locations with the
hope that this will increase supply and reduce prices for such housing. These strategies support
and are supported by other smart growth and sustainable transport policies.
Affordable-Accessible Housing In A Dynamic City
Victoria Transport Policy Institute
8
Memo From Future Self: Hope For The Best But Prepare For the Worst
Todd Litman, Planetizen Blog (www.planetizen.com/node/39418).
Planning issues often seem to be conflicts between the interests of different groups, such as residents
versus developers, or motorist versus transit users. But planning concerns the future, so it can consist of
conflicts between the interests of our current and future selves.
For example, the city of Vancouver is developing an Ecodensity Policy that increases infill development,
particularly affordable housing and commercial development along major public transit corridors. It’s a
controversial policy with lots of opposition from residents who assume that it contradicts their interests. “It
will just increase traffic and parking problems,” they object. But they should think again. They may want
affordable housing and better transport options in the future.
For example, a relative of mine who opposes Ecodensity lives in a relatively inexpensive apartment in a
desirable Vancouver neighborhood and drives most days to work. Sometime in the future her landlord will
probably raise the rent or redevelop the building, forcing her to search for more affordable housing, while
increasing urban traffic, rising fuel prices and aging may make driving more difficult, forcing her to search
for more affordable commute options. Her future self may benefit a lot from Ecodensity. Even if she stays
in her apartment and continues to drive she will benefit from overall reductions in housing prices and
traffic congestion. Vancouver housing will not become really cheap, nor will traffic congestion disappear,
but Ecodensity can reduce these problems, so housing costs and traffic congestion never become extreme.
Imagine what a message from yourself a couple decades in the future might say concerning the type of
development policies your community should establish now. If you are lucky and selfish the message
might favor restrictions on affordable, infill housing and automobile-oriented transport planning. However,
if your future self might be physically disabled or poor, or concerned about physically and economically
disadvantaged neighbors, your future self will want lots of affordable housing located in areas with good
travel options, and plenty of local services that support healthy and happy lifestyles, such as local parks
and inexpensive shops. Wow, we just reinvented Ecodensity!
Planning decisions we make today will affect our quality of life in coming years and decades. Since our
future condition is unknowable, it makes sense to create communities that do a really good job of caring
for disadvantaged people, because that could be us.
Memo from future self: Hope for the best but prepare for the worst by increasing the supply of affordable
housing and transport options in the community where you will want to live.
Affordable-Accessible Housing In A Dynamic City
Victoria Transport Policy Institute
9
Defining Affordability
Affordability refers to people’s ability to purchase essential (or basic) goods and services, such
as adequate housing, healthy food, and medical care. It means that basic living expenses are less
than a household’s income (Litman 2007).
Affordable housing generally means that total costs (rents, mortgages, basic utilities, and
maintenance) of appropriate housing total less than 30% to 35% of a household’s income
(Hulchanski 1995). For a household with $1,800 month net income, this means less than $630
per month in total housing expenses. The term affordable housing sometimes refers to subsidized
social housing for people with special needs (physical or mental disability, severe poverty, etc.),
but that is actually a minor portion of total affordable housing demand. Most affordable housing
is occupied by low-wage workers, students, and people living on pensions, who pay
unsubsidized rents, sometimes called workforce housing. The figure below illustrates various
affordable housing needs, ranging from a small group that needs emergency shelter or subsidized
housing, to a much larger group that needs affordable rental or owned housing.
Figure 1 Affordable Housing Needs
Emergency shelters - Short-term housing for homeless people
Transitional housing - Medium-term housing for previously
homeless or addicted people
Social housing - Subsidized housing for people with
disabilities and other special needs.
Affordable rental housing - Rental housing affordable to
low- and medium-income households
Affordable home ownership - Housing affordable for
purchase by low- and medium-income households
Affordable housing needs range from a small number of emergency shelters serving people with acute
needs, to a large number of affordable rental and owned homes.
In some markets, housing becomes affordable as older housing stock ages. Housing prices (both
purchase and rents) typically decline 20-40% over a two decade period due to wear and outdated
design features, and more if the building or its neighborhood become severely dilapidated. For
example, if a new 2-bedroom apartment rents for $2,000 per month, a 20-year-old apartment of
the same size will typically rent for $1,200 to $1,600, or even $800 to $1,000 if looks shabby or
is located in a neighborhood considered undesirable. If the degradation is superficial (the
building is structurally secure and functional, and the neighborhood is not unsafe, it just looks
old and the appliances are outdated), the result is true affordable housing. However, if the only
low-priced housing available is unsafe or dysfunctional, it cannot really be considered
affordable.
Affordable-Accessible Housing In A Dynamic City
Victoria Transport Policy Institute
10
Figure 2 Typical Housing Price Declines
0%
20%
40%
60%
80%
100%
0 10 20 30 40 50
Years
Portion of Initial Housing Price
Basic maintenance
Referbished after 20 years
Poorly maintained or
degraded neighborhood
Housing prices tend to decline over time, resulting in affordable housing. Poorly maintained housing
located in undesirable neighborhoods may be very cheap, but cannot be considered truly affordable.
Prior to 1950, developers often built single-room apartments and apartments over shops, and
between 1950 and 1970 many developers built inexpensive wood-frame apartments, but between
1970 and 2000, fewer new moderate-priced apartments were built in North American cities, so
the stock of affordable apartments stopped expanding. The current shortage of affordable
housing in growing North American cities may be explained, in part, by the lack of construction
of moderate-priced apartments during this period. Increasing medium-priced housing supply
(such as building modest apartments) probably increases housing affordability in the short-term
by allowing some households to move up from the older, cheaper housing, and in the long-term
by adding to the stock of housing that will become affordable due to aging.
Affordable transportation generally means that less than 20% of household budgets are devoted
to basic transport, that is, access to essential services and activities such as health care, school,
work, basic shopping, plus some social and recreational activities. For a household with $1,800
monthly net income, this means less than $360 per month spent on transport.
Households often face tradeoffs between housing and transportation costs: cheaper homes are
often in more isolated locations where basic transport is more expensive. As a result, many
experts recommend using an affordability index that combines housing and transport costs (CNT
2008). Housing and transport should together total less than 45% of income. For a $1,800 net
monthly income household this means less than $900 total housing and transport expenses.
How affordability is defined and calculated can vary, leading to confusion. Maximum budget
shares range from 30% to 35% for housing and 45% to 50% for housing and transport, but even
these values may be excessive to allow low-income households to purchase other necessities
such as healthy food and healthcare (Williams-Derry 2010). Some housing cost data consider
only rents and mortgages, while others include maintenance and utility costs. Calculations may
be based on gross incomes (including taxes), net income (after taxes), or expenditures.
Affordable-Accessible Housing In A Dynamic City
Victoria Transport Policy Institute
11
Table 1 shows how average household budget expenditures changed during the last century.
Housing and transportation expenditures both increased significantly during this period, offset by
declines in food and clothing expenditures. Figure 3 illustrates these trends.
Table 1 Average Household Expenditures (Johnson, Rogers and Tan 2001)
Component
1917–19
1950
1960–61
1972–73
1986–87
Housing
26.8%
26.0%
29.2%
29.3%
33.7%
Transportation
3.1%
13.8%
15.1%
24.1%
25.7%
Food
41.1%
32.5%
26.0%
22.6%
19.4%
Clothing
17.6%
11.6%
10.3%
8.4%
5.2%
Health care
4.7%
5.1%
6.6%
4.7%
4.0%
Other
6.7%
11.0%
12.8%
10.9%
12.0%
This table indicates U.S. urban household expenditures during the last century.
These shifts may reflect increased food and clothing affordability, and increased housing and
transportation quality (larger and more comfortable homes, more motorized travel, more total
mobility), but they may also reflect a reduction in housing and transport affordability, that is, a
decline in the quality of affordable transport options (walking, cycling, public transit, etc.), and
less accessible land use patterns which increase the amount of travel required to access activities,
forcing people to spend more money for a given level of accessibility. This increase in transport
costs tends to be particularly burdensome to lower-income households, as described below.
Figure 3 Housing & Transport Expenditure Trends (Johnson, Rogers and Tan 2001)
0%
5%
10%
15%
20%
25%
30%
35%
40%
1917–19 1950 1960–61 1972–73 1986–87
Portion of Household Expenditures
Housing
Transport
This figure illustrates how housing and transportation expenditures grew as a portion of household
budgets during the Twentieth Century.
Table 2 shows selected household expenditures by income quintile (fifth of households) from the
Bureau of Labor Statistics’ Consumer Expenditure Survey. This indicates that many lower
income households spend more on housing and transportation than considered affordable. Even
in the lowest income quintile (households earning an average of $10,531) spent $3,242 on
average on transport, primarily automobiles.
Affordable-Accessible Housing In A Dynamic City
Victoria Transport Policy Institute
12
Table 2 2007 U.S. Household Budget Data by Income Quintile (BLS 2007)
Quintile
All
Lowest
Second
Third
Fourth
Highest
Income before taxes
$63,091
$10,531
$27,674
$46,213
$72,460
$158,388
Average annual expenditures
$49,638
$20,471
$31,150
$42,447
$57,285
$96,752
Persons
2.5
1.7
2.2
2.5
2.9
3.2
Earners
1.30
0.50
1.00
1.40
1.80
2.00
Vehicles
1.9
0.9
1.5
2
2.4
2.8
Housing
$16,920
$8,285
$11,390
$14,388
$19,017
$31,492
Housing-percent income
26.8%
78.7%
41.2%
31.1%
26.2%
19.9%
Transport
$8,758
$3,242
$5,717
$7,926
$11,058
$15,831
Transport-percent income
13.9%
30.8%
20.7%
17.2%
15.3%
10.0%
Housing and Transport
$25,678
$11,527
$17,107
$22,314
$30,075
$47,323
Housing and Transport- % income
40.7%
109.5%
61.8%
48.3%
41.5%
29.9%
This table indicates that housing and transportation are unaffordable to a major portion of households.
Figure 4 illustrates how the portion of household budgets devoted to housing and transportation
tend to be unaffordable for lower income households.
Figure 4 Housing and Transport Expenditures by Income Quintile (BLS 2007)
The portion of household budgets devoted to housing and transport is unaffordable for most lower-
income households (those in the first and second quintile).
Several studies examine how housing and transport affordability vary by geographic location
(CNT 2010). Lipman (2006) found that transport costs range from about 10% in multi-modal
communities up to about 25% in automobile dependent communities, as illustrated in Figure 5.
Makarewicz, et al. (2008), ULI (2009) and CHP (2009) all found similar patterns: lower-income
households tend to bear excessive housing costs in urban areas, and excessive transport costs in
suburban areas. The greatest total burden tends to occur in automobile-dependent areas.
Affordable-Accessible Housing In A Dynamic City
Victoria Transport Policy Institute
13
Figure 5 Share of Income Spent on Housing and Transport (Lipman 2006)
The portion of low- and moderate-income household budgets devoted to transport and housing increases
with distance from urban centers. Lower housing costs are more than offset by higher transport costs.
Housing foreclosure rates tend to be higher in more automobile-dependent areas, indicating high
financial risk (NRDC 2010; Leinberger 2010). In such areas, transport costs are high and
households are vulnerable to fuel prices spike (Figure 6), vehicles failures and traffic accidents.
Residents of more accessible locations enjoy more options and less risk.
Figure 6 Share of Income Spent on Fuel (Krauss 2008)
Rural residents face
major financial
burdens when fuel
prices spike.
Affordable-Accessible Housing In A Dynamic City
Victoria Transport Policy Institute
14
Defining Accessibility
Accessibility (or just access) refers to the ease of reaching goods, services, activities and
destinations, which together are called opportunities (Levinson and El-Geneidy 2006).
1
For
example, grocery stores provide access to food; libraries and the Internet provide access to
information; paths, roads and airports provide access to destinations and therefore activities (also
called opportunities). Various factors affect accessibility (Litman 2008):
Mobility (ease of physical travel).
Transportation options (quality of walking and cycling conditions, rideshare and public transit
services, automobile transport, carsharing and taxi services).
Affordability (costs of transport options relative to incomes).
Land use accessibility (the geographic distribution of services and activities).
Connectivity (connections among roads and paths, and therefore the directness of travel).
Mobility substitutes (quality of telecommunications and delivery services).
User information (ease of obtaining information on transport options).
Increased accessibility tends to reduce transport costs and improve economic opportunities
(better shopping, schooling and employment options), particularly for people with disabilities
and low incomes. It is therefore important that affordable housing be available in accessible
locations, with some units designed to accommodate people with disabilities.
Table 3 compares transport options and costs for a typical moderate-income, two adult
household. In a very accessible location the household requires no vehicles and has low transport
costs. In a moderately accessible location it owns one vehicle and has moderate transport costs.
In an automobile-dependent location it owns two vehicles and bear high transport costs.
Table 3 Typical Household Transport Costs By Geographic Location
Very Accessible and
Multi-modal
Moderately Accessible
and Multi-Modal
Automobile
Dependent
Typical examples
Well-planned transit-
oriented development
Older urban neighborhood
and new transit-oriented
development
Conventional suburban or
rural development
Transport options
Poor automobile travel.
Good quality walking,
cycling, public transit,
carsharing, taxi, telework
and delivery services.
Moderate quality
automobile, walking,
cycling, public transit, taxi
and telework
High quality automobile.
Moderate to poor quality
walking, cycling, taxi and
telework.
Mobility for non-drivers
Good
Moderate
Poor
Vehicle ownership
0
1
2
Annual transport expenses
$2,000
$4,000
$8,000
Households can significantly reduce transportation costs by choosing accessible locations.
1
Accessibility also refers to facilities and services intended to accommodate people with disabilities, but planners
increasingly use the term universal design for this objective.
Affordable-Accessible Housing In A Dynamic City
Victoria Transport Policy Institute
15
Defining Affordable-Accessible Housing
Affordable-accessible housing refers to adequate quality housing, affordable to household
budgets, located in accessible locations where a vehicle is not needed to access common services
and activities, so lower-income households can spend less than 45% of their total budget on
housing and transport. It typically consists of basic, low-rise (2-4 story) apartments and
condominiums, townhouses, duplexes, small-lot single-family, and secondary suites, located in
neighborhoods with commonly-used services (stores, schools, healthcare, parks), good walking
and cycling conditions, and high quality public transit service.
This integrates several planning concepts:
Affordable housing refers to inexpensive but adequate housing, but does not explicitly consider
accessibility and transport costs and so can be located in inaccessible areas. To their credit, many
affordable housing advocates do consider accessibility an affordable housing planning objective.
Location-efficient development refers to residential and commercial development in accessible
areas with relatively low transportation costs.
Livable community refers to a community with affordable and appropriate housing, supportive
community services, and adequate mobility options, which together facilitate personal
independence and engagement of residents in civic and social life (AARP 2005).
Transit-oriented development refers to residential and commercial development located with easy
access to high quality public transit service. Proponents often try to include a mix of housing
options, including some affordable rental units.
New urbanism and smart growth refer to compact, mixed, multi-modal urban development. This
includes mixing housing types (single-family, townhouses, apartments, etc.) and price ranges.
Affordable-Accessible Housing Checklist
Inexpensive but adequate housing (costs less than 35% of household budgets).
Energy efficient (to reduce costs and maintain comfort).
Some units designed to accommodate people with disabilities.
Accessible location (commonly-used services located within an easy 10-minute walk and
numerous jobs located within a convenient 30-minute transit trip). This includes:
o Affordable food stores
o Coffee shops and restaurants
o Medical and dental services
o Schools
o Parks and recreation centers
o Public transit
Multi-modal (high quality walking, cycling, public transit, carsharing and taxies).
Universal design (transportation facilities and services accommodate people with disabilities).
Affordable telephone and Internet service.
Unbundled parking (so households are not forced to pay for parking spaces they do not need).
Transportation and housing total less than 45% of household budgets.
Affordable-Accessible Housing In A Dynamic City
Victoria Transport Policy Institute
16
Various housing types can be affordable-accessible.
Small-lot urban neighborhood housing. Stand-alone houses on 3,000 to 6,000 square foot (e.g.,
50 x 100 ft) lots.
Secondary suites and accessory units. Additional units incorporated into single-family homes,
including basements, attics, lane houses, and converted garages.
Duplexes and townhouses (row houses). Houses with one or two shared walls, and ground-floor
entrances (each unit has its own front door).
Lowrise (2-4 story) apartments and condominiums. These can be affordable, particularly if built
using simple, standard, woodframe construction, and no elevators (which add significant costs).
Highrise (5+ stories) apartments and condominiums. These buildings tend to be more costly to
construct but may be cost effective where land prices are high.
Residential-over-commercial. It is often possible to build housing over ground-floor retail.
Parking lot redevelopment. Many older buildings and shopping malls have parking lots suitable
for development if managed more efficiently or replaced by parking structures (CNT 2006).
Non-residential conversions. Some older industrial or commercial buildings in accessible
locations are suitable for conversion to residential.
Affordable-accessible housing development was common in the past and continues in many parts
of the world. Until about 1975, private developers built inexpensive apartment buildings and
other compact housing types in urban areas, but such development has declined. Between 1950
and 2000 many cities experienced population and economic declines, which created abundant
affordable housing, but exacerbated various problems: concentrated poverty and associated
social problems, potential workers isolated from jobs, reduced building maintenance and
infrastructure investment, and increased sprawl. Many factors that contributed to urban decline
are now reversing. Current trends are increasing demand for affordable-accessible housing
(Leinberger 2008; Litman 2009; Nelson 2006):
Aging population. The portion of residents over 65 years of age is projected to approximately
double between 2010 and 2050. Older people tend to demand smaller, more accessible homes.
Smaller households with fewer children. Household size and the portion of households with
children declined significantly in recent decades.
Stagnant incomes. Real wage and incomes are likely to decline among lower-income households
(the first two income quintiles) due to deindustrialization and global competition.
Rising fuel prices. As fuel prices rise, demand for more accessible locations tends to increase.
Growing congestion. As traffic and parking congestion increase, the value of more accessible,
multi-modal locations and alternative modes tends to increase.
Changing attitudes about urban living and investment value. Cities are increasingly considered
exciting, healthy and attractive places for successful households to reside. Recent housing market
trends increase the financial return on urban real estate investments.
Health and environmental concerns. Research indicates that urban living tends to be safer,
healthier and protects the environment compared with sprawl (CDC 2005; Ewing, et al. 2007).
Affordable-Accessible Housing In A Dynamic City
Victoria Transport Policy Institute
17
Affordable-Accessible Housing Benefits and Cost
Compared with more costly, automobile-oriented housing, affordable-accessible housing
provides various economic, social and environmental benefits:
Reduced homelessness and associated problems. This type of housing is suitable for people who
are currently, or at risk of becoming, homeless. Stable housing, in turn, improves physical and
mental health, increases economic opportunity (it helps residents obtain education and
employment), and reduces problems such as public drunkenness.
Allows aging-in-place. Many people are forced to move to a new community when they downsize
or become unable to drive. Affordable-accessible housing suitable for seniors and people with
disabilities allows residents to remain in their communities through lifecycle changes.
Increased household savings and affordability. Affordable-accessible development tends to
reduce housing and transport costs, providing savings, particularly for low-income households.
Congestion reduction. Residents of more accessible, multi-modal locations tend to drive less, and
so cause less traffic congestion.
Road and parking facility cost savings. Residents can own fewer motor vehicles and drive less,
which reduces parking congestion, and parking costs to governments and businesses.
Accident reductions. Urban residents tend to have significantly lower (typically less than half) per
capita traffic fatality rates than residents of sprawled locations.
Energy conservation and emission reductions. Compact, multi-family housing tends to consume
less energy for heating and cooling than single-family housing, and urban residents tend to
consume less fuel and emit less pollution than residents of automobile-dependent locations.
Increased personal security. Increasing pedestrian traffic and public surveillance tends to increase
personal security in urban neighborhoods.
Smart growth benefits. More compact, accessible urban development tends to reduce public
service unit costs, and preserve openspace (Litman 2005a).
Increased economic opportunity. Improved access to education and employment tends to increase
employment rates and wages, particularly for people with disabilities.
Economic development benefits. In many communities, high housing and transport costs limit the
pool of lower-wage employees, and therefore local business development, and discourage
students, pensioners and artists from living in a particular area, thereby reducing the economic
and social activities they support. More compact, accessible, development also increases
economic development by supporting agglomeration efficiencies.
Increased transit system efficiency. Affordable-accessible housing concentrates more transit users
in areas with good transit service, increasing load factors and reducing cost per passenger-mile.
Affordable-accessible housing is the opposite of gentrification (the displacement of lower-
income households by wealthier households as urban neighborhoods become more attractive). It
allows households with diverse incomes, abilities and needs to live together in attractive, diverse
and dynamic neighborhoods. It allows lower-income employees to live close to businesses,
economically and socially disadvantaged children to attend good schools, and creative people
(students, artists and entrepreneurs) to live, work and participate in a community. It is a key
strategy to support social diversity and economic innovation.
Affordable-Accessible Housing In A Dynamic City
Victoria Transport Policy Institute
18
However, affordable-accessible housing can also impose some costs.
Smaller lawns and gardens, and less access to openspace.
Reduced privacy and quiet. Residents of multi-family housing and compact neighborhoods tend
to have less visual privacy and are exposed to more noise than in suburban locations.
Lost views and sunlight. Tall buildings often block views and solar access.
Increases in some development costs. Some development costs are higher in urban areas,
including sidewalks and stormwater management.
Increases in some local public service costs. Lower-income households may increase demand for
certain public services, including schooling, welfare, and public transportation.
Increased transit crowding. Increases in peak-period transit ridership without increased service
can lead to crowding.
Critics sometime argue that affordable-accessible housing increases social problems and costs
such as poverty, crime, drug abuse, alcoholism, and mental illness, but this is a misconception.
Although lower-priced urban housing is sometimes associated with social problems, this does
not mean that increasing the supply of affordable-accessible housing will increase these
problems. On the contrary, increasing affordable-accessible housing supply can reduce these
problems by giving poor, addicted and mentally disturbed people more stability and opportunity.
Most affordable-accessible housing residents are responsible citizens, including lower-wage
workers, students and pensioners.
It is understandable that individual residents and neighborhoods oppose nearby affordable
housing projects, due to fear of local impacts from concentrated poverty, drug abuse, alcoholism,
and mental illness. However, this does not justify public policies that discourage affordable-
accessible housing development. If such development becomes more widespread many of the
impacts people fear will be less concentrated and decline overall.
Affordable-Accessible Housing In A Dynamic City
Victoria Transport Policy Institute
19
Dynamic City Planning
To be economically and socially successful cities must be dynamic, that is, they must respond to
changing demands and conditions. For example, cities must accommodate new transport modes
(ports, railroads, roadways, airports, etc.) and utilities (water, sewage, gas, electricity, telephone,
cellular phone, wireless, etc.), accommodate population and business growth by expanding
development opportunities and public services, and respond to changing housing needs by
supporting development of housing types that satisfy unmet demands.
During most of the Twentieth Century, as automobile ownership increased and cities became
more dispersed, there was sufficient urban housing and a shortage of suburban housing stock.
For reasons mentioned earlier (aging population, rising fuel prices, changing consumer
preferences, etc.), demand is shifting to smaller, more accessible housing. Suburbs will not be
abandoned altogether but most demand for large-lot suburban housing will be satisfied by
existing stocks, as Baby Boomers downsize and sell their homes (Litman 2009; Nelson 2006).
The greatest unmet housing needs will be for smaller homes in accessible locations to house the
growing number of young adults and seniors.
Figure 7 U.S. Demand For Housing By Type (Nelson 2006)
0
20,000
40,000
60,000
80,000
100,000
120,000
140,000
Current Supply 2025 Demand
Units (thousands)
Attached
Small Lot
Large Lot
Housing market demand analysis based on consumer preference surveys indicates that during the next
two decades demand for large-lot housing will decline slightly, so current supply is sufficient to meet
future needs, but demand for small lot and attached housing will approximately double.
Many of these households have significant wealth and can choose expensive-accessible housing,
such a million dollar condominiums, but a significant portion of this demand is for affordable
housing. If a city’s affordable-accessible housing demand was for 20,000 units in 1990, it is
probably 40,000 today and will be 60,000 in 2030. Many urban regions are tens of thousands of
units short of market demand for affordable-accessible homes.
Affordable-Accessible Housing In A Dynamic City
Victoria Transport Policy Institute
20
Table 4 Forces of Concentration and Dispersion
Forces of Urban Concentration
Forces of Urban Dispersion
More non-drivers
Higher transport costs (road tolls, fuel prices, travel times)
Improved urban livability
Improved public transit service
Activities and industries require more interaction
Increased preference for urban living
More people are motorists (can drive and have a car)
Lower transport costs (road tolls, fuel prices, travel times)
Degraded urban livability
Reduced urban transit service
Activities and industries require less human interaction
Increased preference for suburban living
Forces of concentration increase activity levels and land prices toward the city center. Forces of
dispersion spread out activities and reduce the price difference between urban and suburban land.
There are both advantages and disadvantages to living in more accessible urban neighborhoods.
Urban development patterns reflect tension between forces of concentration and dispersion, as
indicated in Table 4. Many of the current trends described previously favor more accessible,
compact development. For example, aging population, rising fuel prices, increasing traffic
congestion, and improved urban livability are all increasing demand for urban housing and
business location. A rational real estate market will respond to such demands by increasing the
supply of affordable, accessible housing within existing urban areas.
Figure 8 Concentrated Versus Dispersed Development
Urban
Edge
City
Center
Urban
Edge
Activity Levels and Land Prices
Concentrated
Dispersed
Forces of concentration (blue) increase activity levels and land prices toward the city center. Forces of
dispersion (red) spread out activities and reduce the price difference between urban and suburban land.
However, current planning practices respond poorly to changing demands; they assume that
factors such as density and mix should remain fixed in existing neighborhoods. This may be
justified to allow existing residents maintain the environmental qualities they selected when they
moved in, but this occurs at the expense of potential future residents who may prefer more
compact, mixed communities due to demographic and economic trends. For example, a
particular neighborhood might have an 80:20 ratio of single- to multi-family housing, although
optimal ratio has become 50:50 due to aging population, rising fuel prices and increased health
concerns. The challenge for public officials is to find ways to allow neighborhoods to evolve
toward a more optimal density and mix while preserving the attributes that people truly value,
such as safety and quiet.
Affordable-Accessible Housing In A Dynamic City
Victoria Transport Policy Institute
21
Barriers to Affordable-Accessible Development
This section describes specific barriers to affordable-accessible housing development.
Inaccurate Problem Definition
Housing affordability programs often focus on serving special needs, such as people who are
homeless or have disabilities. While important, this fails to address the larger but less visible
problem of housing inaffordability for moderate-income households. A narrow problem
definition can result in targeted and inefficient solutions that only address a small portion of
problems and require large subsidies per beneficiary. Some strategies favor one group over
others or exacerbate future problem by discouraging lower-priced housing development.
Institutional Barriers
Current planning practices tend to favor new suburban develop over urban infill; single-family
over multi-family; and automobile travel over alternative modes (Levine 2006). For example,
most jurisdictions require generous minimum parking supply, with little or no discount for urban
infill, making affordable-accessible housing relatively costly to develop. Similarly, many
jurisdictions spend far more to accommodate increased automobile travel than alternative modes.
Fee and Tax Structures
Development fee, taxes and utility rate structures often discourage affordable-accessible housing
development (Nelson, et al. 2008).
Fees and taxes charged per housing unit, rather than based on floor area or transaction value,
favor development of fewer, more expensive units over smaller, affordable housing.
Multi-family housing tends to bear higher tax rates than single-family (Goodman 2006).
Fees and taxes that fail to reflect the lower costs of providing public services to infill
development compared with sprawl, the lower costs of providing public services to smaller
households, and the lower costs of providing roads and parking to households that own fewer
motor vehicles, discourage affordable-accessible housing development.
Fees and taxes that apply within but not outside urban areas tend to favor sprawl over infill.
Neighborhood Opposition
Despite general support for more affordable housing, individual residents and neighborhood
associations often oppose specific affordable housing projects due to concerns about local
impacts. Some of this opposition reflects ignorance or exaggerated fears (for example, of lower-
income household’s criminality), or problems that can be addressed with appropriate policies
(such as traffic and parking management programs to address congestion problems), but such
opposition may be understandable and even rational, since if other neighborhoods successfully
exclude lower-priced housing, those that do not can bear excessive social problems. However,
from a broader perspective such opposition is harmful since it concentrates social problems and
reduces affordability overall. Many residents are ultimately harmed by their own opposition to
affordable housing which they eventually require.
Affordable-Accessible Housing In A Dynamic City
Victoria Transport Policy Institute
22
Affordable Housing Economic Analysis
This section describes various factors that affect affordable-accessible housing costs. For more
discussion see Ford (2009) and Miller (2008).
Land Prices
Land is a major portion (typically 30-50%) of total housing costs. Raw (undeveloped) land prices
range from less than $50,000 per acre in rural areas to more than $1,000,000 per acre in urban
areas, but higher land prices are generally offset by higher densities in urban areas. Urban
housing reduces land per housing unit by having less greenspace (lawns and gardens), more
stories, and smaller size units. This smaller unit size reflects a combination of smaller household
size, higher land costs, older housing stock and higher construction costs.
Land prices are affected by the potential profitability of development, so urban land values tend
to increase if zoning codes and planning practices allow higher densities. As a result, in certain
circumstances affordable housing mandates can keep land prices affordable. For example, if a
parcel’s allowable density increases by 50% its price may increase proportionately unless the
additional units are required to be affordable, or a development fee or land value tax (a levy on
the unimproved value of land, reflecting the relative value of its location)
2
captures some or all
of the additional profit (Rybeck 2010).
Development Costs and Fees
Land development includes soft costs (planning, subdividing and other legal approvals) and hard
costs (ground preparation, retaining walls, driveways, sidewalks, stormwater mainagement,
utility connections, etc.). Urban parcels are often already improved, making redevelopment of
existing sites cheaper in some ways than greenfield development, but in other cases, special
costs, such as contaminated soil remediation or additional infrastructure (such as sidewalks)
make urban development more expensive. Many jurisdictions impose development fees to help
finance expansion of public roads, parks and libraries. Rural communities generally impose
smaller development fees because they provide fewer public services, but suburban and rural
development often requires onsite water and sewage systems that increase development costs.
Construction Costs
Construction costs vary depending on housing type and quality. They typically range from $125
to $250 per square foot depending on construction type (wood frame is cheaper than concrete),
design (simple and standard is cheaper than complex and special), material and finish quality,
time and location (construction costs increase during boom periods and decline during busts),
and amenities (such as the number and quality of appliances included). High-rise buildings have
higher construction costs because they which require concrete structures and special features
such as elevators and stronger windows.
2
Land Value Tax (
Affordable-Accessible Housing In A Dynamic City
Victoria Transport Policy Institute
23
Parking Costs
Parking facility costs include additional land and construction costs for driveways, parking lots
and garages (including structured and underground parking), or special in lieu fees paid to
governments to provide parking facilities off-site. Conventional parking standards, which
typically require at one or two parking spaces per housing unit, can more than double land costs
per unit. Structured parking reduces land requirements but typically costs $25,000 to $50,000 per
space, and so only becomes cost effective where land prices exceed about $3,000,000 per acre.
Parking typically represents 5-15% of total land and construction costs, and more if conventional
parking requirements are applied to lower-priced housing in areas with expensive land.
Parking demand is highly variable, depending on demographic (income and age), geographic
(land use density and mix), and management factors (how parking spaces are assigned, regulated
and priced). Most middle-age, higher-income residents in automobile-dependent communities
with unpriced parking typically own at least one vehicle and so demand two or more parking
spaces per unit, but residents of affordable-accessible housing tend to demand less parking,
particularly if parking is unbundled (residents pay separately for parking rather than having it
automatically included in rents), and there are amenities such as bicycle parking and carshare
services.
Financing and Transaction Costs
Developers use construction finance loans, which are then converted to permanent loans by
building owners with somewhat lower rates after projects are completed. Construction finance
costs vary depending on project duration, the developer’s credit rating, and market conditions.
Building owner financing costs depend on their credit rating and market conditions. Affordable-
accessible housing tends to have relatively high interest rates because it is often developed by
smaller firms and occupied by households with weaker credit ratings that pay smaller deposits.
Financing and transaction costs (including profits, fees and taxes on sales) increase the price
consumers ultimately pay for housing.
Even modest additional costs or delays early in the development process can significantly
increase housing prices. For example, a $10,000 per unit additional expense or six month delay
early in the development process can add $20,000 to the final costs, due to carrying costs. This
forces developers to target higher-priced markets, and so must incorporate other costly features,
such as nicer finishing and appliances, increasing the retail price by $30,000, making it
unaffordable to many households.
Operation
Total housing costs include various ongoing costs such as property taxes, condominium or
resident association fees, utilities (water, sewage, garbage, electricity and heating), and
maintenance (including reserve funds for major repairs such as painting and roof replacement).
Taxes, fees and utilities tend to increase with building size and value, and maintenance and
utility costs tend to increase with building age.
Affordable-Accessible Housing In A Dynamic City
Victoria Transport Policy Institute
24
Table 5 summarizes these housing cost categories.
Table 5 Housing Cost Categories
Category
Description
Typical Values
Land
Raw land costs
From $10,000 in rural areas to $2,000,000 in
typical urban neighborhoods, and even higher
in major city centers.
Development
costs
Costs of preparing land and providing
services, including roads, sidewalks, water,
sewage, electricity and other utilities, and
municipal development fees
From $5,000 in existing urban areas to
$50,000 for undeveloped suburban and rural
locations. Development fees typically range
from $10,000 to $40,000 per unit.
Construction
Costs of constructing houses
$150 to $250 per square foot. Higher for
concrete construction, and higher quality
design, materials and amenities.
Parking
Costs of building driveways and garages
$10,000 for a short driveway, $20,000 per
space for a basic garage, $50,000 for
underground garage
Finance and
transactions
Costs of financing development and
ownership, plus profits, taxes and fees
8% annual for construction finance, 5% for
ownership finance.
Operation
Maintenance, property taxes, condominium or
resident association fees, and basic utilities
(electricity and heating)
20-30% of mortgages or rents.
This table summarizes the various costs of housing.
The Affordable-Accessible Housing Analysis Spreadsheet (www.vtpi.org/aff_acc_hou.xls)
calculates total housing and transportation costs in specific situations. Users can see how
changing factors such as land costs, density, building size, parking supply, financing, operations
and transportation costs affect total costs and affordability.
For example, Table 6 illustrates the costs of a small-lot single-family home if located in a very
accessible inner urban neighborhood, a somewhat less accessible outer urban neighborhood, and
an automobile-dependent suburban community. The top half of the table shows the various
inputs, the bottom half indicates the output. For example, it assumes that land prices range from
$1.5 million in the inner urban location to $500,000 in suburban locations, and has inputs for
other factors such as development costs, parking supply, construction costs, utility costs, and
transportation costs. These inputs are used to calculate outputs such as total annualized costs.
This analysis assumes that urban areas have higher land prices and somewhat higher densities,
and urban households own fewer vehicles and drive fewer annual vehicle-miles than in suburban
areas. In this analysis, Inner Urban residents are assumed to accept a 50 x 70 foot parcel,
compared with a 60 x 100 foot parcel in the suburban location, and forego automobile
ownership, providing parking and transportation cost savings.
Affordable-Accessible Housing In A Dynamic City
Victoria Transport Policy Institute
25
Table 6 Small-Lot Single-Family House – Selected Input and Outputs (Litman 2010)
Inner Urban
Outer Urban
Suburban
Inputs
Undeveloped land costs (per acre)
$1,500,000
$1,000,000
$500,000
Land development costs (per acre)
$200,000
$200,000
$200,000
Development fees (per unit)
$10,000
$10,000
$10,000
Developed land costs (per acre)
$1,820,000
$1,300,000
$780,000
Building height (stories)
2.0
2.0
2.0
Unit size - interior space (sq. feet)
2,000
2,000
2,000
Density (units per acre)
12
10
8
Parking spaces (per unit)
0.0
1.0
2.0
Construction costs per sq. ft.
$150
$150
$150
Type of parking
None
Garage
Garage
Basic utilities (water, sewage, electricity)
$4,000
$4,000
$4,000
Annual vehicle expenses (including rentals)
$500
$4,500
$9,800
Annual public transit & taxi expenses
$1,500
$500
$200
Outputs
Annualized land costs (unit per year)
$12,639
$10,336
$7,528
Annualized construction costs per unit
$25,000
$25,000
$25,000
Annualized parking costs per unit
$0
$2,164
$3,930
Total annual operating costs per unit
$8,020
$8,036
$7,958
Total annual transportation expenses
$2,000
$5,000
$10,000
Total
$47,659
$50,536
$54,417
This table summarizes key inputs and outputs used in the “Affordable-Accessible Housing Analysis
Spreadsheet” for this analysis.
Figure 9 illustrates analysis results. In this situation, higher urban land costs per acre are offset
by reduced land required per housing unit and by lower parking and transport costs, resulting in
lower total costs for the inner urban location. This is not always the case. Urban residents may
pay more in total, particularly if they own vehicles and pay for costly parking spaces.
Figure 9 Small-Lot Single-Family Annualized Expenses (Litman 2010)
$0
$10,000
$20,000
$30,000
$40,000
$50,000
$60,000
Inner Urban Outer Urban Suburban
Annualized Costs
Transportation expenses
Housing operating costs
Parking costs
Construction costs
Land costs
This figure compares typical costs for a small-lot single-family home at urban and suburban locations.