\ Interim Guidance on Hurricane Conditions in the Gulf of Mexico
Bạn đang xem bản rút gọn của tài liệu. Xem và tải ngay bản đầy đủ của tài liệu tại đây (4.25 MB, 68 trang )
By Authority Of
THE UNITED STATES OF AMERICA
Legally Binding Document
By the Authority Vested By Part 5 of the United States Code § 552(a) and
Part 1 of the Code of Regulations § 51 the attached document has been duly
INCORPORATED BY REFERENCE and shall be considered legally
binding upon all citizens and residents of the United States of America.
HEED THIS NOTICE
: Criminal penalties may apply for noncompliance.
Official Incorporator:
T
HE EXECUTIVE DIRECTOR
OFFICE OF THE FEDERAL REGISTER
WASHINGTON, D.C.
Document Name:
CFR Section(s):
Standards Body:
e
API 2INT-MET: Interim Guidance on Hurricane
Conditions in the Gulf of Mexico
30 CFR 250.901(a)(6)
American Petroleum InstituteInterim Guidance on Hurricane
Conditions
in the
Gulf
of
Mexico
Upstream
Segment
API BULLETIN 2INT-MET
MAY 2007
SPECIAL NOTES
API publications necessarily address problems
of
a general nature. With respect to particular
circumstances, local, state, and federal laws and regulations should be reviewed.
Neither
API nor any
of
API's employees, subcontractors, consultants, committees, or other
assignees make any warranty or representation, either express or implied, with respect to the
accuracy, completeness, or usefulness
of
the information contained herein, or assume any
liability or responsibility for any use, or the results
of
such use,
of
any information or process
disclosed
in
this publication. Neither API nor any
of
API's employees, subcontractors, con-
sultants, or other assignees represent that use
ofthis
publication would not infringe upon pri-
vately owned rights.
API publications may be used by anyone desiring to do so. Every effort has been made by
the Institute to assure the accuracy and reliability
of
the data contained
in
them; however, the
Institute makes no representation, warranty, or guarantee
in
connection with this publication
and hereby expressly disclaims any liability
or
responsibility for loss or damage resulting
from its use or for the violation
of
any authorities having jurisdiction with which this publi-
cation may contlict.
API publications are published to facilitate the broad availability
of
proven, sound engineer-
ing and operating practices. These publications are not intended to obviate the need for
applying sound engineering judgment regarding when and where these publications should
be utilized. The formulation and publication
of
API publications
is
not intended in any way
to inhibit anyone from using any other practices.
Any manufacturer marking equipment or materials in conformance with the marking
requirements
of
an
API standard is solely responsible for complying with all the applicable
requirements
of
that standard. API does not represent, warrant, or guarantee that such prod-
ucts do
in
fact conform to the applicable API standard.
All rights reserved. No part
of
this work may be reproduced, stored in a retrieval system, or
transmitted by any means, electronic, mechanical, photocopying, recording, or otherwise,
without prior written permission from the publisher.
Contact the Publisher,
API
Publishing
Services,
1220 L Street,
N.
W,
Washington,
D.
C.
20005.
Copyright © 2007 American Petroleum Institute
FOREWORD
This bulletin
is
under the jurisdiction
of
the API Subcommittee on Offshore Structures.
Nothing contained
in
any API publication is to be construed as granting any right,
by
impli-
cation or otherwise, for the manufacture, sale, or use
of
any method, apparatus, or product
covered by letters patent. Neither should anything contained
in
the publication be construed
as insuring anyone against liability for infringement
of
letters patent.
This document was produced under
API standardization procedures that ensure appropriate
notification and participation
in
the developmental process and
is
designated as
an
API Stan-
dard. Questions concerning the interpretation
ofthe
content
of
this publication or comments
and questions concerning the procedures under which this publication was developed should
be directed
in
writing to the Director
of
Standards, American Petroleum Institute, 1220 L
Street, N.W., Washington,
D.C. 20005. Requests for pennission to reproduce or translate all
or any part
of
the material published herein should also be addressed to the director.
Generally,
API Standards are reviewed and revised, reaffirmed, or withdrawn at least every
five years. A one-time extension
of
up to two years may be added
to
this review cycle. Status
of
the publication can be ascertained from the API Standards Department, telephone (202)
682-8000. A catalog
of
API publications and materials
is
published annually and updated
quarterly
by
API, 1220 L Street, N.W., Washington, D.C. 20005.
Suggested revisions are invited and should be submitted to the Standards and Publications
Department,
API, 1220 L Street,
NW,
Washington, D.C. 20005,
iii
Page
INTRODUCTION
1
1.1
Background
I
1.2
Organization
1
1.3
Limitations and Ongoing Work
2
2 DEFINITIONS
2
3 REGIONS AND AREAS
OF APPLICABILITY
2
4 INDEPENDENT EXTREME WIND, WAVE,
CURRENT AND SURGE
3
4.1
Wind
.4
4.2 Waves
6
4.3
Currents
7
4.4 Surge and Tide
10
4.5 Independent Extremes by Region
I 0
5 ASSOCIATED WIND, WAVE, CURRENT
AND
SURGE FOR LOAD CASES
35
6 EXAMPLE APPLICATIONS: DETERMINING CONDITIONS AT A SITE
36
6.1
Example: Shallow Water Site
36
6.2 Example: Intermediate Depth Site Between Regions
37
7 SUDDEN
HURRICANE CONDITIONS
.42
8 SEASONAL
HURRICANE CONDITIONS
.49
9 GUIDELINES
FOR SITE-SPECIFIC METOCEAN STUDIES
.49
10
COMMENTARy
50
10.1
Basis
of
New Metocean Conditions
50
10.2
Regional Considerations
51
10.3
Length
of
Hindcast Database
52
10.4 Site-specific Studies
53
10.5 References
53
Figures
3.1
4.2.2-1
4.3.1-1
4.5.1-IA
4.5.1-2A
4.5.1-3A
4.5.1-4A
4.5.1-IB
4.5.1-2B
4.5.1-3B
4.5.1-4B
4.5.2-1A
Gulf
Regions and Areas
of
Applicability
3
Direction Factor for Wave Heights North
of26°N,
West
of
84°W,
WD > = 30m (98 ft), Return Periods>
10
Year.
8
Current Heading North
of26°N,
WD < = 70m (230 ft)
9
N-Year
Hs,
West Region. . . . . . . . . . . . . . . . . . . . . . . . . . . . . . . . . . . . . . .
12
N-Year Hmax, West Region
12
N-
Year Max Crest Elevation, West
Region.
. . . . . . . . . . . . . . . . . . . . . . .
13
N-Year Surge with Tide, West Region
13
N-Year
Hs,
West Region
IS
N-Year Hmax, West Region
IS
N-Year Max Crest Elevation, West Region
"
16
N-Year Surge with Tide, West Region. . . . . . . . . . . . . . . . . . . . . . . . . . . .
16
N-Year
Hs,
West Central Region
18
v
4.5.2-2A
4.5.2-3A
4.5.2-4A
4.5.2-18
4.5.2-28
4.5.2-38
4.5.2-48
4.5.3-IA
4.5.3-2A
4.5.3-3A
4.5.3-4A
4.5.3-18
4.5.3-28
4.5.3-38
4.5.3-48
4.5.4-IA
4.5.4-2A
4.5.4-3A
4.5.4-4A
4.5.4-18
4.5.4-28
4.5.4-38
4.5.4-48
7-IA
7-2A
7-3A
7-4A
7-18
7-28
7-38
7-48
Tables
4.1.3.1
4.5.1-IA
4.5.1-18
4.5.2-1 A
4.5.2-18
4.5.3-IA
4.5.3-18
4.5.4-IA
4.5.4-18
5-1
Page
N-Year H
max
,
West Central Region
18
N-Year Max Crest Elevation, West Central Region. . . . . . . . . . . . . . . . . .
19
N-Year Surge with Tide, West Central Region . . . . . . . . . . . . . . . . . . . . .
19
N-Year H
s
,
West Central Region
21
N-Year H
max
,
West Central Region
21
N-Year Max Crest Elevation, West Central Region
22
N-
Year Surge with Tide, West Central Region
22
N-
Year H
s
,
Central Region
24
N-Year H
max
,
Central Region
24
N-
Year Max Crest Elevation, Central Region
25
N-
Year Surge with Tide, Central
Region.
. . . . . . . . . . . . . . . . . . . . . . . . .
25
N-
Year H
s
,
Central Region. . . . . . . . . . . . . . . . . . . . . . . . . . . . . . . . . . . . .
27
N-
Year H
max
,
Central Region
27
N-
Year Max Crest Elevation, Central Region
28
N-
Year Surge with Tide, Central Region
28
N-
Year H
s
,
Eastern Region
30
N-Year H
max
,
Eastern Region. . . . . . . . . . . . . . . . . . . . . . . . . . . . . . . . . . .
30
N-Year Max Crest Elevation, Eastern Region. . . . . . . . . . . . . . . . . . . . . .
31
N-Year Surge with Tide, Eastern Region
31
N-Year H
s
,
Eastern Region
33
N-
Year H
max
,
Eastern Region. . . . . . . . . . . . . . . . . . . . . . . . . . . . . . . . . . .
33
N-Year Max Crest Elevation, Eastern Region
34
N-
Year Surge with Tide, Eastern
Region.
. . . . . . . . . . . . . . . . . . . . . . . . .
34
N-
Year H
s
,
All Regions
44
N-
Year H
max
,
All Regions
44
N-
Year Max Crest Elevation, All Regions
45
N-Year Surge with Tide, All Regions
45
N-Year H
s
,
All Regions
47
N-
Year H
max
,
All Regions
47
N-
Year Max Crest Elevation, All Regions
48
N-
Year Surge with Tide, All Regions
48
Coefficients and Distances for the 3-D
(i
= 1,2,3) Coherence Spectrum
6
Independent Extreme
Values for Hurricane Wids, Waves, Currents
and Surge, Western
Gulf
of
Mexico (97.5°W to 95.0
0
W)
II
Independent Extreme
Values for Hurricane Winds, Waves,
Currents and Surge, Western
Gulf
of
Mexico (97.5°W to 95.0
0
W)
14
Independent Extreme Values for Hurricane Winds, Waves,
Currents and Surge, West
Gulf
of
Mexico (94.0oW to 90.5°W). . . . . . . .
17
Independent Extreme Values for Hurricane Winds, Waves, Currents
and Surge, Western Central
Gulf
of
Mexico (94.0oW to 90.5°W)
20
Independent Extreme Values for Hurricane Winds, Waves,
Currents and Surge, Central
Gulf
of
Mexico (89.5°W to 86.5°W)
23
Independent Extreme
Values for Hurricane Winds, Waves,
Currents and Surge, Central
Gulf
of
Mexico
(89SW
to
86.SOW)
.
26
Independent Extreme
Values for Hurricane Winds, Waves,
Currents and Surge, Eastern
Gulf
of
Mexico (85.5°W to 82.5°W)
29
Independent Extreme
Values for Hurricane Winds, Waves,
Currents and Surge, Eastern
Gulf
of
Mexico (85.5°W to 82.5°W)
32
Factors for Combining Independent Extremes into Load Cases
in
Deep Water (WD > = 150 m or 492 ft)
35
Page
5-2 Factors for Cominbing Independent Extremes into Load Cases
in
Shallow Water
(10m
or 33
ft
< = WD < = 70 m or 230
ft)
36
7-1
A Independent Extreme Values for Sudden Hurricane Winds, Waves,
Currents and Surge (All Regions)
43
7-18
Independent Extreme Values for Sudden Hurricane Winds, Waves,
Currents and Surge (All
Regions)
46
Guidance
on
Hurricane
Conditions
in
the
Gulf
of
Mexico
1 Introduction
This interim document presents hurricane-driven metocean conditions (wind, wave, current and surge) for use with and reference
by
other API standards. These conditions are intended to replace the conditions documented
in
Sections 2.3.4.c and 17.6.2.a
of
API RP 2A-WSD, 21st Edition and Appendix
CA
ofISa
19901-1.
The metocean conditions documented herein are for guidance and will not generally provide
as
accurate a result as a dedicated
site-specific study. Perfonnance
of
a site-specific metocean study
is
the preferred way
of
ensuring that regional variations
in
storm
climate and local topographic and bathymetric effects are properly accounted
for,
and that sufficient data
is
available to properly
identifY the phasing between wind, wave, current and surge. When performing response-based analyses, a site-specific study
must be performed to develop the necessary time histories
of
metocean parameters. Site-specific studies should be performed
within the guidelines included in this document.
1.1
BACKGROUND
The hurricane metocean conditions presently contained
in
the
21
st Edition
of
API
RP
2A-WSD have not been updated since
1993. Since that time, several major severe storms, most notably
Opal (1995), Ivan (2004) and Katrina (2005), have affected the
Gulf, resulting
in
increases to local extremes
in
the areas affected by these storms. Most importantly, however, industry's under-
standing
of
hurricane risk has continued to evolve. Strong evidence now exists for there being a regional dependence for large,
intense wave-making storms. Also, investigations into the underlying hurricane record, HURDAT, used as the foundation for the
industry's storm hindcast database, have revealed that storms from the early period
of
the database are probably biased low
in
terms
of
intensity.
A new set
of
hurricane conditions has been derived for reference by other API standards using the latest hindcast storm record and
incorporating the industry's best understanding to date
of
the regional dependence
of
storm intensity. Conditions are presented for
four regions, the boundaries
of
which are:
West, between
97.5°W and
9S
o
W
West Central, between 94°W and 90.SoW
Central, between 89.SoW and 86.SoW
East, between 8S.SoW and 82.SoW
The database used to establish conditions has been restricted to the years from approximately
19S0
through 200S, the period for
which better characterization
of
storms offshore exists
by
virtue
of
aerial reconnaissance and later satellite observations.
Of
the four regions, changes relative to previous API
RP
2A-WSD values are most pronounced
in
the Central region. Conditions
in
other regions are similar to those contained
in
API RP 2A-WSD.
The conditions presented herein are based on
an
"as-is" acceptance
ofthe
hindcast record from approximately
19S0
through 200S.
They do not include artificial increases to values derived from statistical analysis
of
the hindcast record beyond those associated
with several
of
the extrapolations involved and make no claim
to
be conservative. Nor
do
they consider the possibility
of
storms
with a wave-making potential like
Opal, Ivan and Katrina affecting the non-Central regions with a frequency similar to that which
has been observed
in
the Central region.
1.2 ORGANIZATION
The document
is
organized as follows:
Section
I: Introduction.
Section
2:
Definitions
of
terms used.
Section
3:
A description
of
the four regions, and notes
of
areas and water depths where the conditions
do
not apply.
Section
4:
Hurricane-driven independent extremes
of
wind, wave, current and surge.
Section
S:
Factors for combining the independent extremes
in
Section 4 into load cases centered on a particular extreme
(peak wind, peak wave or peak current).
Section
6:
Example applications
of
deriving conditions
at
sites.
Section
7:
A description
of
"sudden" hurricane conditions for the Northern
Gulf
of
Mexico.
2
API BULLETIN 2INT-MET
Section
8:
Recommendations for deriving "seasonal" hurricane conditions.
Section
9:
Guidel ines for the performance
of
site-specific studies
of
hurricane conditions.
Section
10:
Commentary on the conditions presented, summarizing how they were derived and listing select references.
Users
of
this interim document should thoroughly review the commentary on hurricane conditions included
in
Section
10
prior to
referencing any
of
the conditions or methods presented herein. The commentary summarizes the technical basis and assumptions
used
in
deriving the conditions. A review
of
Section 6 is also recommended, as
it
presents several examples on how wind, wave,
current and surge conditions can be established for a given site from the charts and tables
in
this document.
1.3 LIMITATIONS AND ONGOING WORK
This document only addresses hurricane conditions for the
Gulf
of
Mexico.
It
does not address other phenomena such as winter
storms, the Loop Current, and other deepwater currents, or the joint occurrence
of
hurricane and Loop/deepwater current phenom-
ena. Furthermore,
it
does not specity conditions for hurricane-generated bottom currents for water depths beyond 70 m (230 ft).
Conditions for these phenomena should be derived through site-specific studies using appropriate hindcast models and quality mea-
surements.
Users
of
this interim document should be aware that work on hurricane conditions by the API
RP
2MET work group
is
ongoing;
additional work
is
in
progress to further examine the following:
Extremal estimates for all parameters, for return periods
in
excess
of200
years.
Wave-current interaction.
Hurricane currents
in
shallow and deep water.
Sudden hurricane conditions.
Conditions
in
extremely shallow water (0 m -
10m
or 0 ft -
33
ft).
The provisions
in
this document are intended to remain
in
force until a new API recommended practice covering metocean condi-
tions (not limited to hurricanes),
API RP 2MET,
is
published.
2 Definitions
WO Water depth, referenced to MLLW
MLLW Mean lower low water
WS
Wind speed
HI'
Significant wave height, defined
by
4(rno)o.s
Hmax
Expected maximum individual wave height
Ilmax Expected maximum individual crest height
rno
The energy contained
in
the wave spectrum
Surge The change
in
sea level caused by the passage
of
a storm
Tide Astronomically-driven changes
in
sea level
Heading Heading convention
is
"towards" i.e., the direction
To
which wind, wave or current are acting
COY Coeflicient ofYariation
Shallow Water depths between
10
m and 70 m (33 ft and 230 ft)
Deep Water depths greater than or equal to 150 m (492
ft)
Transition Water depths greater than 70 m (230 ft) and less than 150 m (492 ft)
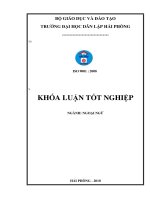
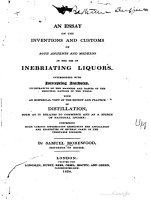
3 Regions and Areas of Applicability
Hurricane-driven metocean conditions are provided for most areas
of
the
Gulf
of
Mexico north
of
26°N,
in
water depths (WO)
greater than or equal to
10m
(33 ft) mean lower low water level (MLLW). Conditions are presented for four approximate regions
of
differing hurricane climatology, as shown
in
Figure 3-1. The regions have been selected based on consideration
of
trends
in
(1)
INTERIM GUIDELINES
ON
HURRICANE CONDITIONS
IN
THE
GULF
OF
MEXICO 3
stonn size and intensity, (2) regional wind and wave extremes, (3) frequency
of
Loop Current and eddies, and (4) paths storms may
take entering the Gulf. The regions are:
West, between 97.5°W and
95°W
West Central, between 94°W and 90.5°W
Central,
between 89.5°W and 86.5°W
East, between 85.5°W and 82.5°W
Between each region are areas
of
transition (unshaded), 1 ° longitude wide. Conditions for these transition areas should be derived
by
linearly interpolating between the values
of
the two adjacent regions across the width
of
the transition. For example,
if
a site
lies at
90.25°W, then conditions for that site would be derived by using those from the West Central region weighted 0.75 and
those from the
Central region weighted 0.25.
-98"
_96°
_94°
-92°
-ext
_88°
_86°
_84°
-82°
30"
30°
"E'
"E'
2W
28°
27'
West
Ceni:r~aj
27'
26°
26°
25° 25°
-98"
_96°
_94°
-92°
-ext
_88°
_86°
_84°
-82°
Figure
3.1-Gulf
Regions
and
Areas
of
Applicability
The conditions
in
this document
do
not apply to the following:
Water depths less than
10m
(33 ft). Shallow areas near the coast will be subject
to
high surge levels which will
depend on the steepness
of
the local terrain (both bathymetry and overland elevation) as well as the coastal profile.
The storm surge very near the coast may allow for the existence
of
large waves which otherwise would not be possi-
ble for calm water conditions.
Areas inside barrier islands and those around the Mississippi Delta. The shaded areas around the Delta and inside barrier
islands will be subject to sheltering, limited fetch and possible attenuation
of
waves
by
interaction with mud, and may have
complicated surge and current patterns, while areas east
of
the barrier islands will be subject to complicated currents.
The steep bathymetry transition
(70 m - 500 m or 230
ft
- 1640 ft)
ofthe
Central region. This shaded area
is
subject
to
com-
plicated currents following the passage
of
hurricanes, which result from the superposition
of
local wind-generated currents
and offshore flow from surge trapped
in
the area
of
Eastern Louisiana.
Conditions for areas where the conditions do not apply must
be
derived by site-specific studies, the perfonnance
of
which
is
dis-
cussed
in
Section
9.
4 Independent Extreme Wind, Wave, Current and Surge
Independent extreme values
of
wind, wave, current and surge have been calculated for return periods
of
10,
25, 50, 100, 200,
1000,2000,
and 10000 years for each region and are presented
in
the tables and figures
in
4.5.
Each table shows the following parameters for a given region:
N-year wind velocities for all water depths.
• N-year waves for water depths greater than or equal to 1000 m (3281 ft).
4
API BULLETIN 2INT-MET
• Associated periods for n-year waves
in
all water depths.
N-year current profiles for water depths greater than or equal to
ISO
m (492 ft).
• N-year depth-averaged currents for water depths between
10
m and 70 m (33
ft
and 230
ft).
• N-year surge for water depths greater than or equal to 500 m (1640 ft).
Astronomical tide amplitude
(OA2 m or
lA
ft) from MLLW for all water depths (constant for all return periods).
The figures show the following parameters for each region over the water depth range from
10m
- 1000 m (33
ft
-
3281
ft):
N-year
H,.
• N-year Hmax.
• N-year
llmax
(including associated storm surge and astronomical tide).
• N-year storm surge including astronomical tide.
Each
of
the parameters
is
further described below.
4.1
WIND
The
10m
(32.8 ft) elevation wind velocities presented
in
Tables 4.5.1
to
4.5A
are applicable
to
all water depths. The extreme
winds should be treated as omni-directional. When adjusting these wind speeds
to
different averaging intervals and/or elevations,
or when developing wind spectra, the following formulas should be used. These formulas are dimensional; one set
is
provided
in
SI
Units and the other
in
U.S. Customary Units. It should be noted the spatial coherence formulas (2.3.2-6 and 2.3.2-7) contained
in
API
RP
2A-WSD,
21
st Edition (with Supplement 2) are not dimensionally correct for U.S. Customary Units, and the value
of
U3
is
incorrect. This error has been fixed
in
API
RP
2A-WSD, 21st Edition Supplement
3.
4.1.1 Wind Profiles and Gusts, SI Units
For strong wind conditions (near-neutral stratification) the design wind speed
u(z,
t)
(m/s) at height z (m) above sea level and cor-
responding
to
an averaging time period t::;
to
= 3600 s
is
given
by:
u(z,
t) =
U(z)[
\-
OAl1iz)ln(t/to)]
where the I-hour mean wind speed U(z) (m/s) at level z
is
given
by:
C = O.0573JI
+0.15U
o
and where the turbulence intensity lll(z) at level z
is
given by:
ll/(z) = 0.06[1
+0.043U
o
](tor0
22
where
Uo
(m/s)
is
the I-hour average wind speed at
10m
elevation.
4.1.2 Wind Profiles and Gusts,
U.S. Customary Units
For strong wind conditions (near-neutral stratification) the design wind speed
u(z,
t)
(ft/s) at height z (ft) above sea level and cor-
responding to
an
averaging time period t s
to
= 3600 s
is
given
by:
U(Z,t) =
U(z)[I-0Alliz)ln(t/to)]
where the I-hour mean wind speed U(z) (ft/s) at level z
is
given
by:
U(z) = U
o
[
1+
Cln(3;J
J,
C =
0.0573JI
+ 0.0457 U
o
INTERIM GUIDELINES ON HURRICANE CONDITIONS
IN
THE
GULF
OF
MEXICO
and where the turbulence intensity
11l(z)
at level Z is given by:
l,,(z) = 0.06[1
+0.013Uo](~)-o.22
32.8
where
Uo
(ft/s)
is
the I-hour average wind speed at 32.8
ft
elevation.
4.1.3 Wind Spectra, SI Units
5
F
or
structures and structural elements for which the dynamic wind behavior
is
of
importance, the following I-point wind spec-
trum may be used for the energy density
of
the longitudinal wind speed fluctuations:
320
!!
£.
(
U,)2(
)0.45
10
10
S(t)
=
(
j
-
n (5/311)
I + )
where n = 0.468 and where:
• S(j) (m
2
s-2/Hz)
is
the spectral energy density at frequency
j(Hz)
• z (m)
is
the height above sea level
Uo
(m/s)
is
the I-hour mean wind speed at
10m
above sea level
4.1.4 Wind Spectra, U.S. Customary Units
For structures and structural elements for which the dynamic wind behavior is
of
importance, the following I-point wind spec-
trum may be used for the energy density
of
the longitudinal wind speed fluctuations:
where n
= 0.468 and where:
3444.8(
U
O
_\
2(_Z
)0.45
32.8) 32.8
S(f) =
(1
+ j
n
t
13l1
)
j = I
72j(_z_)
2/3(
U
o
)-0.75
32.8 32.8
• S(j) (ft
2
s-2/Hz)
is
the spectral energy density at
frequencyj(Hz)
• z
Cft)
is
the height above sea level
Uo
(ft/s)
is
the I-hour mean wind speed at 32.8 ft above sea level
4.1.5 Spatial Coherence,
SI
Units
The squared correlation between the spectral energy densities S(j)
of
the longitudinal wind speed fluctuations
of
frequency j
between two points
in
space
is
described by the 2-point coherence spectrum.
The recommended coherence spectrum between two points
(Xi,
Yi,
Zi
in m)
• at levels
ZI
and
Z2
above the sea surface
• with across-wind positions
YI
and
Y2
• with along-wind positions XI and
X2
6
API BULLETIN 2INT-MET
is given by:
where
and where the coefficients
u,
p,
q,
r and the distances
t,
are given in Table
4.l.3.1.
4.1.6 Spatial Coherence, U.S. Customary Units
The
squared correlation between the spectral energy densities S(j)
of
the longitudinal
wind
speed fluctuations
of
frequency f
between two points
in
space is described by the 2-point coherence spectrum.
The recommended coherence spectrum between two points
(Xi.
Yi, Zi in ft)
at levels ZI and
Z2
above the
sea
surface
with across-wind positions
YI
and
Y2
with along-wind positions Xl
and
X2
is
given by:
where
r.(
t,
)
'Ii
-I'.
Ai =
uJ'
3.;8
z~',
and where the coefficients
u,
p,
q,
r
and
the distances
t,
are given in Table 4.1.3.1.
Table
4.1.3.1-Coefficients
and Distances for the 3-D (i = 1,2,3) Coherence Spectrum
i
L1,
qi
Pi
ri
ui
1
I
X
2-
x
l
l
1.00 0.4
0.92
2.9
2
I Y2-Y I I
1.00
0.4 0.92 45.0
3
Izrzl I
1.25 0.5
0.85
13.0
4.2 WAVES
Wave conditions are presented in the form
of
~"
H
max
,
and llmax as well as associated
Tp
and T
Hmax
.
The
wave heights
in
the
tables are applicable for water depths greater than
or
equal to 1000 m (3281 ft), while the associated periods
in
the tables are
applicable to all water depths. For
wave
heights
in
depths between
10m
and 1000 m (33 ft
and
3281 ft), the appropriate regional
wave height depth decay curve figure should be consulted.
INTERIM GUIDELINES
ON
HURRICANE CONDITIONS
IN
THE
GULF
OF
MEXICO
7
4.2.1
Wave Crests
The crest elevations llmax shown in the tables and figures include associated surge and tide. The crest elevations provided
in
this
document do not include any artificial air gap allowance like the
1.5
m (5
ft)
previously recommended
in
API RP 2A-WSD.
It
should be noted that the maximum n-year llmax does not necessarily occur together with the n-year Hmax.
It
must be understood that these crests are based on the risk
of
exceedance at a single point; as a platform deck
is
in
affect repre-
sented by many points, the probability
of
exceeding this value
at
some location within the deck area
is
higher than the single point
exceedance probability. For the same risk ofnon-exceedance, the highest local maximum crest which could occur within a typical
deck area may
be
as much as 15% higher than the point estimate.
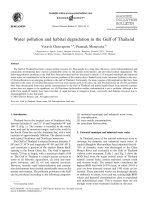
4.2.2 Extreme Wave Direction
The extreme waves presented
in
the tables and figures
in
4.5 are omni-directional. Directional extreme waves for return periods
greater than
10
years and for water depths greater than 30 m (98
ft)
may be approximated by factoring the omni-directional value
using Figure 4.2.2-1. The principal wave heading varies with longitude.
The
factors listed apply within ±22.5°
of
the headings
shown. When estimating directional extreme waves, the directional extreme should not be reduced below the level
of
the omni-
directional 10-year return period wave. Figure 4.2.2-\ does not apply to depths less than
30 m (98 ft), as inside this depth refrac-
tion will begin to turn the
wave
crests parallel to the local bathymetry.
It
also does not apply east
of
84°W, where principal wave
direction becomes quite variable depending on proximity to the Florida coast.
4.2.3 Wave Spectra and Spreading
Hurricane-driven seas can be reasonably represented
by
the JONSWAP spectrum with a y
of
2.0 - 2.5. Wave spreading can be
represented using the form
cosn(8),
with n in the range
of2.0
- 2.5.
4.3 CURRENTS
Currents are shown
in
the tables for water depths between
10m
and 70 m (33
ft
and 230 ft), and water depths greater than 150 m
(492 ft).
It
should be noted no deepwater bottom currents from hurricanes are provided; these should be derived by site-specific
studies.
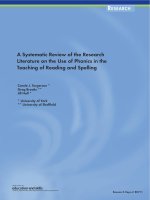
4.3.1 Shallow Water Currents
Currents
in
water depths less than or equal to 70 m (230 ft) are nearly uniform with depth due to their driving mechanism (hori-
zontal pressure gradients).
The
table for each region lists uniform currents for
10m
and 70 m (33
ft
and 230 ft); between these
depths, the current should be derived by interpolation. Extreme currents in water depths less than
or
equal to 70 m (230 ft) gener-
ally follow the
shelf
contours, and flow in a westerly direction. Figure 4.3.1-1 provides guidance for current headings
in
water
depths less than
70 m (230 ft).
4.3.2 Deepwater Currents
Currents
in
water depths greater than
or
equal to 150 m (492
ft)
have a sheared velocity profile which penetrates to the bottom
of
the mixed layer
of
the upper ocean. They are represented in the regional tables as a 3-point profile:
Surface speed: current speed at the surface
(WD
= 0)
of
the ocean, including any surge and tide.
Speed at mid-profile: current speed at a depth halfway between the surface
(WD
= 0) and the depth
of
the bottom
of
the pro-
file
(O-speed depth).
O-speed depth: the depth, measured from the surface, at which the current speed goes
to
zero, which
is
the bottom
of
the
profile.
Current speeds between the surface, mid-profile and
O-speed depths should be derived by linear interpolation.
The deepwater currents provided in the tables represent those which are generated at
or
within
12
hours
of
the closest approach
of
a hurricane to a given site. As such the currents are confined to the upper layer
of
the ocean. No current
is
specified below the 0-
speed depth
in
the tables, however this should not be taken as an indication that hurricane-driven currents do not penetrate deeper
into the water column.
Over a time period
of
several days, some
of
the momentum
in
the upper layer
of
the ocean will be trans-
ferred downward, resulting
in
currents below the O-speed depth given
in
the table. Resolution
of
these deeper hurricane current
components should be resolved
by
site-specific studies.
8
API BULLETIN 2INT-MET
1.00
0.75
0.85
0.70
Principal Wave Heading
by
Longitude
360 r····
··
·
·r···
·············,·····
······
···
·
·~~
-·~~-
T··········
:··-
····~i·~~~·r··········T···-·~·
···········
~~~ ··i
350
340
g>
330
e.
'><
'0)
320
c:
:g
~
310
"
>
~
300
C-
'u
c:
;t 290
280
270
260
L-~_,_~~
__
~
____
+-
__
~
__
~
____
~
__
-L
__
~
____
~
__
~
__
~
__
~
____
+-
__
~
97
96
-95 -94
-93
-92
-91
-90
89
-88 -87 -86 -85
-84 -83
-82
W Longitude (Deg)
Figure 4.2.2-1-Direction Factor
for
Wave Heights
North
of
26°N, West
of
84°W,
WD
> = 30m (98
ft),
Return Periods> 10 Year
360
340
320
300
Ci
e.
g>
280
~
:I:
"E
260
e
:;
u
240
220
200
INTERIM GUIDELINES
ON
HURRICANE CONDITIONS
IN
THE
GULF
OF
MEXICO
Shallow
Water
(WO
<=
70
m
or
230
ttl
Current
Heading
by
Longitude
_"
:c ~
!
<~
180
L-
____________________________
~
__
~~~
____________________________
,
-97
-96
-95 -94
-93
-92
-91
-90
-89 -88
-87 -86 -85
-84
-83
-82
W
Longitude
(Oeg)
Figure
4.3.1-1-Current
Heading North of 26°N, WD < = 70m (230 ft)
9
Extreme currents in water depths greater than or equal to
ISO
m (492 ft) should be treated as omni-directional; they should not be
factored
in
proportion to wave height. The headings
of
these currents will generally rotate clockwise
in
time under the action
of
coriolis force as they slowly decay following the passage
of
a stonn. For the latitude range
of
the
Gulf
of
Mexico, the current
heading will rotate a full 360
0
clockwise approximately every
22
hours.
4.3.3 Currents
in
Transition Zone
Currents
in
water depths between 70 m and
ISO
m (230 ft and 492 ft) will be
in
a state
of
transition as controlled by the relative
magnitudes
of
the two current forcing mechanisms (horizontal pressure gradients and local wind stress). Currents
in
these water
depths can be approximated by interpolating between the nearly unifonn current profile specified for 70 m (230 ft) (assuming
it
has a 3-point shape), and the deepwater stonn current 3-point profile specified for water depths greater than or equal to
ISO
m
(492 ft). The interpolation involves several steps; the example
in
Section 6 should be reviewed carefully.
When
determining
currents in the transition zone, current profiles for
the
shallow
and
deep areas
should
first be deter-
mined.
The
shallow
water
current
should
be
assumed
to also follow a
3-point
profile for the
purpose
of
interpolation by
the
following
conversion:
Surface speed:
70 m (230
ft)
current speed
Speed at
"mid-profile": 70 m (230 ft) current speed, mid-point set to 70 m (230
ft)
O-speed depth: 70 m (230
ft)
The
resulting profile at the depth between 70 m
and
ISO
m (230 ft and 492 ft) should then be derived by linearly interpolat-
ing between the 70 m and
ISO
m (230 ft
and
492 ft) profiles to the desired depth for each
of
the three points (surface speed,
mid-profile level
and
speed,
and
O-speed depth)
to
define a new 3-point profile. For example,
if
a site is
in
100 m (328 ft),
the
new
profile would be derived by weighting
the
points from
the
profile at 70 m by (150 m - 100 m)/(150 m
-70
m),
or
230 ft by (492 ft - 328 ft)/( 492
ft
- 230 ft), and the points from the profile at 150 m by (100 m - 70 m)/( 150 m - 70 m), or
492
ft
by (328
ft
-
230
ft)/( 492
ft
-
230
ft)'
The
peak
current in the transition region
may
be
considered
omni-directional, however,
in
reality the current would tend to
align parallel to the local bathymetry
in
depths
closer
to 70 m
(230
ft).
In
situations where the 70 m and
ISO
m (230
ft
and
10
API BULLETIN 2INT-MET
492 ft) currents have prescribed headings, the direction
of
the
new
profile can
be
approximated
as the heading
of
the result-
ant derived from the 70 m (230 ft) current
and
the average current over the upper 70 m (230 ft)
of
the 150 m
(492
ft)
current
profile.
The
magnitudes
of
each should be
weighted
to
the
desired depth as is done for the profile calculation,
prior
to
resolving the resultant direction.
4.4 SURGE AND TIDE
The tables show storm surge for water depths greater than or equal to 500 m (1640 ft), and astronomical tidal amplitude applica-
ble to all water depths. For storm surge
in
water depths between
10m
and 500 m (33 ft and 1640 ft), the appropriate regional fig-
ure should be consulted; note that the curves in the figures include the tidal amplitude.
4.5 INDEPENDENT EXTREMES
BY
REGION
The following subsections present the independent extremes for each
of
the four geographical regions (West, West Central, Cen-
tral and East). Tables and figures marked
"A"
are in SI Units, while those marked
"B"
are in U.S. Customary Units.
INTERIM GUIDELINES
ON
HURRICANE CONDITIONS
IN
THE
GULF
OF
MEXICO
4.5.1
West
Table
4.5.1-1A~lndependent
Extreme Values for Hurricane Wids, Waves, Currents and Surge,
Western
Gulf of Mexico
(97SW
to 95.0
0
W)
Return
Period
(Years) 10
25
50
100
200 1000 2000 10000
Wind
(10 m Elevation)
I-hour Mean Wind
Speed (m/s)
22.5 31.2
36.0
39.9
43.0 49.9
51.9
57.9
10-min Mean Wind
Speed (m/s)
24.5
34.4 40.0
44.7 48.4 56.8 59.3 66.8
I-min Mean Wind
Speed (m/s)
27.0 38.6
45.2
50.8 55.3 65.7 68.8
78.3
3-sec Gust (m/s)
30.2
43.9 52.0
58.8 64.4 77.3 81.2
93.1
Waves,
WD
> = 1000 m
Significant Wave Height (m)
6.8
9.8
11.3
13.1
13.7
16.4
17.0
19.0
Maximum Wave Height (m)
12.0 17.3 20.0
23.1
24.2 28.9
30.1
33.6
Maximum Crest Elevation (m)
8.0
11.4
13.1
15.2 16.0 18.9 19.6 21.7
Peak Spectral Period
(5)
12.2 13.8 14.4
15.1
15.3
16.7
17.1
18.0
Period
of
Maximum Wave (s)
11.0 12.4 13.0 13.6 13.8
15.1
15.4
16.2
Currents,
WD
> = 150 m
Surface Speed (m/s)
1.13
1.56 1.80 2.00 2.15 2.49 2.59
2.89
Speed at Mid-profile (m/s)
0.84 1.17 1.35
1.50
1.61
1.87 1.95 2.17
O-Speed Depth (m)
47.3 65.5 75.6
83.8
90.3
104.7 108.9
121.5
Currents,
WD
10m
- 70 m
Uniform
Speed at
10m
Depth (m/s)
0.61
1.17 1.56
1.91
2.22 2.69
2.91
3.61
Unifonn Speed at
70
m Depth (m/s) 0.46 0.88 1.17
1.43
1.66
2.01
2.18
2.71
Water
Level,
WD
> = 500 m
Stonn Surge (m)
0.17 0.32 0.46
0.60 0.76
0.84
0.91
1.14
Tidal Amplitude (m)
0.42 0.42 0.42
0.42 0.42
0.42
0.42
0.42
Notes:
Wind speeds for a given return period are applicable to all water depths throughout the region.
Crest elevation includes associated surge and tide.
See Figures
4.5.1-IA,
4.5.1-2A and 4.5.1-3A for wave and crest elevation values for water depths between
10m
and 1000
m.
The peak spectral period and period
of
maximum wave apply to waves
in
all water depths.
Currents
in
water depths between
70
m and 150 m should be estimated as described
in
4.3.3.
See Figure 4.5.1-4A for surge and tide in water depths less than 500
m.
11
12
20,0
15,0
I
",-
10,0
5,0
10
40,0
35,0
30,0
25,0
I
:r:'
20,0
15,0
10,0
5,0
10
API BULLETIN 2INT-MET
West Region, N-Year H,
10,000
Year
2,000 Year
1,000
Year
200
Year
100 Year
50 Year
25
Year
10
Year
lOe
1000
Water Depth,
MLLW
(m)
Figure
4.5.1-1A-N-Year H
s
'
West
Region
West
Region, N-Year
Hmo<
__
t t-t-:"
10,000 Year
~_-~ : j-~-t t~j
2,000 Year
::::= ,.; ' t 11"""'11 ,000 Year
:::::::::=====+==+=tTi
200
Year
: 100 Year
__
: ; ( lii1
50 Year
__
r-i Til
25 Year
Ll-J-
__
+ ,; ~-:-;-~liI110
Year
100 1000
Water
Depth,
MLLW
(m)
Figure
4.5.1-2A-N-Year H
max
,
West
Region
INTERIM GUIDELINES
ON
HURRICANE CONDITIONS
IN
THE
GULF
OF MEXICO
13
West
Region, N-Year Max
Crest
Elevation
(including
Surge
and Tide)
25.0
10,000
Year
I
c 20.0
2.000 Year
i
1,000 Year
iii
~
~
, 200 Year
u
15.0
100
Year
~
"
::;;
50
Year
25 Year
10.0
10 100 1000
Water Depth,
MLLW
(m)
Figure 4.5,
1-3A-N-Year
Max Crest Elevation, West Region
West
Region, N-Year
Surge
and
Tide
8.0
7.0
6.0
I
5
.
0
'0
;::
~
4.0
~
:l
'"
3.0
2.0
1.0
0.0
10
100
1000
Water
Depth,
MLLW
(m)
Figure
4.5.1-4A-N-Year
Surge with Tide, West Region
14
API BULLETIN 2INT-MET
Table 4.5.1-1B-lndependent Extreme Values for Hurricane Winds, Waves, Currents and Surge,
Western
Gulf of Mexico
(97SW
to
95.0
0
W)
Return
Period (Years)
10
25
50
100 200
1000 2000 10000
Wind
(32.8
ft
elevation)
I-hour Mean Wind Speed (Ills) 73.8 102.4
IIS.I
130.9
141.1
163.7
170.3
190.0
I O-min
Mean Wind Speed (ft/s) 80.4 112.9 131.2 146.7
158.8 186.4 194.6
219.2
I-min Mean Wind
Speed (ft/s)
88.6 126.6
148.3
166.7 181.4
215.6 225.7
256.9
3-sec Gust (ftls)
99.1
144.0 170.6
192.9 211.3
253.6 266.4
305.5
Waves, WD > = 3280
ft
Signiticant Wave Height
(t1)
22.3 32.2
37.1
43.0 44.9
53.8 55.8
62.3
Maximum Wave Height
(ft) 39.4 56.8 65.6 75.8
79.4 94.8 98.8
110.2
Maximum Crest Elevation
(ft)
26.2 37.4 43.0 49.9
52.5
62.0 64.3
71.2
Peak Spectral Period (s) 12.2 13.8 14.4
15.1
15.3
16.7
17.1
18.0
Period
of
Maximum Wave (s)
11.0
12.4
13.0
13.6 13.8
15.1
15.4
16.2
Currents,
WD > = 492 ft
Surface Speed (!tIs) 3.7
5.1
5.9 6.6
7.1
8.2 8.5
9.5
Speed at Mid-profile (Ills) 2.8 3.8 4.4 4.9
5.3
6.1
6.4
7.1
O-Speed Depth (Il)
155
215 248 275
296 344 357
399
Currents,
WD 33
ft-
230
ft
Uniform Speed at
33
ft
Depth (ft/s) 2.0 3.8
5.1
6.3 7.3 8.8 9.5
11.8
Uniform
Speed at 230
fl
Depth
(fl:Is)
1.5
2.9
3.8
4.7 5.4
6.6
7.2
8.9
Water
Level, WD > = 1640
ft
St0n11
Surge (ft) 0.6
1.0
1.5
2.0 2.5
2.8
3.0
3.7
Tidal Amplitude
(ft)
1.4 1.4
1.4
1.4
1.4 1.4 1.4
1.4
Notes:
Wind speeds for a given return period are applicable to all water depths throughout the region.
Crest elevation includes associated
surge and tide.
See Figures 4.5.1-1
8,4.5.1-28
and
4.5.1-38
for wave and crest elevation values for water depths between 33
nand
3280 fl.
The
peak spectral period and period
of
maximum wave apply
to
waves in all water depths.
Currents
in
water depths between 230
nand
492 n should be estimated as described in 4.3.3.
See Figure 4.5.1-4B for surge and tide in water depths less than 1640 ft.
INTERIM GUIDELINES ON HURRICANE CONDITIONS
IN
THE
GULF
OF
MEXICO
15
West Region, N-Year H,
80.0
70.0
60.0
50.0
g
:r:
40.0
30.0
20.0
10.0
10
100
1000 10000
Water Depth, MLLW (tt)
Figure 4.S.1-1B-N-Year
Hs.
West
Region
West Region, N-Year H
m
"
130.0
120.0
110.0
100.0
90.0
g
80.0
:r:.'
70.0
60.0
50.0
40.0
30.0
20.0
10
100 1000 10000
Water Depth, MLLW (tt)
Figure
4.S.1-2B-N-Year Hmax. West
Region