relative permeability of petroleum reservoir
Bạn đang xem bản rút gọn của tài liệu. Xem và tải ngay bản đầy đủ của tài liệu tại đây (8.88 MB, 141 trang )
Relative
Permeability
of
Petroleum
Reservoirs
Authors
Mehdi
Honarpour
Associate
Professor
of Petroleum
Engineering
Department of
Petroleum
Engineering
Montana College
of Mineral Science
and
Technology
Butte,
Montana
Leonard
Koederitz
Professor
of Petroleum
Engineering
Department
of
Petroleum Engineering
University of
Missouri
Rolla. Missouri
A.
Herbert
Harvey
Chairman
Department of
Petroleum
Engineering
University
of Missouri
Rolla, Missouri
@frc')
CRC
Press,
Inc.
Boca
Raton,
Florida
PREFACE
In 1856
Henry P. Darcy determined
that the
rate of
flow of water through a
sand filter
could be
described by the equation
h,-h.
q:KA
-L
where
q
represents
the rate at
which water
flows downward
through a
vertical sand
pack
with cross-sectional
area
A
and
length
L; the terms
h,
and
h, represent
hydrostatic
heads at
the
inlet and outlet,
respectively,
of the sand
filter, and
K is a constant.
Darcy's experiments
were confined to
the flow
of water through
sand
packs which were 1007o
saturated with
water.
Later
investigators determined
that
Darcy's
law could be
modified to describe
the
flow
of
fluids other than
water, and
that the
proportionality constant
K
could
be replaced
by k/
p,
where k is a
property
of the
porous
material
(permeability)
and
p
is a
property
of the
fluid
(viscosity).
With this
modification,
Darcy's
law may be
written in
a
more
general
form
AS
k
l-
dz
dPl
u':*LPgos-dsl
where
S
v
Distance
in direction
of flow,
which is taken as
positive
Volume of
flux across
a unit area
of the
porous
medium in unit time
along
flow
path
S
Vertical coordinate,
which is taken
as
positive
downward
Density of the
fluid
Gravitational
acceleration
Pressure
gradient
along S
at the
point
to
which v. refers
The
volumetric
flux
v. may be further
defined
as
q/A, where
q
is the volumetric
flow
rate
and A
is the average
cross-sectional
area
perpendicular to the
lines of flow.
It can
be shown
that the
permeability term
which appears
in Darcy's
law has units
of
length squared.
A
porous
material
has a
permeability of
I D when a single-phase
fluid with
a
viscosity of
I cP completely
saturates
the
pore space of the
medium and
will flow through
it under
viscous
flow at the
rate of
I
cm3/sec/cm2
cross-sectional
area
under
a
pressure
gradient of
1
atm/cm.
It is important
to
note the
requirement that
the
flowing fluid
must
completely
saturate
the
porous
medium.
Since this
condition
is
seldom
met
in
a
hydrocarbon
reservoir,
it is evident
that
further
modification
of Darcy's
law is needed
if the
law is to be
applied to
the flow
of fluids
in
an
oil or
gas
reservoir.
A
more useful
form of
Darcy's law can
be obtained
if we assurne that
a
rock which
contains
more than
one
fluid has an effective
permeability to each
fluid
phase
and
that the
effective
permeability
to
each
fluid is a
function of
its
percentage saturation.
The effective
permeability of a
rock
to
a fluid
with which
it is 1007.o
saturated
is equal
to the absolute
permeability of the
rock.
Effective
permeability to each
fluid
phase
is considered
to be
independent of the
other
fluid
phases
and the
phases
are
considered
to
be immiscible.
If
we
define
relative
permeability as the
ratio of
effective
permeability to absolute
perme-
ability,
Darcy's
law may
be restated
for a
system
which contains
three
fluid
phases
as
tirllows:
Z
p
g
D
dP
dS
,t
Ir
l5
r
''J.:
ntJtCnal
i\
:.,'nrhlc
cl'lirfl
-
: F)n\lbilit\
.\
l'lllcn c()n5enl
I
Vo.:T(0.,*K-*)
V*.:*(o-'13-t)
Vo,:H(o-r#-k)
Dr. lfcL
lhc
\ltntrna
.{r(arrnl
hrr
r\rfi.Rr{le
I
tnLlt.rs
t>
nl
rstn :
rrrluhng
drc
h
t-;xrlrr
Ti
lrrya
I
\lrsr.n.R.i
R.{1.
[}r }ri
(-}rrrrrrr.n
r I
rcrtr
rrltcrj
t
f-
lldrr
.rl
e Fb
t)
qrtYln\ll
Erjt
n
(tlr.run
DcFtur
r
where
the
subscripts
o,
g,
and
w represent
oil,
gas' and
water,
respectively'
Note
that
k,,,'
k.", and
k,*
are
the
relative
permeabilities
to
the
three
fluid
phases
at
the
respective
saturations
of the
phases
within
the
rock'
Darcy's
law
is the
basis
for
almost
all
calculations
of
fluid
flow
within
a
hydrocarbon
reservoir.
In
order
to
use
the
law,
it
is
necessary
to
determine
the
relative
permeability
of
the
reservoir
rock
to
each
of
the
fluid
phases;
this
determination
must
be
made
throughout
the
range
of
fluid
saturations
that
will be
encountered.
The
problems
involved
in
measuring
and
predicting
relative
permeability
have
been
studied
by
many
investigators.
A
summary
of
the
major
results
of
this
research
is
presented
in
the
following
chapters'
ltr.'
\r,tc thlt
k ,.
re.}
: r'. .
.sturations
Iri:'
"
.,
hrJrttarbon
tt:
.
- :.o.':-tlrcahilitl
of
I
h\
'
.'.ic
throughout
!\.
.
:.:
tn
lllt'a\uring
[r ::
-:
'\
ruilflrof)'
Plc:.
THE AUTHORS
Dr. Mehdi
"Matt"
Honarpour
is
an
associate
professor
of
petroleum
engineering at
the
Montana College
of Mineral Science
and
Technology,
Butte, Montana.
Dr. Honarpour
obtained
his B.S., M.S., and
Ph.D.
in
petroleum
engineering
from
the
University of
Mis-
souri-Rolla.
He has authored
many
publications
in
the
area of reservoir engineering
and
core
analysis.
Dr. Honarpour
has
worked
as
reservoir engineer,
research engineer, consultant,
and teacher
for the
past
15
years. He is a
member of several
professional organizations,
including the
Society of
Petroleum
Engineers of
AIME, the
honorary society of Sigma
Xi,
Pi
Epsilon Tau and
Phi Kappa
Phi.
Leonard
F. Koederitz
is a
Professor
of Petroleum
Engineering at
the University
of
Missouri-Rolla.
HereceivedB.S.,
M.S., andPh.D.
degrees
fromtheUniversityof
Missouri-
Rolla.
Dr. Koederitz
has worked
for Atlantic-Richfield
and
previously served as Department
Chairman
at Rolla.
He has authored
or
co-authored
several technical
publications and two
texts
related to
reservoir engineering.
A. Herbert Harvey
received B.S. and
M.S. degrees from Colorado School
of Mines
and a Ph.D. degree from the University
of Oklahoma.
He has authored or co-authored
numerous
technical
publications
on topics
related to the
production
of
petroleum.
Dr. Harvey
is
Chairman
of both the Missouri Oil
and
Gas
Council and the
Petroleum Engineering
Department at the University of
Missouri-Rolla.
ACKNOWLEDGMENT
The
authors wish
to acknowledge
the Society of Petroleum
Engineers and
the American
Petroleum
Institute
for granting
permission
to use their
publications.
Special thanks are due
J. Joseph
of Flopetrol
Johnston
and
A.
Manjnath of Reservoir Inc.
for their
contributions
and
reviews
throughout
the writing of
this book.
ctf,
rh
t
n
m
n
l
\l
fslc
CLI
tr
I
u
I
t\
I
rl
ru
rltr
tt
t
u
ll*
tu
trl
t
I
I
n
I
r|
n.j thc
Anrerican
li
:::.,nk.
are
due
rr:
-
'ntributions
TABLE
OF CONTENTS
Chapter
I
Measurement
of
Rock
Relative
Permeability
.
I.
Introduction.
. .
il.
Steady-State
Methods
.
A.
Penn-State
Method
B.
Single-Sample
Dynamic
Method
C.
Stationary
Fluid
Methods
D.
Hassler
Method.
E.
Hafford
Method
F.
Dispersed
Feed Method
.
I
I
1
I
2
4
4
5
5
6
8
9
10
t2
III.
IV.
V.
VI.
Unsteady-
State
Methods
Capillary
Pressure
Methods
Centrifuge
Methods
Calculation
from
Field Data
.
References.
Chapter
2
Two-Phase
Relative
Permeability
15
I.
Introduction
15
II.
Rapoport
and
Leas
'
15
III. Gates,Lietz,andFulcher
16
IV.
Fatt,
Dykstra,
and
Burdine.
16
V.
Wyllie, Sprangler,
and
Gardner.
' .
19
VI.
Timmerman,
Corey,
and Johnson
. .20
VII.
Wahl, Torcaso,
and
Wyllie
VIII.
Brooks and
Corey
. . . .27
XIIX.
Wyllie, Gardner,
and
Torcaso
. . .
.
.29
X.
Land,
Wyllie,
Rose,
Pirson,
and
Boatman
30
XI.
Knopp,
Honarpour
et al.,
and
Hirasaki
. . .
. . .37
References
41
Chapter
3
Factors
Affecting
Two-Phase
Relative
Permeability
45
I.
Introduction
45
il.
Two-Phase
Relative
Permeability
Curves
45
n. Effects
of Saturation
States
49
IV.
Effects of
Rock Properties
50
V. Definition
and Causes
of
Wettability.
54
VI.
DeterminationofWettability
58
A. Contact
Angle Method
58
B.
ImbibitionMethod.
60
C.
Bureau of
Mines
Method
63
D. Capillarimetric
Method
63
E.
FractionalSurfaceAreaMethod
64
F.
Dye
Adsorption
Method
'
.64
G.
Drop Test
Method.
. .
64
H.
Methods of
Bobek et
al.
64
I.
Magnetic
Relaxation
Method
64
J.
Residual
Saturation
Methods
.65
27
K.
Permeability
Method
65
L. Connate
Water-Permeability
Method
66
M.
Relative Permeability
Method
66
N.
Relative
Permeability
Summation
Method
61
O.
Relative
Permeability
Ratio
Method
67
P.
Waterflood
Method
68
a.
Capillary
Pressure
Method
.
68
R.
Resistivity
Index
Method
.
68
VII.
Factors
Influencing
Wettability
Evaluation
. 68
VIII.
Wettability
Influence
on
Multiphase
Flow
. . .72
IX.
Effects of Saturation
History
'74
X.
Effects of Overburden
Pressure
' 78
K)(I.
Effects
of Porosity
and
Permeability
79
XII.
Effects
of Temperature.
. .82
XIII.
Effects
of Interfacial
Tension and
Density
. . .82
XIV. Effects
of
Viscosity
.
.;
. ' ' 83
XV. Effects
of
Initial
Wetting-Phase
Saturation
89
XVI.
Effects
of an
Immobile
Third
Phase
. '. 90
XVII.
Effects
of Other
Factors
. . .92
References
97
Chapter
4
Three-Phase
Relative
Permeability
f 03
I.
Introduction
103
il.
DrainageRelativePermeability
'.104
A. Leverett
and
Lewis
' . . 104
B. Corey,
Rathjens,
Henderson,
and
Wyllie
105
C.
Reid.
107
D.
Snell.
l0g
E.
Donaldson
and
Dean
. . I l0
F.
Sarem
113
G.
Saraf
and
Fatt
I 15
H.
WyllieandGardner
.'ll5
m.
Imbibition
Relative
Permeability
117
A.
Caudle,slobod,andBrownscombe
117
B.
Naar and
Wygal
I
17
C.
Land.
120
D. SchneiderandOwens
123
E.
Spronsen
.' 123
IV.
Probability
Models
. .123
V. ExperimentalConfirmation
126
U\/I. LaboratoryApparatus
127
VII.
Practical Considerations
for Laboratory
Tests
' 132
VIII. ComparisonofModels
'133
References""'
"""'134
Appendix
Symbols.
137
Tbc
I
hr crth
r3th\
rrl
c{ehlr.
\,ilUt-3ll
irlurltl
thc crr
Itrf
ft\
thc
Ha
ln
tt
thc
tc.
drrqlg
urcfrr|
fa
nx
A.h
Tht
d'er
ad'
Frgun
nrun
alrr
P
Thc
t
r
alCr
Ftrst
.r
hrs
L-Tth
rltc\
rlctcn
rnU\\
ktt
t
rrcrgl
tlr
.i
Th
than
TTE:N
a.
flt
Itr
lfi'
rnarl
ln ci
r-all,
thYl.
6-i
66
66
6-
6-
6,\
hs
h\
6\
-:
l
Chapter
I
MEASUREMENT OF
ROCK RELATIVE PERMEABILITY
I.
INTRODUCTION
The
relative
peffneability
of a
rock
to each
fluid
phase
can be
measured in
a core
sample
by either
"steady-state"
or
"unsteady-state"
methods. In the
steady-state method, a fixed
ratio of fluids is forced through the test sample until saturation and
pressure
equilibria are
established.
Numerous
techniques have been successfully employed to obtain a uniform
saturation.
The
primary
concern in designing the experiment
is
to eliminate or reduce the
saturation
gradient
which is
caused
by capillary
pressure
effects
at the outflow boundary
of
the core. Steady-state methods are
preferred
to unsteady-state methods by some investigators
for
rocks of intermediate
wettability,'
although some difficulty
has
been reported in applying
the
Hassler
steady-state method to this type
of rock.2
ln
the capillary
pressure
method, only the nonwetting
phase
is injected into
the core during
the test. This fluid displaces the
wetting
phase
and the
saturations
of both
fluids
change
throughout the test. Unsteady-state techniques
are
now employed for most laboratory
meas-
urements of
relative
permeability.3
Some
of the more commonly used
laboratory methods
for measuring relative
perrneability
are
described below.
II. STEADY-STATE
METHODS
A. Penn-State Method
This steady-state method
for measuring
relative
perrneability
was designed by
Morse
et
al.a and
later modified by Osoba et aI.,5
Henderson and
Yuster,6
Caudle
et a1.,7 and Geffen
et al.8 The
version of the apparatus
which was described by Geffen
et al., is illustrated by
Figure
l. In
order
to reduce end effects
due to capillary
forces, the sample to be tested is
mounted between two
rock samples which
are similar to the test
sample. This
arrangement
also
promotes
thorough
mixing of the
two fluid
phases
before they enter the test sample.
The laboratory
procedure is
begun
by saturating the
sample with one fluid
phase
(such
as
water)
and adjusting
the flow
rate
of
this
phase
through the
sample until a
predetermined
pressure gradient
is obtained. Injection of
a second
phase
(such
as
a
gas)
is then begun at
a
low rate and flow of the first
phase
is reduced slightly
so that the
pressure
differential
across the
system remains constant.
After an equilibrium condition
is reached, the two flow
rates
are
recorded and the
percentage
saturation of each
phase
within the test sample
is
determined by removing the test sample
from the assernbly and
weighing it. This
procedure
introduces
a
possible
source of experimental error,
since a small amount
of fluid may be
lost because of
gas
expansion and
evaporation. One authority
recommends that the core be
wgighed under oil, eliminating
the
problem
of obtaining the
same
amount
of liquid film on
the
surface of the core for each
weighing.3
The estimation
of water saturation by measuring electric
resistivity is a
faster
procedure
than
weighing the core. However, the accuracy
of saturations obtained
by
a
resistivity
measurement is
questionable,
since resistivity can be
influenced by fluid distribution as
well
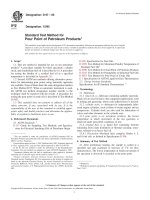
as fluid saturations. The four-electrode assembly
which is illustrated by Figure
I was
used
to investigate
water saturation distribution and to determine
when flow
equilibrium
has been
attained. Other methods
which have been used for in situ determination
of fluid saturation
in cores include
measurement
of electric
capacitance, nuclear
magnetic resonance, neutron
scattering,
X-ray
absorption,
gamma-ray
absorption,
volumetric
balance,
vacuum distilla-
tion, and microwave techniques.
.le
Relative Permeabilin of
Petroleum
Reservoirs
El-ectrodes
Outl-et
Differential
Pressure
Taps
Inlet
Inlet
FIGURE
l. Three-section core assembly.8
After fluid
saturation in the core has been determined, the Penn-State
apparatus is reas-
sembled, a new equilibrium
condition
is
established at a higher flow rate for
the second
phase,
and
fluid
saturations are determined as
previously
described. This
procedure
is re-
peated
sequentially
at
higher
saturations of the second
phase
until the complete relative
permeability
curve
has
been established.
The Penn-State
method can be
used to
measure relative
permeability
at either increasing
or decreasing saturations
of the wetting
phase
and it can be applied
to both
liquid-liquid
and
gas-liquid
systems. The direction
of
saturation
change used
in
the laboratory should cor-
respond to field conditions.
Good capillary contact between the test sample
and the adjacent
downstream core is
essential
for
accurate
measurements
and temperature must be held
constant during the test. The
time
required for
a test to
reach
an equilibrium condition may
be I day or more.3
B.
Single-Sample Dynamic Method
This technique for
steady-state measurement of
relative
permeability
was developed
by
Richardson
et al.,e Josendal
et
al.,ro
and
Loomis and Crowell.ttThe
apparatus and exper-
imental
procedure
differ from those
used
with the Penn-State technique
primarily
in the
handling of
end effects. Rather than using a test sample
mounted
between two core samples
(as
illustrated
by
Figure
1), the two fluid
phases
are
injected
simultaneously through a
single
core. End effects are minimized
by using
relatively high flow rates,
so the region of high
wetting-phase
saturation at the outlet face of the core is small. The theory which was
presented
by Richardson et al. for describing
the
saturation distribution within
the core
may
be de-
veloped
as
follows. From Darcy's law, the
flow of two
phases
through a horizontal linear
system can be
described by the equations
-dP*,
:
Q*,
F*,dL
k*,
A
tL*
tl
rEC
I rr rrl
(l)
kir
F.
rfi
cFr
g:f
rdt
tqr
ll
er
G
f,F:
5X
and
,n
Q.
Fr"
dL
-dPn:
=i^
Q)
where the subscripts wt
and
n
denote the
wetting
and
nonwetting
phases,
respectively. From
the definition of capillary
pressure,
P", it follows
that
1.0
o
a
0
lel
.
ICsr-
J
ii-
*i'trDd
CE'.i-:;
ir
[C-
plcir
:Jtrtr\r'
3T
.:'. :t.t.tIlS
id
;:J
end
I
ri,' J
r-trf-
J
li.
;
., .:
'
.ric
rll
nr-'
\'
hcld
tr\.
:
-
mJ\
lc.l.
,i*-J
b)
!
-::- C\F'r-f-
D r:.
'
rn thC
Cr':; :::lplCr
BJ ,,.:l'l!ls'
f3h
"
: nrsh
Jil.
l-:
s'ntcrj
!
n-:.
re'
Jc-
iz '.
a(rr
5 10
15
20
25
Distance
from Outflow
Face,
cffi
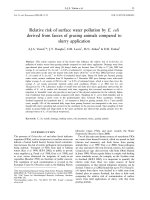
FIGURE 2.
Comparison
of saturation
gradients
at low
flow rate.e
dP.:dP dP*,
These three equations
may be
combined to
obtain
qP.
:
/Q*,
Fr,*,
_
9"U=\
/
o
dL
\
k*,
kn
//
where dP"/dL is the capillary
pressure
gradient
within the core. Since
dP.
:
dP.
ds*,
dL
dS*, dL
it is
evident
that
(3)
(4)
(s)
(6)
dS*,
dL
|
/Q*,
Fr*,
Q"p.\
I
:A\
k*
-
L"
/op.rus*
,lt
Richardson et
al. concluded
from experimental
evidence
that the nonwetting
phase
sat-
uration at
the discharge
end of
the core
was at
the equilibrium
value,
(i.e.,
the saturation
at
which the
phase
becomes
mobile).
With this
boundary
condition,
Equation 6 can
be
integrated
graphically
to
yield
the
distribution
of wetting
phase
saturation
throughout
the
core.
If the
flow rate
is sufficiently
high,
the calculation
indicates that
this saturation
is
virtually constant
from the
inlet
face to a
region a
few centimeters
from the
outlet.
Within
this
region the
wetting
phase saturation
increases to the equilibrium
value at the
outlet
face.
Both
calculations
and experimental
evidence
show that
the region
of high
wetting-phase
saturation
at
the discharge
end
of the core
is
larger at low
flow rates than
at high
rates.
Figure
2 illustrates
the saturation
distribution
for a
low flow rate and
Figure 3
shows the
distribution
at a
higher
rate.
a
r
_l
Ftt',
c.r From
\o
\.o
>{^
/
-i-
-o-
Theoretical
saturation
gradient
f nf low f ace
1>
Relative
Permeability
of
Petroleum
Reservoirs
1.0
\o't
I
-o-o-
-o o-
- :-
:
-
J
t
Theoretical
saturation
gradient
Inf row
rac"
a>l
o
5
10
15
20
25
Distance
from
Outflow
Face,
ctrl
FIGURE
3.
Comparison
of saturation
gradients
at high
flow
rate.e
Although
the
flow
rate
must
be
high
enough
to
control
capillary
pressure
effects
at
the
discharge
end
of the
core,
excessive
rates
must
be
avoided.
Problems
which
can
occur
at
very
high
rates
include
nonlaminar
flow.
C.
Stationary
Fluid
Methods
Leas
et al.12
described
a technique
for
measuring
permeability
to
gas
with
the
liquid phase
held
stationary
within
the
core
by
capillary
forces.
Very
low gur
flo*
rates
must
be
used,
so
the
liquid
is not
displaced
during
the
test. This
technique
was
modified
slightly
by
Osoba
et
al.,s
who
held
the
liquid phase
stationary
within
the
core
by
means
of
barriers
which
were
permeable
to
gas
but not
to the
liquid.
Rapoport
and
Leasr3
employed
a
similar
technique
using
semipermeable
barriers
which
held
the gas phase
stationary
while
allowing
the
liquid
phase
to
flow.
Corey
et
al.ra
extended
the stationary
fluid
method
to
a
three-phar.
ryri
by
using
barriers
which
were
permeable
to water
but impermeable
to oil
and gas.
Osoba
et
al.
observed
that
relative permeability
to
gas
determined
by
the
stationary
liquid
method
was
in
good
agreement
with
values
measured
by
other
techniques
for
some
of
the
cases
which
were
examined.
However,
they
found
that
relative permeability
to
gas
determined
by
the
stationary
liquid
technique
was
generally
lower
than
by
other
methods
in
the
region
of
equilibrium
gas
saturation.
This
situation
resulted
in
an
equilibrium
gas
saturation
value
which
was
higher
than
obtained
by
the
other
methods
used
(Penn-Siate,
Single-Sample
Dynamic,
and
Hassler).
Saraf
and
McCaffery
consider
the
stationary
fluid
methods
to be
unrealistic,
since
all mobile
fluids
are
not
permitted
to flow
simultaneously
during
the
test.2
D.
Hassler
Method
This
is
a steady-state
method
for
relative permeability
measurement
which
was
described
by
Hasslerrs
in 1944.
The
technique
was
later
studied
and
modified
by
Gates
and
Lietz,16
Brownscombe
et
?1.,"
Osoba
et
al.,s
and
Josendal
et
al.ro
The
laboratory
apparatus
is
illustrated
by
Figure
4.
Semipermeable
membranes
are
installed
at each
end of
the
Hassler
test
assembly.
These
membranes
keep
the
two
fluid
phases
separated
at the
inlet
and
outlet
of
the
core,
but
allow
both
phases
to
flow
simultaneously
through
the
core.
The pressure
o
a
ns:ii
tu
t'br
cr';rd
crl
n
.trlf!
fl:e
rc
;rrbt
lrl
tw.l.
Ilr l{rr
4rS
r
LT
TLr
r
rqSl
r&s
rl
*&r
bFr
hfrl
GFr
df
rfE
Hild
rbd
t-q
lbr
H
FLOWMETER
C:'-
.'.
-:l
lhc
l
l.rl
I
.
-
la_r\'
B
i,'.j.
li
.
-,
'
\v\3
Jl
*'
ACrC
l&'
- .
-:.rquc
'h-
"
- :q;rJ
ft
.ii'n'l
3a.
.
.h:
Cl
lqL.
:
-,crlxrJ
I
o:
:-i
.jr\e\
brc:
:cri
br
drc
';;.,\i
trf
h:
:
r
alue
br
.
rimple
tst:n
i.
lrr
h€
lin5
: c
tcrt
:
Ia-
.1c 'nhed
I
an;
l-rc'tz.
^
aF:'-::.1tu\
ls
J
ti^ t
l{e ler
lct
-,-:
'xrtlc't
Th.
:-i; urc'
FIGURE
4.
Two-phase relative
permeability apparatus.r5
in each
fluid
phase
is measured
separately through
a semipermeable
barrier.
By
adjusting
the flow
rate of the
nonwetting
phase,
the
pressure
gradients
in the
two
phases
can be
made
equal, equalizing
the
capillary
pressures
at the
inlet and outlet
of the core.
This
procedure
is designed to
provide
a
uniform saturation
throughout
the
length of the core, even
at low
flow
rates, and thus
eliminate the
capillary end
effect.
The technique
works well under
conditions
where the
porous medium is strongly
wet
by one
of the fluids, but
some difficulty
has been
reported
in using the
procedure under conditions
of
intermediate
wettability.2'r8
The
Hassler
method
is not widely used
at this
time, since the
data can be obtained
more
rapidly
with other
laboratory
techniques.
E.
Hafford
Method
This steady-state
technique
was described
by Richardson
et al.e In this
method the non-
wetting
phase
is injected directly
into the
sample and the
wetting
phase
is
injected through
a disc
which is impermeable
to the
nonwetting
phase.
The central
portion
of the semiperme-
able
disc is
isolated from the
remainder of the
disc by a small
metal sleeve, as
illustrated
by
Figure 5.
The central
portion
of the disc
is used to measure
the
pressure
in the
wetting
fluid at the
inlet of the
sample. The
nonwetting
fluid is injected directly
into the sample and
its
pressure
is measured through
a standard
pressure
tap
machined into the
Lucite@ sur-
rounding the sample.
The
pressure
difference between
the
wetting and the nonwetting
fluid
is a
measure of the
capillary
pressure
in the
sample at the
inflow end. The design
of the
Hafford apparatus
facilitates investigation
of
boundary
effects at the
influx
end
of the core.
The outflow boundary effect
is minimized by using
a high flow
rate.
F.
Dispersed
Feed Method
This is a steady-state
method
for measuring
relative
permeability
which was designed
by
Richardson
et al.e The technique
is similar to
the Hafford and
single-sample dynamic
meth-
Relative
Permeabilin
of Petroleum Reservoirs
GAS
I
GAS
PRESSURE
GAUGE
PRESSURE
GAS
METER
OIL BURETTE
FIGURE
5.
Hafford relative permeability
apparatus.e
ods.
In
the dispersed
feed
method,
the wetting
fluid
enters
the test sample
by first passing
through
a
dispersing
section,
which
is made
of a
porous
material
similar
to the
test sample.
This
material
does not
contain
a
device for measuring
the input
pressure
of the wetting phase
as does
the Hafford
apparatus.
The
dispersing
section
distributes
the wetting
fluid
so
that
it
enters
the test sample
more
or less
uniformly
over the inlet
face.
The
nonwetting
phase
is
introduced
into radial grooves
which
are machined
into
the
outlet face
of the
dispersing
section,
at the
junction
between
the
dispersing material
and
the test sample.
Pressure gradients
used for
the
tests are high
enough
so the boundary
effect at
the outlet
face
of the
core is
not
significant.
III.
UNSiuoo"-STATE
METHoDS
Unsteady-state
relative
permeability
measurements
can
be made
more rapidly
than
steady-
state measurements,
but the mathematical
analysis
of
the unsteady-state procedure
is
more
difficult. The
theory
developed
by Buckley and Leverettre
and extended
by
Welge2o
is
generally
used for
the measurement
of
relative permeability
under
unsteady-state
conditions.
The
mathematical
basis for interpretation
of the
test data
may be
summarized
as follows:
Leverett2r
combined
Darcy's
law
with a definition
of
capillary
pressure
in differential
form
to obtain
f*z
'*;h(*-eApsino)
(71
r +
In.&
k*
Fo
where
f*,
is
the fraction
water
in
the outlet stream;
q,
is
the superficial
velocity
of total fluid
leaving
the
core;
0 is
the angle
between
direction x
and horizontal;
and
Ap is
the density
PRESSURE
rtl
.r[I
t
'.lt
Sn
I
.
t
!|t
llE
3
^
-
G€
I
t
-:.'iJr
-
il.1::
-
:a\re
f
\\
-"
ac,'
r\
I
.
-
i:::()n\
|
'
.ltrrA
r
br::
:. ltrfln
rl
tOt
: ::l
ilurd
b
::.c
Jcnsrtr
lf.'.'
:: rfiS
I
tc.
-:-::iic
fc:'
-
-
llrr<'
bt*
-,-:l
:l
lrr-
''
j\'
:\
le
.:
.:t":.to!
Er
-::,i.cfilr
J
:
-, :c
r\
.(#)
/,(a
7
difference between displacing and displaced
fluids. For
the case of horizontal flow
and
negligible capillary
pressure,
Welge2o
showed that
Equation
7
implies
S*.u,
-
S*z
:
f.r,
Q*
where the
subscript
2
denotes the
outlet end of the core, S*.ou
is
the average water saturation;
and
Q*
is the cumulative
water injected,
measured in
pore
volumes.
Since
Q*
and S*.,u can
be
measured experimentally,
f",
(fraction
oil in the outlet stream)
can be determined from
the
slope of a
plot
of
Q*
as
a function of S*,ou.
By
definition
l,z:q,,/(q,,*q*)
By combining this
equation with Darcy's
law, it can be shown that
I
f,,r:
'
tlOt
I1.,/
K ,
t
*
tr/.,*
Since
p"
and
pw
are known, the relative
permeability
ratio k.o/k.*
can be determined from
Equation 10. A
similar expression can be derived for the case of
gas
displacing oil.
The work
of
Welge was
extended by Johnson et a1.22
to
obtain
a technique
(sometimes
called the JBN method) for calculating individual
phase
relative
permeabilities
from
unsteady-
state test data. The
equations
which were
derived are
k
:
(8)
(e)
f,,,
and
k.o:
ltoo,,,
t.z
ttr.
where I,,
the ?elative injectivity, is
defined as
(
I l)
(12)
(
l3)
I,:
injectivity
initial
injectivity
(q*,/Ap)
(q*,/Ap)
at start of
injection
A
graphical
technique
for solving Equations 1l and 12 is illustrated in Reference L3
Relationships describing relative
permeabilities
in a
gas-oil
system may be obtained
by
replacing
the subscript
"w"
with
"g"
in Equations lI,12, and 13.
In designing experiments to
determine relative
permeability
by the unsteady-state
method,
it
is
necessarv
that:
The
pressure gradient
be
large
enough to
minimize
capillary
pressure
effects.
The
pressure
differential across the core be sufficiently small compared with
total
operating
pressure
so that compressibility effects are
insignificant.
The core be homogeneous.
The driving force and fluid
properties
be held constant during
the test.2
l.
2.
3.
4.
Relative
Permeabilin of
Petroleum
Reservoirs
Laboratory
equipment
is
available for making the unsteady-state
measurements
under sim-
ulated
reservoir
conditions.2a
In
addition to the JBN method, several alternative techniques for determining relative
permeability
from
unsteady-state test data
have
been
proposed.
Saraf and McCaffery2
de-
veloped
a
procedure
for obtaining relative
permeability
curves from
two
parameters
deter-
mined by least squares fit
of oil
recovery and
pressure
data. The technique is believed
to
be superior to the JBN method for heterogeneous carbonate cores. Jones and Roszelle25
developed a
graphical
technique for evaluation
of individual
phase
relative
permeabilities
from
displacement experimental data which are
linearly scalable.
Chavent et al. described
a
method for
determining two-phase
relative
permeability
and capillary
pressure
from
two
sets of displacement
experiments,
one set conducted at a
high
flow rate and the other at a
rate representative
of reservoir conditions.
The
theory
of Welge was
extended by Sarem to
describe relative
permeabilities
in a system containing three fluid
phases.
Sarem employed
a
simplifying
assumption
that the
relative
permeability
to each
phase
depends only on its
own saturation,
and the
validity
of this assumption
(particularly
with respect to the
oil
phase)
has been
questioned.2
Unsteady-state relative
permeability
measurements
are
frequently
used to determine
the
ratios k*/ko,
ks/k", and kr/k*. The ratio k*/k" is used to
predict
the
performance
of reservoirs
which
are
produced
by waterflood
or
natural water
drive;
kr/k"
is employed to
estimate the
production
which will be
obtained
from recovery
processes
where
oil is displaced
by
gas,
such as
gas
injection or solution
gas
drive. An important use of
the
ratio k*/k*
is in the
prediction
of
performance
of natural
gas
storage
wells,
where
gas
is injected into
an aquifier.
The ratios
k*/ko, kg/ko,
and
kr/k*
are usually
measured in
a system
which
contains only
the
two fluids for which
the relative
permeability
ratio is to be determined. It is
believed that
the connate
water
in the
reservoir may have an
influence on kg/k.,,
expecially
in sandstones
which
contain
hydratable clay minerals and
in low
permeability
rock. For these types of
reservoirs it may
be advisable
to measure
k*/k., in
cores
which
contain an
immobile water
saturation.2a
IV. CAPILLARY PRESSURE METHODS
The
techniques which are
used
for
calculating
relative
permeability
from capillary
pressure
data were
developed
for
drainage situations,
where a
nonwetting phase
(gas)
displaces a
wetting phase
(oil
or water). Therefore
use
of the techniques
is
generally
limited
to
gas-oil
or
gas-water
systems,
where
the reservoir
is
produced
by a drainage
process.
Although it
is
possible
to calculate
relative
permeabilities
in a water-oil system from capillary
pressure
data, accuracy of this technique is
uncertain;
the displacement of oil by
water
in a water-
wet rock
is an imbibition
process
rather than a drainage
process.
Although
capillary
pressure
techniques
are
not usually the
preferred
methods for
generating
relative
permeability
data,
the
methods
are useful
for
obtaining
gas-oil
or
gas-water
relative
permeabilities
when rock samples
are too
small for flow tests
but
large
enough for mercury
injection. The
techniques are also useful in rock which has such low
permeability
that
flow
tests are impractical
and for instances where capillary
pressure
data have
been
measured
but
a sample
of the
rock is
not available for measuring relative
permeability.
Another
use
which
has been
suggested
for
the capillary
pressure
techniques is in
estimating
kr/k"
ratios for
retrograde
gas
condensate reservoirs,
where oil
saturation increases
as
pressure
decreases,
with
an
initial
oil saturation which may be as low as zero. The capillary
pressure
methods
are recommended
for this situation because the conventional unsteady-state
test
is not
de-
signed for very
low oil saturations.
Data obtained
by
mercury injection are customarily
used when relative
permeability
is
estimated by the capillary
pressure
technique. The core is
evacuated
and
mercury
(which
is
tmcl
#r},
r;ra;
t
& rsri
kr6
rlrn
I
fr*
d*b
lr
A't|
iltr
h
h
B
uLJr'l
rllTl-
Dlnj:i rllrc'
f
-:l
l-
-'.
Jc-
flc"
-
.:ilCr-
J
i* :cicJ
to
d
R
.zcllc':'
3fi:.;:^illlts'r
rl
:rhcd
fE
" 'l'.
l\Atr
lr
"'-':
r[ r
f'.
:.::;::l
ltr
!n
"
':'
",cJ
J
r
-
'
::\
h'
.' :.i''
lrc'-'
-
c
ihc
Ol
'-
-J ,'tr\
f
6:
'"
-r.
tilc
Xc":
!1
A.
:
thc
D
a-
-:* - iilc't
;tr
: r
thc
br
-, llr.rl
l.
,:.it.
r
-'r-\,r'
D'-
.*
-:lJl
br.
:':; urc
)
;
.,
.: '\
J
bJ'
: rrll
.1
"
'-
rr
br-,
'-
i-,rc
f
i-
^
:iS[-
!l
:;
-
J:rilng
illl'-; rllrc'
lft":
"
i':.un
lq
:-:l
!ltr$
ts.:.
-:'.'J
hut
tf
-r-'
u
hrch
t
t:ltrr:
lt)r
E
.le . :t'a:€s.
Drc
::.cthtrJr
!l
:. :,'t
de-
ItrK'-:^ 11\
rs
;:\
''i
lr;h
is
9
the
nonwetting
phase)
is injected
in
measured increments
at
increasing
pressures. Approx-
imately
20 data
points
are
obtained
in a typical
laboratory test
designed to
yield
the complete
capillary
pressure curve,
which
is required
for calculating
relative
permeability
by the meth-
ods described
below.
Several
investigators
have developed
equations
for estimating
relative
permeability from
capillary
pressure
data.
Purcell2e
presented the equations
fs*i
l,
dS/pi
k.*,
:
fl
t
dS/Pi
I'
ds/p!
JSo
i
k.n*,:
fl
J,
dS/pi
(
l4)
and
(
l5)
where
the
subscripts
wt
and
nwt denote the
wetting and
nonwetting
phases,
respectively,
and
n has a
value
of
2.0. Fatt and
Dykstra3o developed
similar equations
with
n
equal
to
3.0.
A slightly different
result
is
obtained
by combining
the equations
developed by
Burdine3l
with
the
work of Purcell.2e
The results are
(
l6)
(
l7)
where
S,
is the total liquid
saturation.
V.
CENTRIFUGE
METHODS
Centrifuge
techniques
for
measuring
relative
permeability
involve
monitoring
liquids
pro-
duced
from
rock samples
which were
initially saturated
uniformly
with one
or two
phases.
Liquids are collected
in transparent
tubes connected
to the rock
sample holders and
production
is monitored throughout
the test.
Mathematical
techniques
for deriving
relative
permeability
data
from these
measurements
are described
in References
26, 27, and
28.
Although
the centrifuge
methods
have
not been
widely used, they
do offer some
advantages
over alternative
techniques.
The centrifuge
methods are
substantially
faster than the
steady-
state techniques
and they apparently
are
not subject to
the viscous
fingering
problems
which
sometimes
interfere
with the unsteady-state
measurements.
On
the other
hand, the centrifuge
methods are
subject to
capillary
end effect
problems
and they
do not
provide
a
means for
determining
relative
permeability to the
invading
phase.
O'Mera
and
Lease28 describe
an automated
centrifuge
which employs a
photodiode
array
in
conjunction
with a
microcomputer
to
image and
identify
liquids
produced
during
the test.
t0 Relative
Permeabiliy
of Petroleum Reservoirs
CAMER
CENTRIFUGE
LIQUID PRODUCTION
TROBE
SPEED
DISK
FIGURE
6. Automated
centrifuge system.28
Stroboscopic
lights
are located
below
the
rotating
tubes
and movement
of fluid interfaces
is monitored
by
the transmitted
light.
Fluid collection
tubes
are square
in cross
section,
since
a cylindrical
tube would
act as
a
lens
and concentrate
the light
in a narrow
band
along
the major
axis of
the tube. A
schematic
diagram of
the apparatus
is shown
by Figure
6.
VI.
CALCULATION
FROM FIELD
DATA
It is
possible
to calculate
relative
permeability
ratios
directly
from field
data.23In
making
the
computation
it is
necessary
to recognize
that
part
of the
gas
which is
produced
at the
surface
was dissolved
within
the
liquid phase
in
the reservoir.
Thus;
(produced
gas)
:
(free
gas)
*
(solution
gas)
(18)
If
we
consider
the
flow
of free
gas
in
the reservoir, Darcy's
law
for
a radial
system may
be
written
SrmrLrlr
Thll. tu
rtts:rt
r.
\&trt
or
fra
g,
;rrrrrrhrr
rrrr-l t r
9g.fr""
:
Thc
n
:Rr!tn
lr*rj nr
.E! E
h
F'fr'
if rttl
t
:u-bil
tr
r*l
trt
I
tru:
:3rr
FFr
lr}-rr
f$lrI1
hor I
Fcr
-
lst'
kh P.
-
P
?.09-E-e
-w
FrB,
ln
(r./r*)
(
l9)
COMPUTER
o
z
LIJ
o
o
uJ
LIJ
o-
a)
o
U'
IJJ
tr
o
o
J
:
CONTROLLER
SPEED
SET
POINT
ll
?
FIGURE
7. Calculation
of
gas-oil
relative
permeability values from
production
data.
Similarly,
the rate of
oil flow
in
the
same system
is
where
r* is the well
radius and
r" is the
radius
of the external
boundary
of the area
drained
by the
well.
B"
and
B, are
the oil and
gas
formation
volume
factors, respectively.
The ratio
of free
gas
to oil
is obtained
by
dividing
Equation
19 by
Equation
20. lt
we
express
Ro,
cumulative
gas/oil
ratio and
R,, solution
gasioil ratio, in terms
of standard
cubic
foot
per
stock tank
barrel,
Equation
l8 implies
Ro:
s.6tslu*'*
*.
Ko
ltrs
be
Thus, the
relative
permeability
ratio
is
given
by
(20)
(22)
(2t)
k"
ko
S.:
(t-
too,)
*,t-
s*)
_
(Ro
-
R.)&-!!
5.615
B.
F.
l|i
'':J:1Jac\
!n
\e\ll()n.
I
^-:lJ
rltr0S
I
F
,:l
6
l:
1' :::rltng
Dd
:l
the
l\r
|
:',
.t::t
tx?)
The oil
saturation
which corresponds
to this
relative
permeability ratio may be determined
from a material
balance.
If
we
assume
there
is no
water influx, no
water
production,
no
fluid
injection,
and
no
gas
cap, the
material
balance
equation
may be
written
where minor effects
such
as change
in reservoir
pore
volume have been
assumed
negligible.
In Equation
23 the symbol
N denotes
initial
stock tank barrels
of oil
in
place;
No is number
of
stock tank
barrels of oil
produced;
and B",
is the ratio of the
oil volume at
initial reservoir
conditions
to oil
volume at standard
conditions.
If total
liquid saturation
in the
reservoir
is expressed as
(23)
s,:s*+(r-s*)(\})
(*)
(24)
rl9t
then the
relative
permeability
curve
may be
obtained by
plotting
kr/k" from Equation 22 as
a function
of S,-
from Equation
24. Figure 7
illustrates a convenient
format for tabulating
the data.
The curve
is
prepared
by
plotting
column 9
as a flnction
of column 6 on semilog
paper,
with
k/k"
on the
logarithmic
scale.
The
technique
is useful even
if only a
few high-
liquid-saturation
data
points
can be
plotted.
These
kr/k" values can be used to
verify the
accuracy of
relative
permeability
predicted
by empirical
or laboratory
techniques.
Poor
agreement between
relative
permeability determined
from
production
data and
from
laboratory
experiments
is not uncommon.
The causes
of these
discrepancies
may include
the following:
t2
Relative Permeability
of Petroleum Reservoirs
l.
The core
on which relative
permeability
is measured
may not be representative
of the
reservoir in regard
to such factors as fluid distributions,
secondary
porosity,
etc.
2. The
technique
customarily
used to compute relative
permeability
from
field data
does
not
allow for
the
pressure
and saturation
gradients
which
are
present
in
the reservoir,
nor does
it allow for
the fact that wells may
be
producing
from
several strata which
are at various
stages of depletion.
3. The
usual
technique for calculating relative
permeability
from field
data assumes
that
Ro
at any
pressure
is constant
throughout the oil
zone.
This assumption
can lead to
computational
errors if
gravitational
effects
within
the reservoir
are significant.
When relative
permeability
to water is computed from
field data, a common
source of
elror is
the
production
of water from
some source other than the hydrocarbon
reservoir.
These
possible
sources
of extraneous water include
casing leaks, fractures
that extend from
the hydrocarbon
zone into
an aquifer,
etc.
REFERENCES
l.
Gorinik, B. and Roebuck,
J.
F.,
Formation Evaluation
through
Extensive
Use of
Core Analysis,
Core
Laboratories,
Inc.,
Dallas, Tex.,
1979.
2.
Saraf, D. N.
and McCaffery,
F.
G.,
Two-
and
Three-Phase
Relative
Permeabilities:
a
Review,
Petroleum
Recovery
Institute Report
#81-8,
Calgary, Alberta,
Canada, 1982.
3. Mungan,
N., Petroleum
Consultants
Ltd.,
personal
communication, 1982.
4. Morse,
R. A.,
Terwilliger,
P. L.,
and Yuster, S. T., Relative
permeability
measurements
on small
samples,
Oil Gas
J.,
46,
109, 1947.
5. Osoba,
J.
S., Richardson,
J.
G., Kerver,
J.
K., Hafford,
J.
A.,
and
Blair,
P. M., Laboratory
relative
permeability
measurements,
Trans.
AIME, 192, 47, 1951.
6.
Henderson,
J.
H.
and Yuster, S.T.,
Relative
permeability
study,World
Oil,3,139, 1948.
7. Caudle,
B. H.,
Slobod, R. L.,
and Brownscombe, E.
R. W., Further
developments in
the laboratory
determination
of relative
permeability,
Trans. AIME,
192, 145,
1951.
8.
Geffen, T.
M., Owens,
W. W., Parrish,
D. R., and Morse, R.
A., Experimental
investigation of factors
affecting laboratory
relative
permeability
Teasurements,
Trans. AIME,
192,
99,
1951.
9. Richardson,
J.
G., Kerver,
J.
K.,
Hafford,
J.
A.,
and Osoba,
J.
S.,
Laboratory
determination
of relative
permeability,
Trans.
AIME, 195,
187, 1952.
10.
Josendal,
V. A.,
Sandiford, B.
B., and Wilson,
J.
W., Improved multiphase
flow
studies employing
radioactive
tracers,
Trans. AIME,
195, 65, 1952.
I l. Loomis,
A.
G. and
Crowell,
D.
C., Relative Permeability
Studies:
Gas-Oil and Water-Oil
Systems,
U.S.
Bureau
of Mines Bulletin
BarHeuillr,
Okla., 1962,599.
12.
Leas, W.
J., Jenks,
L.
H., and Russell,
Charles D., Relative permeability
to
gas,
Trans. AIME,
189,
65, r9s0.
13.
Rapoport, L.
A. and Leas,
W.
J.,
Relative
permeability
to liquid
in liquid-gas
systems, Trans.
AIME,
192,
93, l95l.
14.
Corey, A. T.,
Rathjens,
C. H., Henderson,
J.
H., and Wyllie,
M. R.
J.,
Three-phase relative perme-
ability,
J.
Pet.
Technol., Nov.,
63, 1956.
15.
Hassler,
G. L., U.S. Patent
2,345,935,
1944.
16.
Gates,
J.
I. and Leitz,
W. T., Relative permeabilities
of
California cores
by the capillary-pressure
method,
Drilling
and Production
Practices,
American Petroleum
Institute, Washington,
D.C. 1950,
285.
17.
Brownscombe,
E. R.,
Slobod, R. L.,
and Caudle, B. H., Laboratory
determination
of relative
perrne-
ability, Oil
Gas J.,48,98,
1950.
18.
Rose,
W., Some
problems
in
applying the Hassler relative permeability
method,
J.
Pet.
Technol.,
8, I l6l,
1980.
19. Buckley,
S.
E.
and Leverett,
M.
C.,
Mechanism
of fluid displacement
in sands,
Trans. AIME,
146,107,
1942.
20.
Welge'H.J.rAsimplifiedmethodforcomputingrecoverybygasorwaterdrive,Trans.A|ME,
195,91,
1952.
21. Leverett,
M.
C., Capillary
behavior in
porous
solids,
Trans. AIME,
142, 152, 1941.
tl
l_1
lo
ll
:.i
Ir
Johr
plar'cn
Crid
Clrfi
SFr t.
Jcrl
.lr.plr
Slo5.i
rc.hfu,
UrS
SPL
T)
O'llG
acotn:
Frerr,
h
tlF*:
Frt-
|
Bra
-l_
lv
lr
-\
nl.rl:r
c
()i
thg
brt\
.
ila
bli
;.'l.r Jtres
dlc'
:l.cn .tir.
I
.i:-:l-:
lr
[1gI
tE ::tC.
thal
D
:i' .c.rJ
to
lll
-: l
I|r.
.
-:.c tli
Fn
:-'-<'I\t)lf.
I
c\:r J
lrr)m
rl
lE-
F.
lr-
X'r
|
:',
F
I.
Er
ls
It
!
lt-
JI
F'-'.
";:h,rJ.
[:.'
It
:
j'rTnC-
13
22.
Johnson,
E. F., Bossler,
D. P.,
and Naumann,
V.
O., Calculation of relative permeability
from
dis-
placement
experiments,
Trans. AIME,
216,310, 1959.
23.
Crichlow, H. B.,
Ed., Modern Reservoir
Engineering
-
A
Simulation Approaclr,
Prentice-Hall,
Englewood
Cliffs,
1977,
chap. 7.
24.
Special Core Analysis,
Core Laboratories,
Inc., Dallas,
1976.
25.
Jones,
S.
C. and Roszelle, W.
O., Graphical
techniques for
determining
relative permeability
from
displacement experiments,
J.
Pet.
Technol.,
5, 807, 1978.
26.
Slobod, R. L.,
Chambers, A.,
and Prehn, W. L.,
Use of
centrifuge for
determining
connate water,
residual
oil, and capillary
pressure
curves of small core
samples,
Trans. AIME,
192,
127, 1952.
27
. Yan Spronsen,
E., Three-phase
relative
permeability
measurements
using the
Centrifuge
Method,
Paper
SPE/DOE
10688
presented
at the Third
Joint Symposium,
Tulsa,
Okla., 1982.
28.
O'Mera, D.
J., Jr.
and Lease, W.
O.,
Multiphase
relative
permeability
measurements
using an automated
centrifuge,
Paper
SPE
12128 presented
at the SPE 58th
Annual Technical
Conference
and Exhibition,
San
Francisco.1983.
29. Purcell,
W. R.,
Capillary
pressures
-
their measurement
using mercury
and the
calculation
of
permeability
therefrom,
Trans. AIME,
186, 39. 1949.
30. Fatt, I.
and Dyksta, H.,,Relative permeability
studies, Trans.
AIME,
192,41,
1951.
31. Burdine, N. T.,
Relative Permeability
Calculations from
Pore
Size Distribution
Data,
Trans. AIME,
lg8,
7t,1953.
rf-
tv:
.
.lf.
l.
:^
l()7.
Nt!
:
-i.91.
l5
Chapter
2
TWO-PHASE
RELATIVE
PERMEABILITY
I. INTRODUCTION
Direct
experimental
measurement
to determine
relative
permeability of
porous rock has
long
been
recorded
in
petroleum related
literature.
However,
empirical
methods for deter-
mining
relative
permeability
are
becoming
more
widely used,
particularly with the
advent
of digital
reservoir
simulators.
The
general
shape
of the
relative
permeability curves
may
be approximated
by the
following
equations:
k.*
:
A(S*)';
k ,
:
B(l
-
S*)"';
where
A,
B. n. and
m are
constants.
Most
relative
permeability
mathematical
models
may
be classified
under
one
of
four
categories:
Capillary
models
-
Are
based
on the
assumption
that a
porous medium
consists
of
a
bundle
of capillary
tubes
of
various
diameters
with a
fluid
path length
longer than
the
sample.
Capillary
models
ignore
the
interconnected
nature of
porous media and
frequently
do
not
provide realistic
results.
Statistical
models
-
Are also
based
on the
modeling
of
porous media by a
bundle
of
capillary
tubes
with various
diameters
distributed
randomly.
The
models may
be described
as
being
divided
into a
large
number
of
thin
slices
by
planes
perpendicular to the
axes
of
the tubes.
The slices
are
imagined
to
be
rearranged
and
reassembled
randomly.
Again,
statistical
models
have the
same
deficiency
of
not being able
to
model the
interconnected
nature
of
porous media.
Empirical
models
-
Are
based
on
proposed empirical
relationships
describing
experi-
mentally
determined
relative
permeabilities
and
in
general, have
provi{ed
the
most
successful
approximations.
Netwoik
models
-
Are
frequently
based
on the
modeling
of fluid
flow in
porous media
using a
network
of electric
resistors
as
an analog
computer.
Network
models
are
probably
the best
tools
for understanding
fluid
flow
in
porous media'r'aa
The hydrodynamic
laws
generally bear
little use
in the
solution
of
problems concerning
single-phase
fluid
flow
through
porous
media,
let alone
multiphase
fluid
flow,
due to
the
complexity
of the
porous system.
One
of the
early
attempts
to
relate
several
laboratory-
measured
parameters to
rock
permeability
was the
Kozeny-Carmen
equation.2
This equation
expresses
the
permeability
of a
porous material
as a
function
of the
product of the
effective
path length
of the
flowing
fluid and
the
mean
hydraulic
radius
of the
channels
through
which
the fluid
flows.
Purcell3
formulated
an
equation
for the
permeability
of a
porous system
in terms
of
the
porosity and
capillary
pressure desaturation
curve
of that
system
by
simply
considering
the
porous medium
as
a bundle
of
capillary
tubes
of
varying sizes.
Several
authorsa-r6
adapted
the
relations
developed
by Kozeny-Carmen
and Purcell
to
the
computation
of
relative
permeability.
They
all
proposed models
on
the basis
of the
assumption
that
a
porous medium
consists
of a bundle
of capillaries
in order to
apply
Darcy's
and
Poiseuille's
equations
in their
derivations.
They used
the
tortuosity
concept
or texture
pa-
rameters
to
take
into account
the
tortuous
path
of
the flow
channels
as
opposed
to the
concept
of capillary
tubes.
They tried
to
determine
tortuosity
empirically
in order
to
obtain
a close
approximation
of
experimental
data.
II. RAPOPORT
AND LEAS
Rapoport
and
Lease
presented two
equations
for
relative
permeability
to
the
wetting
phase.
16 Relative
Permeabilin
of Petroleum Reservoirs
These
equations
were
based on surface energy relationships
and the Kozeny-Carmen
equa-
tion.
The
equations
were presented
as defining
limits for wetting-phase
relative
permeability.
The
maximum
and
minimum
wetting-phase relative
permeability
presented
by Rapoport
and Leas are
k.*,(max)
:
(l)
P. dS
fs*
Jr*,
t'ot
,['*'
(tj) (T#)'
and
.['*'
P.
dS
k,*,(min)
:
(ti
-
j;
)'
fs- fS*,
I
P.ds+
|
R.as
Jr'Jr
(2)
where
S- represents
the minimum
irreducible
saturation of
the wetting
phase
from
a drainage
capillary
pressure
curve, expressed
as a fraction; S*, represents
the saturation
of the wetting
phase
for which
the
wetting-phase
relative
permeability
is
evaluated,
expressed
as a
fraction;
P. represents
the drainage
capillary
pressure
expressed in
psi
and
S
represents
the
porosity
expressed
as a fraction.
III.
GATES. LIETZ. AND
FULCHER
Gates and Lietzs
developed
the following
expression based
on Purcell's
model for wetting-
phase
relative permeability:
t. _
K.*r
-
Fulcher
et al.,as have
investigated
the influence
of
capillary number
(ratio
of viscous
to
capillary
forces)
on two-phase
oil-water relative permeability
curves.
IV. FATT,
DYKSTRA,
AND BURDINE
Fatt
and Dykstrarr
developed
an expression
for relative permeability
following
the
basic
method
of Purcell for
calculating
the
permeability
of a
porous
medium.
They
considered
a
lithology
factor
(a
correction
for
deviation
of the
path
length
from
the length
of
the
porous
medium)
to be a function
of
saturation.
They
assumed
that
the radius
of the path
of
the
conducting pores
was
related
to the lithology
factor,
tr,
by the
equation:
ru
I$
(3)
u
hcre
r
iun
-tr.r
Tlr c
t\
Fan
E^t,rat.l
Ttrr
rt
rflfl
Thc
1
ilrrrrd
&nJ
Dillrd
!,!
hr
Drfi
crlr cr
Ffm
(4)
a
\:-
ro
L7
,aI-'
-:l
cLlua-
PC:-'
r.rlltr.
hi
i 'j'prp1
[l
.,
,l
:r:nJlC
J:
.i.'1tlnS
F'-':':l(rn-
i
li-
r
:'.
:,
r\ll\
ir5
::.r
hasic
srr: :ercd a
J
i:;
Frrttus
i
f;i:.
,'l
the
Table I
CALCULATION OF
WETTING.PHASE RELATIVE
PERMEABILITY BASED
ON
THE FATT AND
DYKSTRA EQUATION
Area from 0
S*,
Vo
P", cm Hg l/P"'],
(cm
Hg)-t to
S*,
in.2
k.*,, Vo
,lr
100 4.0 0.0156
90 4.5 0.0110
80 5.0 0.0080
'70
5.5 0.0060
60 6.0 0.0046
s0 6.7 0.0033
40 7.s 0.0024
30 8.7 0.00 15
20 13.0 0.0005
'
7.88/11.25
x
100
:
70.0.
"
5.54111.25
x
l0O
:
49.2.
n.25
7.88
5.54
3.80
2.49
t.50
0.75
0.30
0.20
100.0
70.0,
49.2b
33.8
22.1
13.3
6.1
2.7
0.4
_l
where r represents
the radius of a
pore,
a and b represent material constants,
and }, is a
function of saturation.
The equation for the wetting-phase relative
permeability,
k.*,, reported
by
Fatt
and Dykstra
is
ft*'
ds
t-
,
Jn
P2(l
+
b)
K.*,
:
l.r
dS
Jo
P2(
|
*
b)
agreement with
observed
data when b
:
(5)
r/r,
reducing
Fatt and Dykstra found
good
Equation
5 to
They stated that their
equation
fit
their own data as well
as the data of
Gates and
Lietz
more
accurately than other
proposed
models.
The
procedure
for
the calculation of relative
permeability
from
capillary
pressure
data is
illustrated
by Table I and
the
results
are shown in Figures
I
and 2.
Burdine'3
reported
equations for computing relative
perrneability
for
both the wetting
and
nonwetting
phases.
His equations can be shown
to
reduce
to a form similar
to those developed
by
Purcell. Burdine's
contribution is
principally
useful in handling
tortuosity.
Defining the
tortuosity
factor
for a
pore
as L when the
porous
medium is saturated
with
only one
fluid
and using the symbol tr*, for
the
wetting-phase
tortuosity
factor when
two
phases
are
present,
a tortuosity ratio can be defined
as
ft*'
ds
Jo
P:
TF
(6)
r-rl
T
tr.*,
:
;
(7)
r-l)
l8
Relative
Permeabilitv
of Petroleum
Reservoirs
9
I
|7
Pol
(cm
Hg)
6
5
4
3
2
I
oo'
lo 20
40 50
60
70
80
Sw+
FIGURE
1. Capillary
pressure
as a
function
of
water saturation.
/'*'
{^,*,)'ds/(\)'(P.)'
kr*,
/'0r,1^;'1r.y'
fS*'
t
ds/(P.)r
k.*t
:
(tr.*.)'
rl
t
ds/(p")l
In a similar
fashion,
the
relative
permeability to
the
nonwetting
phase
can
utilizing
a
nonwetting-phase
tortuosity
ratio,
tr,,*,,
then
Burdine
has
shown
that
(9)
be expressed
(
l0)
where S
The rela
phase
to
where S
The
e
the
expr
Wylli
computi
(8)
If tr
is
a
constant
for the
porous
medium
and
tr,*t depends only
on
the
final saturation,
then
fl
I
dst1e.)'
^
JS*t
k.n*,:
(trrn*,)'
J"
ds/(P.)2
S*,-
S-
Arwt
-
(l
t)
1-S-
l9
r60
r50
r40
r30
t20
ll
roo
90
70
60
50
40
30
20
to
o5
lo 20
30
40 50
60
70
Sw
-+
il,;yul}:
Reciprocal
of
(capillary
pressure)r as
a function
of
water
where
S- represents
the
minimum
wetting-phase
saturation
from
a capillary-pressure
curve.
The relative
perrneability
is assumed
to approach
zero
at this
saturation.
The
nonwetting
phase tortuosity
can be
approximated
by
\-^ ,.:
.
Sn*t
S'
(12)
rnwt
l-s*-s"
where
S.
is the
equilibrium
saturation
to the
nonwetting
phase.
The
expression
for the
wetting
phase
(Equation
9)
fit the
data
presented much
better
than
the expression
for
the
nonwetting
phase
(Equation
10).
V. WYLLIE,
SPRANGLER,
AND
GARDNER
Wyllie
and
Spran
glertz reported
equations
similar
to
those
presented by
Burdine
for
computing
oil
and
gas
relative
permeability.
Their
equations
can
be expressed
as
follows:
It
I
Pc3
|
(Cm
Hqi3
fa::
thcn
r9)
f3
.
r
lli'rred
rl0)
rll)
fs"
k,,,:
(iil'
J
os"rp;
/'
or",rl
(
l3)