introduction to matlab - sikander m. mirza
Bạn đang xem bản rút gọn của tài liệu. Xem và tải ngay bản đầy đủ của tài liệu tại đây (532.37 KB, 45 trang )
.
.
.
.
.
.
.
.
.
.
Beginner’s Resource
Introduction to Matlab
®
By
Dr. Sikander M. Mirza
Department of Physics and Applied Mathematics
Pakistan Institute of Engineering and Applied Sciences
Nilore, Islamabad 45650, Pakistan
.
.
.
.
.
.
Introduction to Matlab
2
T
T
a
a
b
b
l
l
e
e
o
o
f
f
C
C
o
o
n
n
t
t
e
e
n
n
t
t
s
s
GENERAL FEATURES 4
STARTUP 4
SIMPLE CALCULATIONS 5
NUMBERS AND STORAGE 6
VARIABLE NAMES 6
CASE SENSITIVITY 7
FUNCTIONS 7
TRIGONOMETRIC FUNCTIONS 7
SOME ELEMENTARY FUNCTIONS 7
VECTORS 9
THE ROW VECTORS 9
THE COLON NOTATION 9
SECTIONS OF A VECTOR 10
COLUMN VECTORS 11
TRANSPOSE 11
DIARY AND SESSION 12
ELEMENTARY PLOTS AND GRAPHS 13
MULTIPLOTS 15
SUBPLOTS 16
AXES CONTROL 17
SCRIPTS 17
WORKING WITH VECTORS AND MATRICES 20
HADAMARD PRODUCT 22
TABULATION OF FUNCTIONS 22
WORKING WITH MATRICES 24
DEFINING MATRICES 24
SIZE OF MATRICES 25
THE IDENTITY MATRIX 26
TRANSPOSE 26
DIAGONAL MATRIX 27
SPY FUNCTION 27
SECTIONS OF MATRICES 28
PRODUCT OF MATRICES 29
MATLAB PROGRAMMING 29
FOR-LOOPS 29
LOGICAL EXPRESSIONS 31
WHILE LOOP 32
CONDITIONAL PROGRAMMING 33
FUNCTION M-SCRIPTS 34
RETURN STATEMENT 36
RECURSIVE PROGRAMMING 36
Introduction to Matlab
3
FUNCTION VISUALIZATION 37
SEMILOG PLOT 37
POLAR PLOT 38
MESH PLOT 39
ELAPSED TIME 42
.
.
.
.
.
.
Introduction to Matlab
4
G
G
e
e
n
n
e
e
r
r
a
a
l
l
F
F
e
e
a
a
t
t
u
u
r
r
e
e
s
s
Matlab is an interactive working environment in which the user can carry out
quite complex computational tasks with few commands. It was originally
developed in 1970s by Cleve Muller. The initial programming was in Fortran
and over period of time, it has constantly evolved. The latest version is in C.
As far as numerical programming is concerned, it removes programming of
many routine tasks and allows one to concentrate on the task encouraging
experimentation. The results of calculations can be view both numerically as
well as in the form of 2D as well as 3D graphs easily and quickly. It
incorporates state-of-the-art numerical solution tools, so one can be confident
about the results. Also, quite complex computations can be performed with
just a few commands. This is because of the fact that the details of
programming are stored in separate script files called the ‘m’- files and they
can be invoked directly with their names. An m-file can invoke another m-file
when required. In this way, a series of m-files running behind the scene allow
execution of the required task easily. The user can write his/her own m-files.
All such scripts are text readable files which can be read, modified and printed
easily. This open-architecture of Matlab® allows programmers to write their
own area specific set of m-files. Some such sets written by various experts
world-wide have already been incorporated into the Matlab as tool boxes. So,
with standard installations, you will find latterly dozens of tool boxes. If you
wish, you can down-load even more from the internet.
Startup
When you click the Matlab icon, the MS Windows opens up the standard
Matlab-window for you which has the following form:
Introduction to Matlab
5
The white area in the middle is the work area in which the user types-in the
commands which are interpreted directly over there and the results are
displayed on screen. The ‘>>’ is Matlab prompt indicating that user can type-
in command here. A previously entered command can be reached with the
help of up-arrow and down-arrow buttons on the keyboard.
Simple Calculations
Matlab uses standard arithmetic operators + - / * ^ to indicate addition,
subtraction, division, multiplication and raised-to-the-power respectively. For
example, in order to calculate the answer for 2+3
4
, one would type the
following:
» 2+3^4
ans =
83
The first line is the user entered command while the second line is default
variable used by Matlab for storing the output of the calculations and the third
line shows the result of computation. If you wish to multiply this result with 2,
proceed as below:
» ans*2
ans =
166
As you can see, the result 83 stored in variable ans gets multiplied with 2, and
the result of this new computation is again stored in variable ‘ans.’ In this
case, its previous value gets over-written by the new variable value. If you
wish, you can define your own variables. For example:
» pay=2400
pay =
2400
In this case, you define the variable ‘pay’ and assign the variable a value
2400. Matlab echoes the assignment in the second and third line. This
confirms the user that a value of 2400 has been assigned to the variable ‘pay’
which is quite useful at times. If you wish to remove this echo in Matlab, use a
semicolon at the end of each command. For example:
» c=3*10^8;
»
The variable ‘c’ has been assigned a value 3x10
8
and since there is a
semicolon at the end of the command, therefore, no echo is seen in this case.
The arithmetic operators have the following precedence-levels:
1. Brackets first. In case they are nested, then the sequence is from inner-
most to the outermost.
.
.
.
.
.
.
Introduction to Matlab
6
2. Raised to power next.
3. Multiplication and division next. If there are such competing
operators, then the sequence is from left to right.
4. Addition and subtraction next. In this case also, if there are competing
such operators, then the sequence is from left to right
Numbers and Storage
Matlab performs all calculations in double precision and can work with the
following data types:
Numbers Details
Integer
Numbers without any fractional part and decimal point.
For example, 786
Real Numbers with fractional part e.g., 3.14159
Complex
Numbers having real and imaginary parts e.g., 3+4i.
Matlab treats ‘i’ as well as ‘j’ to represent
1−
Inf Infinity e.g., the result of divided with zero.
NaN Not a number e.g., 0/0
For display of the results, Matlab uses Format command to control the output:
Category Details
format short 4 decimal places (3.1415)
format short e 4 decimal places with exponent (3.1415e+00)
format long e normal with exponent (3.1415926535897e+00)
format bank 2 decimal places (3.14)
By using ‘format’ without any suffix means that from now onwards, the
default format should be used. Also, ‘format compact’ suppresses any blank
lines in the output.
Variable Names
Matlab allows users to define variable with names containing letters and digits
provided that they start with a letter. Hyphen, % sign and other such
characters are not allowed in variable names. Also, reserved names should not
be used as variable names. For example, pi, i, j, and e are reserved. Similarly,
the names of functions and Matlab commands should also be avoided.
Introduction to Matlab
7
Case Sensitivity
Matlab command structure is quite similar to the C-language. The variables
are case sensitive. So, ALPHA and alpha are treated as separate variables. The
case sensitivity is also applicable to Matlab commands. As a general rule, the
lower-case variable names as well as commands are typically used.
F
F
u
u
n
n
c
c
t
t
i
i
o
o
n
n
s
s
Matlab has a potpourri of functions. Some of these are standard functions
including trigonometric functions etc., and others are user-defined functions
and third party functions. All of these enable user to carry out complex
computational tasks easily.
Trigonometric Functions
These include sin, cos and tan functions. Their arguments should be in
radians. In case data is in degrees, one should convert it to radians by
multiplying it with pi/180. For example, let us calculate the value of
(
)
(
)
oo
27cos27sin
22
+ :
» (sin(27*pi/180))^2+(cos(27*pi/180))^2
ans =
1
The result of these computations is no surprise. Note that in each case, the
argument of the trigonometric function was converted to radians by
multiplying it suitably.
The inverse functions are invoked by asin, acos and atan. For example,
()
1tan
1−
is computed as:
» atan(1)
ans =
0.7854
Of course,
7854.04/ =
π
.
Some Elementary Functions
Typically used common functions include sqrt, exp, log and log10. Note that
log function gives the natural logarithm. So,
» x=2; sqrt(x), exp(-x), log(x), log10(x)
ans =
1.4142
ans =
.
.
.
.
.
.
Introduction to Matlab
8
0.1353
ans =
0.6931
ans =
0.3010
Here, all four functions have been tested using the same command. As you
can see, the semicolon suppresses the echo while the comma separates various
computations. Summary of some functions is given below:
Function Stands for
abs Absolute value
sqrt Square root function
sign Signum function
conj Conjugate of a complex number
imag Imaginary part of a complex number
real Real part of a complex number
angle Phase angle of a complex number
cos Cosine function
sin Sine function
tan Tangent function
exp Exponential function
log Natural logarithm
log10 Logarithm base 10
cosh Hyperbolic cosine function
sinh Hyperbolic sine function
tanh Hyperbolic tangent function
acos Inverse cosine
acosh Inverse hyperbolic cosine
asin Inverse sine
asinh Inverse hyperbolic sine
atan Inverse tan
atan2 Two argument form of inverse tan
atanh Inverse hyperbolic tan
round Round to nearest integer
floor Round towards minus infinity
fix Round towards zero
ceil Round towards plus infinity
rem Remainder after division
Introduction to Matlab
9
V
V
e
e
c
c
t
t
o
o
r
r
s
s
In Matlab, there are two types of vectors: the row vectors and the column
vectors.
The Row Vectors
The row vectors are entities enclosed in pair of square-brackets with numbers
separated either by spaces or by commas. For example, one may enter two
vectors U and V as:
» U=[1 2 3]; V=[4,5,6]; U+V
ans =
5 7 9
The two row vectors were first defined and then their sum U+V was
computed. The results are given as a row vector stored as ans. The usual
operations with vectors can easily be carried out:
» 3*U+5*V
ans =
23 31 39
The above example computed the linear combination of U and V. One can
combine vectors to form another vector:
» W=[U, 3*V]
W =
1 2 3 12 15 18
The vector U and V both of length 3, have been combined to form a six
component vector W. The components of a vector can be sorted with the help
of sort function:
» sort([8 4 12 3])
ans =
3 4 8 12
The vector [8 4 12 3] has been sorted.
The Colon Notation
In order to form a vector as a sequence of numbers, one may use the colon
notation. According to which, a:b:c yields a sequence of numbers starting with
‘a’, and possibly ending with ‘c’ in steps of ‘b’. For example 1:0.5:2 yields he
following column vector:
» 1:0.5:2
ans =
1.0000 1.5000 2.0000
.
.
.
.
.
.
Introduction to Matlab
10
Note that in some cases, the upper limit may not be attainable thing. For
example, in case of 1:0.3:2, the upper limit is not reached and the resulting
vector in this case is:
» 1:0.3:2
ans =
1.0000 1.3000 1.6000 1.9000
If only two of the ‘range’ specifications are given then a unit step size is
automatically assumed. For example 1:4 means:
» 1:4
ans =
1 2 3 4
In case, the range is not valid, an error message is issued:
» 1:-1:5
ans =
Empty matrix: 1-by-0
Here, the range of numbers given for the generation of row vector was from 1
to 5 in steps of -1. Clearly, one can not reach 5 from 1 using -1 step size.
Therefore, the Matlab indicates that this is an empty matrix.
Sections of a Vector
Let us define a vector using the range notation:
» W=[1:3, 7:9]
W =
1 2 3 7 8 9
Now, we would like to extract the middle two elements of this vector. This
can be done with the range notation again. As you can see, the middle two
elements are 3:4 range. Therefore, the required part of vector can be obtained
as:
» W(3:4)
ans =
7
This really is the required part. There are many interesting things that can now
be done using the range notation. For example, range 6:-1:1 is the descending
range and when used with part-extraction of vector, it gives:
» W(6:-1:1)
ans =
9 8 7 3 2 1
which is the vector W with all entries now in reverse order. So, a vector can
be flipped easily. The ‘size’ function yields the length of a vector. For a given
vector V, V(size(V):-1:1) will flip it. Note that flipping of sections of a vector
is also possible.
Introduction to Matlab
11
Column Vectors
The column vectors in Matlab are formed by using a set of numbers in a pair
of square brackets and separating them with semi-colon. Therefore, one can
define two column vectors A and B and add them as below:
» A=[1;2;3]; B=[4;5;6]; A+B
ans =
5
7
9
The two column vectors were defined first and then their sum was obtained. In
similar way, all other standard operations with the column vectors can be
carried out.
Transpose
Of course, the convenient way of creating a row vector does not have any
similar method for the column vector. But, one can do it by first creating a
row vector using the range notation and then transposing the resulting row
vector into a column vector. The transpose is obtained with a ` as shown
below:
» A=[1:4]; B=A'
B =
1
2
3
4
Here, first a row vector [1 2 3 4] is formed which is called A. This vector is
then transposed to form the B—a column vector.
Note: If C is a complex vector, then C’ will give its complex conjugate
transpose vector.
» C=[1+i, 1-i]; D=C'
D =
1.0000 - 1.0000i
1.0000 + 1.0000i
The vector C was a complex vector and its complex conjugate is [1-i 1+i]
vector. Vector D is clearly its complex conjugate transpose vector. Some
times, one does not want the complex conjugate part. In order to get a simple
transpose, use .’ to get the transpose. For example:
» C=[1+i, 1-i]; E=C.'
.
.
.
.
.
.
Introduction to Matlab
12
E =
1.0000 + 1.0000i
1.0000 - 1.0000i
In this case, a plain transpose of C is stored in E and no complex conjugate
part appears.
Diary and Session
In Matlab, one can start storing all text that appears on screen into a separate
file by using ‘diary filename’ command. The filename should be any legal file
name different from ‘on’ and ‘off’. The record of diary can be turned ‘on’ and
‘off’ by using ‘diary on’ and ‘diary off’ commands.
Also, if one wishes to abort a session now and start from the same state
next time, one can save and load session using ‘save filename’ and ‘load
filename’ commands. The save command will save all variables used in this
session into a file with name give in the ‘save filename’ command and the
corresponding load command will read them back during a later session.
By the way, a complete list of all variables use so far in the current session
can be seen using the ‘who’ command:
» who
Your variables are:
A D V c
B E W pay
C U ans x
The values and further details are also available with the ‘whos’ command:
» whos
Name Size Bytes Class
A 1x4 32 double array
B 4x1 32 double array
C 1x2 32 double array (complex)
D 2x1 32 double array (complex)
E 2x1 32 double array (complex)
U 1x3 24 double array
V 1x3 24 double array
W 1x6 48 double array
ans 2x1 32 double array (complex)
c 1x1 8 double array
pay 1x1 8 double array
x 1x1 8 double array
Grand total is 31 elements using 312 bytes
Introduction to Matlab
13
Elementary Plots and Graphs
Matlab offers powerful graphics and visualization tools. Let us start with
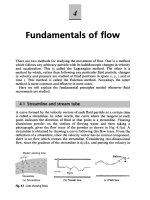
some of the very basic graphics capabilities of Matlab. The graph of sine
function in 0 to π can be obtained in the following way:
» N=30; h=pi/N; x=0:h:pi; y=sin(x); plot(x,y)
Here, in the first step, the total number of sampling points for the function is
defined as N and it is assigned a value 30. Next, the step size ‘h’ is defined
and the x row vector of size N+1 is defined along with the corresponding y
row vector composed of the function values. The command ‘plot(x,y)’
generates the graph of this data and displays it in a separate window labeled
Figure No. 1 as shown below:
The graph displayed in this window can be zoomed-in and zoomed-out. Both
x-any y-axes can also be rescaled with the help of mouse and using
appropriate buttons and menu items.
The graph title, x- and y-labels can be assigned using the following
commands:
>> title(‘Graph of sine function in 0 to pi range’)
>> xlabel(‘x’)
>> ylabel(‘sin(x)’)
Note that by using these commands as such, one gets the corresponding
response on the graph window immediately.
.
.
.
.
.
.
Introduction to Matlab
14
The grid lines on the graph can be switched on or off using the ‘grid’
command. By issuing this command once, grid will be turned on. Using it
again, the grid will be turned off.
Matlab allows users to change the color as well as the line style of graphs by
using a third argument in the plot command. For example, plot(x,y,’w-‘) will
plot x-y data using white (w) color and solid line style (-). Further such
options are given in the following table:
Color Symbol Color Line Symbol Line type
y Yellow
.
Point
m Magenta
O
Circle
c Cyan
X
x-mark
r Red
+
Plus mark
g Green
-
solid
b Blue
*
Star
w White
:
Dotted
b Black
Dash-dot
dashed
Introduction to Matlab
15
Multiplots
Let us now try plotting more than one curves on the same graph. The
functions are sine and cosine. The range is 0 to 2π in this case. The number of
sampled points in this case will be just 15.
» N=15; h=pi/N; x=0:h:2*pi; plot(x,sin(x),'r-
',x,cos(x),'g ')
» legend('sine','cosine');
» grid
» xlabel('x');
» ylabel('functions');
» title('Test of multi-plot option in Matlab');
The result is the following plot:
Note that the plot command with the same three options repeated twice
generates a graph with two curves. This can be extended to fit your needs.
Furthermore, the legend command allows one to generate the legend for this
graph which can be positioned freely by the user by just clicking and dragging
it over the graph, and releasing the mouse button when it is positioned as
desired.
.
.
.
.
.
.
Introduction to Matlab
16
Each plot command erases the previous graphics window (the Figure No.
1) and draws on it. If you wish, you can send plot on the same window by first
using the hold command and later sending plot to it with the plot command.
The hold command can be switched off by using ‘hold off’ when desired.
Subplots
Let us now consider a different situation. We want to plot both sine and cosine
functions again in the 0 to 2π range but on separate graphs. If we issue two
separate plot commands, the previous graph is erased. If we use hold, then
essentially, it is multiplot which you do not want. You want to plot these
functions on two graphs placed next to each other. This is done with the help
of subplot command, which splits the graphics window in to mxn array of
sub-plot sections. Here, we create 1x2 panels (one row, two columns):
» N=15;h=2*pi/N; x=0:h:2*pi;
» subplot(122);plot(x,cos(x));xlabel('x');
ylabel('cosine');grid
» subplot(121);plot(x,sin(x));xlabel('x');
ylabel('sine');grid
Introduction to Matlab
17
The first subplot command picks the first column of this panel and plots the
sine function in it. The second picks the second column and plots the cosine
function in it. In this way, the graph is constructed.
Axes Control
The axes of the graph can be controlled by the user with the help of axis
command which accepts a row vector composed of four components. The first
two of these are the minimum and the maximum limits of the x-axis and the
last two are same for the y-axis. Matlab also allows users to set these axes
with ‘equal’, ‘auto’, ‘square’ and ‘normal’ options. For example axis(‘auto’)
will scale the graph automatically for you. Similarly, axis([0 10 0 100]) will
scale the graph with x-axis in [0, 10] range and y-axis in [0, 100] range.
Scripts
Some times, it becomes necessary to give a set of Matlab commands again. In
such cases, it becomes tedious to type-in every thing. Matlab offers a
.
.
.
.
.
.
Introduction to Matlab
18
convenient way to handle this situation. The user can save the desired set of
commands in a Matlab script file. It can have any legal name and it must have
extension ‘m’ which stands for Matlab-script. It is standard ASCII text file.
Matlab has built-in m-file editor designed specifically for this purpose. This
can be accessed using File menu:
By clicking at the File—New—m file item, the m-file editor window pops up:
Introduction to Matlab
19
Here, one can type-in desired set of commands and save it. The default
directory for these files is already in the search path of Matlab. If you wish to
save the file into a directory of your own choice, please do not forget to
include it in the Matlab search path. This can be clicking on the file—select
path menu item which will open the path browser for you:
You can use the menu item path—add to path to add the directory of your
choice to the Matlab path:
.
.
.
.
.
.
Introduction to Matlab
20
By clicking on the button with … on it, the directory browser dialog can be
opened and by clicking on the desired directory, you can select the directory
to be added. After that, just press OK button to add the directory to the path.
After saving the script file in a directory in Matlab path, the commands
inside it can be invoked by just typing the name of the file (without the .m
extension).
Working with Vectors and Matrices
Vectors can be manipulated in various ways. A scalar can be added to vector
elements in Matlab using .+ notation:
» A=[1 2 ];
» B=2.+A
B =
3 4
Note the use of the ‘dot’ before the ‘+’ sign which means apply it on element
basis. In exactly same way, division, multiplication, subtraction and raised to
the power operations can be carried out. For example, let us raise each
element of a matrix to power 2 using the ‘dot’ notation:
>> B=[2 3 4; 5 4 6; 1 3 2]; B.^2
ans =
4 9 16
25 16 36
1 9 4
>> B^2
ans =
23 30 34
36 49 56
19 21 26
In the first case, each element of the matrix B has been raised to power 2. For
this purpose, the dot notation was used. In the second case, the same matrix
Introduction to Matlab
21
has been raised to power 2 which is essentially B*B operation. Now, let us
carryout the dot or inner product of a row U and a column vector V:
[]
==
3
2
1
;321 VU
>> U=[1 2 3]; V=[1;2;3]; U*V
ans =
14
Clearly, the result is 1+4+9 = 14; a scalar quantity. Now, let us change the
order of multiplication. In this case, the result is expected to be a matrix:
>> V*U
ans =
1 2 3
2 4 6
3 6 9
Now, let us compute the Euclidean norm of a vector which is defined as:
∑
=
=
3
1
2
i
i
uU
It can be obtained by the
'.UU ; where U’ is its complex conjugate
transpose. Also, Matlab has a built-in function called norm, which carries out
this operation for us:
>> sqrt(U*U'), norm(U)
ans =
3.7417
ans =
3.7417
The first computation returns the value of sqrt(U*U’) as 3.7417 and exactly
the same result is obtained using the norm function.
Now, let us compute angle between two vectors X and Y where:
[]
[
]
7315;957
=
= YX
In Matlab, we will compute the lengths of these vectors using the norm
function, and divide the inner product of X and Y with these lengths, the result
will be cosine of the angle and finally, using the acos function, we will get the
final answer. Mathematically:
=
−
YX
YX .
cos
1
θ
>> X=[7 5 9]; Y=[15 3 7];
>> theta = acos(X*Y'/(norm(X)*norm(Y)))
theta =
0.5079
.
.
.
.
.
.
Introduction to Matlab
22
Here, first both vectors have been initialized. Next, we apply the formula. The
important thing to note in this case was the fact that since both vectors were
defined as row vectors, we had to convert the ‘Y’ vector into a column vector
by using transpose in order to compute the inner product.
Hadamard product
Although not in common use, the Hadamard is defined in mathematics as
element by element product of two vectors of identical lengths and the result
is again a vector of same length. For example if:
[]
[
]
nn
vvvVuuuU LL
2121
;
=
=
then the Hadamard dot product is defined as:
[]
nn
vuvuvuVU L
2211
. =
In Matlab, the Hadamard dot product is obtained using .* operator. For
example, if U=[1 3 4 7] and V=[8 3 9 2], then their Hadamard dot product is
given by:
>> U=[1 3 4 7]; V=[8 3 9 2]; U.*V
ans =
8 9 36 14
Tabulation of Functions
The functions used in Matlab apply on element by element basis. In order to
test it, let us prepare a table of the values of sine, and cosine for values of
angles ranging from 0 to pi in steps of pi/10. For this, first, we construct a
column vector of values of angles and call it X:
>> X=[0:pi/10:pi]'
X =
0
0.3142
0.6283
0.9425
1.2566
1.5708
1.8850
2.1991
2.5133
2.8274
3.1416
Introduction to Matlab
23
Now, we use the two trigonometric functions with x as argument:
>> [X sin(X) cos(X)]
ans =
0 0 1.0000
0.3142 0.3090 0.9511
0.6283 0.5878 0.8090
0.9425 0.8090 0.5878
1.2566 0.9511 0.3090
1.5708 1.0000 0.0000
1.8850 0.9511 -0.3090
2.1991 0.8090 -0.5878
2.5133 0.5878 -0.8090
2.8274 0.3090 -0.9511
3.1416 0.0000 -1.0000
which shows clearly that the functions actually apply on each element of the
column vector. The first column in the above output is X, second is sin(X) and
third is cos(X).
In order to test it for another case, let us try finding the limiting value of
sin(y)/y for y approaching zero. The answer should be 1.0 and in Matlab, we
first define a range of values of y:
>> y=[10 1 0.1 0.01 0.001];
then we apply the expression. Note that the sine function will apply on
element by element basis but the division must be forced to be carried out also
on element by element basis which can easily be done using the dot in front of
the division operator:
>> sin(y)./y
ans =
-0.0544 0.8415 0.9983 1.0000 1.0000
and it is seen clearly that the limiting value is indeed 1.0 as y becomes smaller
and smaller. In order to view things graphically, we first define a range of
values of x from near 0 to 7π in steps of π/10. Then, it is plotted with grid-on
state:
>> x=[0.0001:0.1:7*pi];plot(x,sin(x)./x);
xlabel(‘x’); ylabel(‘sin(x)/x’); grid on
which is seen as:
.
.
.
.
.
.
Introduction to Matlab
24
The function clearly approaches 1.0 as ‘x’ becomes smaller and smaller. In the
range of values o ‘x’, zero was avoided otherwise Matlab gives a divided by
zero error message.
W
W
o
o
r
r
k
k
i
i
n
n
g
g
w
w
i
i
t
t
h
h
M
M
a
a
t
t
r
r
i
i
c
c
e
e
s
s
Defining Matrices
A matrix is essentially a two dimensional array of numbers composed of rows
and columns. A matrix can be entered in Matlab in either of the following
three ways:
(a) Using carriage return key:
>> A=[1 2 3
4 5 6
7 8 9];
(b) Using semicolons to indicate the next line:
>> A=[1 2 3; 4 5 6; 7 8 9];
Introduction to Matlab
25
(c) Using the range notation with semicolon:
>> A=[1:3; 4:6; 7:9];
Some matrices can be defined simply using functions. For example, the zeros
function defines a matrix with all entries zeros, the function ones defines
matrix filled with ones and rand defines a matrix with all entries random
numbers in the [0,1] range:
>> zeros(3)
ans =
0 0 0
0 0 0
0 0 0
>> ones(3)
ans =
1 1 1
1 1 1
1 1 1
>> rand(3)
ans =
0.9501 0.4860 0.4565
0.2311 0.8913 0.0185
0.6068 0.7621 0.8214
The argument in each case is the size of the matrix. The same functions can
also be used for defining some non-square matrix:
>> rand(3,4)
ans =
0.4447 0.9218 0.4057 0.4103
0.6154 0.7382 0.9355 0.8936
0.7919 0.1763 0.9169 0.0579
In this case, one needs to supply two arguments, first for the number of rows
and second for the number of columns.
Size of Matrices
The size function returns the size of any matrix. For example, let us define a
zero matrix A with size 135x243:
>> A=zeros(135,243); size(A)
ans =
135 243