Looking at the label and beyond: the effects of calorie labels, health consciousness, and demographics on caloric intake in restaurants
Bạn đang xem bản rút gọn của tài liệu. Xem và tải ngay bản đầy đủ của tài liệu tại đây (458.63 KB, 9 trang )
RES E AR C H Open Access
Looking at the label and beyond: the effects of
calorie labels, health consciousness, and
demographics on caloric intake in restaurants
Brenna Ellison
1*
, Jayson L Lusk
2
and David Davis
3
Abstract
Background: Recent legislation has required calorie labels on restaurant menus as a means of improving
Americans’ health. Despite the growing research in this area, no consensus has been reached on the effectiveness
of menu labels. This suggests the possibility of heterogeneity in responses to caloric labels across people with
different attitudes and demographics. The purpose of this study was to explore the potential relationships between
caloric intake and diners’ socio-economic characteristics and attitudes in a restaurant field experiment that
systematically varied the caloric information printed on the menus.
Methods: We conducted a field experiment in a full service restaurant where patrons were randomly assigned to
one of three menu treatments which varied the amount of caloric information printed on the menus (none,
numeric, or symbolic calorie label). At the conclusion of their meals, diners were asked to complete a brief survey
regarding their socio-economic characteristics, attitudes, and meal selections. Using regression analysis, we
estimated the number of entrée and extra calories ordered by diners as a function of demographic and attitudinal
variables. Additionally, irrespective of the menu treatment to which a subject was assigned, our study identified
which types of people are likely to be low-, medium-, and high-calorie diners.
Results: Results showed that calorie labels have the greatest impact on those who are least health conscious.
Additionally, using a symbolic calorie label can further reduce the caloric intake of even the most health conscious
patrons. Finally, calorie labels were more likely to influence the selection of the main entrée as opposed to
supplemental items such as drinks and desserts.
Conclusions: If numeric calorie labels are implemented (as currently proposed), they are most likely to influence
consumers who are less health co nscious – probably one of the key targets of this legislation. Unfortunately,
numeric labels did little for those consumers who were already more knowledgeable about health and nutrition. To
reach a broader group of diners, a symbolic calorie label may be preferred as it reduced caloric intake across all
levels of health consciousness.
Keywords: Numeric vs. symbolic calorie labeling, Health consciousness, Full service restaurant
Background
In 1980, about 32% of food expenditures occurred
outside the home. By 2010, the figure had increased to
nearly 44% [1]. This increase has incited policymakers at
the local, state, and national levels to push for legislation
to encourage more healthful food choices away from
home, with the most prominent piece being housed in
the 2010 healthcare bill. This legislation mandates chain
restaurants to provide calorie information on all menu
forms [2]. While the intent of this type of labeling policy
is quite clear, its effects are not. In a growing body of
literature, a consensus on labels’ (in)effectiveness has yet
to be reached – some studies found calorie labeling
influenced food choice while others said it had no sig-
nificant effect (see Harnack and French [3] and Swartz,
Braxton, and Viera [4] for a comprehensive review).
* Correspondence:
1
University of Illinois at Urbana-Champaign, 321 Mumford Hall, 1301 W.
Gregory Dr., Urbana, IL 61801, USA
Full list of author information is available at the end of the article
© 2013 Ellison et al.; licensee BioMed Central Ltd. This is an Open Access article distributed under the terms of the Creative
Commons Attribution License ( which permits unrestricted use, distribution, and
reproduction in any medium, provided the original work is properly cited.
Ellison et al. International Journal of Behavioral Nutrition and Physical Activity 2013, 10:21
/>The lack of consensus on the impacts of menu labeling
suggests there may be mor e to the story. That previous
studies have employed similar experimental designs yet
reached different conclusions suggests the discrepancy
may relate to differences in the types of people involved
in the studies. People self-select into different types of
restaurants, and it is possible menu labels are more
influential for some groups of people than others. Con-
sider health consciousness, for example. Highly health
conscious individuals likely possess a large amount of
health/nutrition awareness and knowledge; thus, the
label will probably have minimal influence on their food
choices because such individuals already know which
foods are lower calorie. Low health conscious people, on
the other hand, may find the label provides novel infor-
mation which can be used to select a lower-calorie menu
item. However, individuals (even health conscious
dietitians) often struggle to estimate (typically underesti-
mate) the number of calories in restaurant meals [5-7].
Thus, when diners are confronted with accurate calorie
information, their attitudes toward specific menu items
may change, especially for items not closely aligned with
expectations. Burton et al. [7] argue “surprising” menu
items (i.e., a high-calorie salad) will experience the most
dramatic shifts in attitudes and purchase intentions.
Differences in conclu sions across studies might partially
be explained by the fact that “surprises” may differ
across people and restaurants
The impact of menu labels may also vary with
demographic factors, such as gender, income, age, and
education. Glanz et al. [8] found that nutrition is more
important to women and older individuals; thus, these
groups may be more responsive to menu labels as
opposed to young males. Surprisingly, the menu labeling
literature has large ly neglected the impact s of demo-
graphics and attitudinal characteristics. There have been
several studies on the types of people who eat at fast
food restaurants (see Rydell et al. [9] for a re view), but
little work has examined what people eat once inside the
restaurant, a gap the present study aims to fill.
In this paper, we also investigate the effect of the for-
mat in which calories are displayed on menu labels. The
vast majority of labeling studies have provided the num-
ber of calories for each menu item. From the literature,
it is clear this type of label ha s limited effectiveness,
which leads us to ask: is there a better way to convey
caloric information? Thorndike et al. [10] found using a
traffic light symbol adjusted purchasing behavior amon g
hospital cafeteria patrons; however, there wa s no com-
parison with other labeling formats. Alternatively,
Ellison, Lusk, and Davis [11] compared the effectiveness
of symbolic (also in the form of a traffic light) versus nu-
meric menu labeling and found that symbolic labeling
led to lower caloric intake, on average, than numeric
labeling. An open question this study aims to answer is
whether symbolic information might be more influential
on consumers with limited nutrition knowledge.
The overall purpose of this study is to gain a better
understanding of restaurant patrons’ choices in the face
of differing nutrition labels. More specifically, we will
determine which types of people are most responsive to
nutrition labeling on restaurant menus by exami ning
the relationship between caloric intake and (1) menu
labeling format, (2) health consciousness , and (3)
demographic factors.
Methods
Data and experimental design
Survey data were collected for two weeks during the
2010 Fall semester at a restaurant on the Oklahoma
State University campus.
1
The restaurant was split into
three sections, with each assigned to a unique menu
treatment. Upon arrival, diners were randomly assigned
to a table in one of the three sections. All treatments
listed the name, description, and price for each
menu item, but the caloric information differed across
treatments. Diners in the control menu treatment
received no nutritional information, patrons in the
calorie-only menu treatment were provided the number
of calories in parentheses before each item’s price, and
individuals in the calorie+traffic light menu treatment
were presented with a green, yellow, or red traffic light
symbol (indicating specific calorie ranges) in addition to
the numeric caloric information preceding each item’s
price. Green light options contained 400 calories or less,
yellow light options had between 401 a nd 800 calories, and
red light options consisted of more than 800 cal ories.
Diners could choose from 51 menu options. Major
menu categories included soups and salads, burgers and
sandwiches, pasta, vegetarian items, and prime and
choice steaks. Additionally, diners had the option of a
daily special, usually a ‘surf-and-turf’ combination. Upon
completion of their meal, patrons were asked to
complete a survey. Prior to this point, diners were un-
aware their dining choices had been recorded as part of
the research study. Using the restaurant’s record-keeping
system, we matched up diners’ actual choices with their
survey responses. In total, there were 138 observations
(see Table 1 for summary statistics).
The one-page survey contained 15 questions and asked
about diners’: (1) demographic characteristics, (2) levels of
health consciousness, (3) frequency of and reasons for
dining at the restaurant, (4) method of item selection (i.e.,
was selection based on taste, price, healthfulness, etc.),
and (5) menu label preference. On the back of the sur vey,
participants were presented a menu and asked which item
(s) and beverage they ordered and if they ordered dessert
(see Additional file 1).
Ellison et al. International Journal of Behavioral Nutrition and Physical Activity 2013, 10:21 Page 2 of 9
/>A key variable in this analysis was health consciousness.
Following Kraft and Goodell [12] and Berning, Chouinard,
and McCluskey [13], we measured this construct by
asking participants to answer three five-point Likert scale
questions regarding their daily caloric intake, fat intake,
and use of nutrition labels. Summing the values across the
three questions provided a person’s level of health con-
sciousness; scores could range from three to fifteen, with
fifteen representing the most health conscious consumer.
Model and data analysis
The first part of our analysis utilized ordinary least
squares (OLS) regressions to determine factors affecting
diners’ caloric intake. We disaggregated total caloric in-
take into (1) main entrée calories consumed, and (2)
extra calories derived from additional items consumed
over the course of the meal (drinks, desserts, side items
like soup or salad served before the main course, etc.).
Some extra items (namely, daily dessert specials and
drinks) were not listed on the menu, and in concordance
with the new federal labeling law, were thus not required
to possess a menu labe l.
2
The model for calorie intake
type m (m = entrée calories, extra calories) by individual
i is specified as follows:
CI
m
i
¼ β
m
0
þ β
m
1
TLS
i
þ β
m
2
CAL
i
þ β
m
3
HC
i
þ β
m
4
Female
i
þ β
m
5
Student
i
þ β
m
6
Bachelors
i
þ β
m
7
Party
i
þ γ
m
1
TLS
i
ÃHC
i
þ γ
m
2
CAL
i
ÃHC
i
þ ε
i
ð1Þ
where β
0
is the intercept, β
1
, , β
7
are the effects of the
calorie+traffic light (TLS
i
) and calorie-only (CAL
i
) menu
labeling formats, health consciousness (HC
i
), gender
(Female
i
), status as a current student (Student
i
), college
education (Bachelors
i
), and party size (Party
i
) on caloric
intake, γ
1
and γ
2
are interaction effects between each
menu labeling format and health consciousness on calo-
ric intake, and ε
i
~ N(0, σ
ε
2
) is a random error term.
Despite mixed results from previous studies, we
hypothesized lower caloric intake among those indi viduals
who received menus providing nutritional information ( the
calorie+traffic light and calorie-only menus) compared to
those individuals who received no nutritional information
(i.e., β
1
<0andβ
2
< 0). Research has shown consumers
tend to underestimate the caloric contents of meals
[5-7,14], so the label corrects the misperception and may
lead to lower-calorie choices. Additionally, we expected
these negative relationships to hold more strongly in the
Table 1 Characteristics of survey respondents and definition of variables (N=138)
Variable Definition Mean
Female 1 if female; 0 if male 55.8%
Student 1 if current Oklahoma State University student;0 otherwise; 63.0%
Bachelor’s 1 if obtained bachelor’s degree; 0 otherwise 34.1%
Age1 1 if age is 18 to 34.99 years; 0 otherwise 69.6%
Age2 1 if age is 35 to 54.99 years; 0 otherwise 18.1%
Age3 1 if older than 55 years of age; 0 otherwise 12.3%
Income1 1 if annual household income is less than $25,000;0 otherwise 44.2%
Income2 1 if annual household income is between $25,000 and$99,999; 0 otherwise 39.9%
Income3 1 if annual household income is $100,000 or greater;0 otherwise 15.9%
Health Consciousness (HC) Level of health consciousness (can range from 3 to 15) 10.319
Value Taste 1 if taste is most important characteristic in meal selection;0 otherwise 72.5%
Value Health 1 if healthfulness is most important characteristic in mealselection; 0 otherwise 10.1%
Party Number of guests seated per table 2.928
Calorie+traffic light 1 if diner received calorie+traffic light menu; 0 otherwise 39.1%
Calorie-only 1 if diner received calorie-only menu; 0 otherwise 39.1%
Control 1 if diner received control menu with no nutritionalinformation; 0 otherwise 21.7%
Repeat Visitor 1 if diner is repeat visitor to the restaurant; 0 otherwise 61.6%
Lunch with Friends 1 if occasion for eating is lunch with friends; 0 otherwise 63.8%
Business Lunch 1 if occasion for eating is business or work-related;0 otherwise 18.8%
Entrée Calories Main entrée calories ordered per diner 606.341
Extra Calories Extra calories beyond main entrée (i.e., additional sideitems, desserts, drinks) ordered per diner 152.174
Total Calories Total calories ordered per diner 758.515
Ellison et al. International Journal of Behavioral Nutrition and Physical Activity 2013, 10:21 Page 3 of 9
/>entrée calorie specification as opposed to the extra calorie
specification since some extra calorie items ( drinks and
desserts) were not included on the menu.
Secondly, we hyp othesized a negative relationship be-
tween health consciousness and caloric intake. The more
health conscious a person is (i.e., the more a person
monitors his/her calorie and/or fat intake or spends time
reading nutrition labels), the greater amount of nutrition
knowledge/awareness the individual has, and thus, the
fewer calories that individual is exp ected to order. How-
ever, we expected high levels of health consciousness
will moderate the effect of menu labeling format such
that highly health conscious individuals will derive
little new information from calorie labels. Thus, we
hypothesized that menu labeling format will lead to the
greatest calorie reductions for individuals who were less
health conscious.
In the second portion of our analysis, we focused on
answering the “who orders what” question. Here, we
determined which types of people (male vs. female, older
vs. younger, etc.) were low-, medium-, and high-calorie
diners. For this, we again considered both entrée and
extra calories ordered; however, instead of examining
them as continuous varia bles, we segregated people
into low, medium, and high categories. For the
entrée calories, we used the intuitive cutoff points
corresponding to our traffic light specifications. Thus,
low-calorie diners ordered 4 00 entrée calories or less,
medium-calorie diners ordered between 401 and 800
entrée calories , a nd high-calorie diners ordered more
than 800 entrée calories.
Defining the low, medium, and high levels of extra
calories wa s more challenging. We opted to classify
low-calorie diners a s those people who ordered zero
extra calories. These diners strictly adhered to their
main entrée choice and did not supplement their
meal. Medium-calorie diners were those who ordered
between one and 250 extra calories (most likely
diners who ordered one extra item), and high-calorie
diners ordered more than 250 extra calories (most
likely selected two o r more extra items).
Once the low-, medium-, and high-ca lorie categories
were established for entrée and extra calories, we
calculated the mean values for a host of variables under
each category, incl uding gender, age, income, and educa-
tion. The average levels of health consciousness were
also compared across the categories of diners as well as
the proportion of people who responded that taste or
health was the mos t important characteristic when
making a menu selection. A dummy variable for the
menu labeling treatment was also included to determine
whether one format led to more low (or even high)
calorie diners than another. Finally, we included
variables relating to whether individuals were repeat
diners and their reason for visiting the restaurant. Chi-
squared and ANOVA tests were used to determine
whether significant differences existed between low-,
medium-, and high-calorie diners.
Results
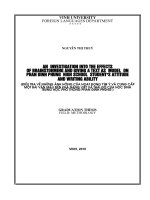
We first compared the average number of entrée, extra,
and total calories ordered across the three menu
formats. Figure 1 reveals that, in terms of entrée calories,
the calorie-only and calorie+traffic light labeling
treatments resulted in lower caloric intake relative to the
control menu with no information. The calorie+traffic
light menu label led to significantly fewer entrée calories
ordered (p = 0.033) compared to the other two labeling
formats (114 and 129 entrée calories fewer, on average,
than the calorie-only and control menus, respectively).
However, there were no significant differences in extra
calories ordered across treatments.
Combining the entré e and extra calorie measures gave
us the average total calories ordered. Ultimately, neither
label significantly changed total calories ordered relative
to the control menu;
3
however, the calorie+traffic light
label outperformed the calorie-only label as these diners
ordered 121 calories fewer than those receiving the
calorie-only menu (p = 0.063).
Regression analysis
First consider the regression results for entrée calories.
Table 2 shows both the calorie+traffic light and calorie-
only labels significantly reduced entrée calories ordered
(by 496.34 and 610.69 calories, respectively), thus β
1
<0
and β
2
< 0 as hypothesized. Based on Figure 1, one
might have expected the calorie+traffic light label to
have the greater reduction in entrée calories; however,
the interactions between each menu treatment and
health consciousness must also be considered when
interpreting the mean effect of a menu treatment. Table 2
reveals both interactions between menu treatment and
health consciousness were significantly positive, indica-
ting the effects of the labels were less pronounced for
more health conscious individuals. Comparing the two
labels, we found that at low levels of health conscious -
ness, the calorie-only label led to larger calorie
reductions; however, as health consciousness increased,
the calorie+traffic light was more effective at reducing
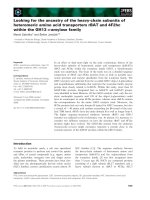
entrée calories, all else held constant. Figure 2 illustrates
this effect by plotting the predicted caloric intake as a
function of HC score for the three menu treatments ,
while holding all other variables constant at the
overall means.
Table 2 also reveals that entrée calories were negatively
related to health consciousness (p = 0.0002). Under the
control menu, every one unit increase in health con-
sciousness resulted in a 52.48 entrée calorie decrease, on
Ellison et al. International Journal of Behavioral Nutrition and Physical Activity 2013, 10:21 Page 4 of 9
/>average. However, under the calorie+traffic light and
calorie-only labe l treatments, the effects of health con-
sciousness were less pronounced. The marginal effect of
health consciousness in the calorie+traffic light treatment
was −52.48 + 38.16 = −14.32, so the negative relationship
continued to hold but at a lower absolute magnitude.
Alternatively, in the calorie-only treatment, the mar-
ginal effect was −52.48 + 55.79 = 3.31 – effectively
zero. These results suggest the calorie-only label does
not really tell the most health conscious individuals
any new information; therefore, entrée calories were
not f urther reduced. Figure 2 provides further evi-
denceofthisasthecalorie-only line was relatively flat
across all levels of health consciousness. The calorie
+traffic light label, however, appeared to provide some
new informa tio n as entrée calories were further reduced
in this menu condition even among more health con-
scious individuals.
In terms of demographics , women ordered signifi-
cantly fewer (p = 0.026) entrée calories than men. This
aligned with the finding by Glanz et al. [8] that nu tri-
tion was m ore import ant to women t han men; thus , it
is pro bable women will sele ct more nutritious (lower
calorie) entrées than men. A second explanation may
be that women generally require fewer calories to
maintain their body weight relative t o men. Other
demographic variables had no significant impact on
entrée calories ordered.
Turning to the extra calories regression estimates,
Table 2 reveals the effects of the calorie+traffic light
and calorie-only labels disappeared – neith er was sig-
nificantly different from zero. Education, howe ver,
marginally affe cted (p = 0.086) extra calories ordered,
as people who held a bachelor’s deg ree ordered 91.91
extra calories fewer, on average, than those without a
degree. Additionally, party size was negatively related
(p = 0.003) to extra calories ordered.
Characteristics of low-, medium-, and high-calorie diners
Table 3 offers insight into the characteristics of low-,
medium- and high-calorie diners in terms of entrée
calories ordered. Table 3 shows that a significantly
higher percentage (p=0.001) of females (75%) ordered
low-calorie entrées compared to the percentages who
ordered medium- or high-calorie entrées (56.5% and
33.3%, respectively). Additionally, current university
students made up larger proportions of medium- and
high-calorie diners (p = 0.100) whereas people who hold
a bachelor’s degree made up a greater proportion of
low-calorie diners (p = 0.099). Age also varied across
Figure 1 Average number of entrée, extra, and total calories across three menu treatments.
Ellison et al. International Journal of Behavioral Nutrition and Physical Activity 2013, 10:21 Page 5 of 9
/>categories as younger patrons (ages 18–34) were more
likely to order medium- or high-calorie entrées;
conversely, o lder patrons (ages 55 and older) were
more likely to order low-calorie entrées.
Individuals who considered health to be the most
important characteristic when making a menu selection
were more likely to be low-calorie diners (p=0.001) as
opposed to medium- or high-calorie diners. Health con-
sciousness revealed a similar result. Low-calorie diners
had a mean health consciousness score of 11.2, while the
mean health consciousness scores for medium- and
high-calorie diners declined to 10.29 and 9.389, respect-
ively (p = 0.046).
A final set of variables related to the reasons for eating
at the restaurant. During our survey period, the top two
reasons for visiting the restaurant were to have lunch
with friends or some type of business/work-related meal.
From the table, we see that people eating lunch with
friends made up larger proportions of medium- and
high-calorie diners. People visiting for business reasons
were just the opposite, accounting for 30% of low-calorie
diners but only 16.1% and 11.1% of medium- and high-
calorie diners, respectively.
Turning to Table 4, we also categorized people as low-,
medium-, or high-calorie diners based on the number
of extra calories ordered. Here, the effect of gender
disappeared; however, there were still differences in terms
of education variables. Current university students made
up greater proportions of medium- and high-calorie
diners. Additionally, 47% of low-calorie diners held a
bachelor’s degree compared to 13.3% and 28.6% of
medium- and high-calorie diners (p = 0.004). In terms of
age, 90% of medium-calorie diners were 18–34 years
old (p = 0.015). Table 4 also reveals low inc ome diners
(those with < $25,000 in annual household income)
made up the greatest percentages of medium- and
high-calorie diners (60% and 45.2%, respectively). Alter-
natively, higher income patrons (those with ≥ $100,000
in annual house hold income) were more likely to be
low-calorie diners (p = 0.024).
Variables related to health had a much smaller role in
classifying extra calorie diners. Health consciousness was
only marginally significant (p = 0.090). Similar to the
entrée calorie results, low-calorie diners had the highest
health consciousness scores, on average, yet the differ-
ence in health consciousness scores across the three
diner groups was much smaller.
Finally, in terms of dining purpose, we again found
that patrons visiting the restaurant for business or work-
related purposes were more likely to be low-calorie
diners as opposed to medium- or high-calorie diners
(p = 0.038).
Discussion
The federal government passed a menu labeling law in
the 2010 health care bill requiring chain restaurants to
post caloric information for all menus. Increased atten-
tion to labeling laws has caused a surge in research
related to the potential (and actual) effe ctiveness of ca-
lorie labels in restaurants. As these studies become more
prevalent, one would expect the results to eventually
converge on the impact of these labels; however, this has
not been the case. Some studies found calorie labels
significantly reduced intake while others concluded the
labels had no effect. These inconclusive results led us to
ask: are there factors beyond the label’s presence which
influence caloric intake?
Results of this study revealed menu labels have a
greater effe ct on entrée calories than on extra calories.
Both the calorie+traffic light and calorie-only labels sig-
nificantly reduced entrée calories ordered but neither
significantly reduced extra calories ordered. Though not
statistically significant (p = 0.294), diners who received
menus with nutritional information actually ordered
Table 2 regression estimates for entrée calories ordered
and extra calories ordered
DV: Entrée calories DV: Extra calories
Variable Estimate Estimate
Intercept 1185.75*** 456.19***
(189.04)
a
(144.99)
Calorie+traffic light −496.34** 101.34
(210.66) (145.80)
Calorie-only −610.69*** −77.02
(193.01) (140.47)
Health Consciousness (HC) −52.48*** −15.57
(14.93) (9.71)
Female −99.01** 5.12
(40.25) (32.23)
Student 4.82 −49.99
(65.90) (50.92)
Bachelor’s −19.59 −91.91*
(75.00) (49.90)
Party 25.06 −39.91***
(17.55) (10.12)
Calorie+traffic light*HC 38.16** −7.67
(18.06) (11.99)
Calorie-only*HC 55.79*** 13.67
(17.19) (12.22)
R-Squared 0.24 0.18
Number of Observations 138 138
Note: ***, **, and * represent statistical significance at the 1%, 5%, and 10%
levels, respectively.
a
Standard errors are in parentheses (heteroskedasticity consistent
standard errors).
Ellison et al. International Journal of Behavioral Nutrition and Physical Activity 2013, 10:21 Page 6 of 9
/>more extra calories than those who received no nutri-
tional information. This suggests diners who received
calorie information may be experiencing a licensing
effect such that ordering a lower-calorie entrée gave a
diner license to order an extra side item or dessert
[15,16]; however, we leave this issue to future research.
Another possible explanation for the label’s lack of influ-
ence on extra calories ordered could be that some of the
extra items like drinks and desserts were not presented
on the menu, so diners were not exposed to their caloric
contents.
4
We also found a negative relationship between health
consciousness and entrée calories ordered; however, the
interactions between each calorie label and health con-
sciousness were significantly positive. This means both
labels were more effective among the least health
conscious – precisely the people that menu labeling laws
are often trying to influence. Moreover, our results
suggest the calorie+traffic light menu was more effective
than the calorie-only menu at reducing entrée calories
ordered as health consciousness increased.
Interestingly, despite the calorie+traffic light label’s ef-
fectivene ss at reducing calories ordered, it was not the
labeling format of choice. When asked which labeling
format was preferred, only 27.5% of respondents wanted
to see the calorie+traffic light label on their menus. Sur-
prisingly, 42% preferred the calorie-only label which had
virtually no influence on ordering behavior. These
responses imply diners may want more information on
their menus (the number of calories) but do not want
to be told what they should or should not consume
(i.e., green = good, red = bad).
A key strength of this study was the experimental de-
sign. We compared two labeling treatments to a control
group with no calorie labels in a real restaurant setting.
Additionally, all treatments were examined simultan-
eously, meaning any differences in dining habits from
day to day would be picked up across all treatment
groups. Secondly, this paper examined restaurant patrons
more closely by administering a survey in addition to
collecting purchase data.
One issue in the present study was the small sample
size. While more observations are preferable, the authors
have conducted a larger study comparing the same three
menu labeling treatments (with purchase data only), and
the effects were virtually the same [11]. In both studies,
the calorie+t raffic light label reduced total calories
ordered by 69 calories, though the reduction was signifi-
cant only with the larger sample. The calorie-only label,
conversely, did not affect total calories ordered regard-
less of sample size.
A second limitation was that not all items (particularly
drinks and desserts) were listed on the menus, so diners
were not provided their caloric contents. Unfortunately,
this may be a limitation consumers face even when the
legislation is enacted. As currently proposed by the Food
and Drug Administration, restaurants will not be
required to post caloric contents for daily spe cial items
Figure 2 Relationship between health consciousness and entrée calories ordered in three menu treatments.
Ellison et al. International Journal of Behavioral Nutrition and Physical Activity 2013, 10:21 Page 7 of 9
/>which are not regularly offered. In this study, the
desserts changed daily, making them exempt from cal-
orie labels (drinks would require labels, but res taurant
management was not open to adding them to the menu
in this study). Thus, while lack of calorie posting on
daily special items was a limitation, our design was con-
sistent with the proposed legislation and mirrored the
reality diners are likely to encounter.
Conclusions
Together our results suggest that calorie labels in
restaurants can be effective, but only among th ose
restaurant patrons who have lo wer l evels of h ealth
consciousness. For highly health conscious diners , cal-
orie labels provide little new information. However,
our findings suggest the addition of a symbol (here, a
traffic light symbol) to the calorie information could
further reduce calories ordered, even for the most
health conscious individuals.
Endnotes
a
All data were collected during the lunch meal (11:00
a.m. to 2:00 p.m.).
b
Under the proposed legislation, only the daily dessert
specials would be exempt from having a calorie label.
Drinks would be required to be labeled; however, this res-
taurant did not list drinks on its menus (a feature not open
to change at the time of this study), so consumers were
not presented with calorie information for drink options.
c
In the present stud y, we found that neither the
calorie-only nor the calorie+traffic light label signifi-
cantly affected total calories ordered. However, one
could argue the lack of significance may be due to the
small sample size (and thus, limited power) and that the
reduction caused by the calorie+traffic light label (69
calorie reduction, on average) could still be significant
from a public health standpoint. Fortunately, we have a
larger data set (N = 946) which confirms this (see
Ellison, Lusk, and Davis [11]). In the larger data set, we
utilized the same three menu treatments and
Table 4 Demographic characteristics of low-, medium-,
and high-calories diners (based on extra calories)
Variable
a
Low calorie
diners (0 extra
calories)
Medium calorie
diners (1–250
extra calories)
High-calorie
diners (> 250
extra calories)
Female 56.1% 56.7% 54.8%
Student* 54.5% 80.0% 64.3%
Bachelor’s*** 47.0% 13.3% 28.6%
Age1** 60.6% 90.0% 69.0%
Age2* 22.7% 3.3% 21.4%
Age3 16.7% 6.7% 9.5%
Income1* 36.4% 60.0% 45.2%
Income2 39.4% 36.7% 42.9%
Income3** 24.2% 3.3% 11.9%
Calorie+traffic
light
37.9% 33.3% 45.2%
Calorie-only* 34.8% 46.7% 40.5%
Control 27.3% 20.0% 14.3%
Value Taste 68.2% 76.7% 76.2%
Value Health 10.6% 3.3% 14.3%
Health
Consciousness*
10.939 9.700 9.786
Repeat Visitor 63.6% 46.7% 69.0%
Lunch with
Friends
56.1% 66.7% 73.8%
Business
Lunch**
27.3% 6.7% 14.3%
Number of
Observations
66 30 42
Note: ***, **, and * represent statistical significance at the 1%, 5%, and 10%
levels, respectively.
a
For variable definitions, refer to Table 1.
Table 3 Demographic characteristics of low-, medium-,
and high-calories diners (based on entrée calories)
Variable
a
Low calorie
diners (≤ 400
entrée calories)
Medium calorie
diners (401–800
entrée calories)
High-calorie
diners (> 800
entrée calories)
Female*** 75.0% 56.5% 33.3%
Student* 50.0% 71.0% 63.9%
Bachelor’s* 47.5% 27.4% 30.6%
Age1** 52.5% 79.0% 72.2%
Age2 22.5% 16.1% 16.7%
Age3*** 25.0% 4.8% 11.1%
Income1 37.5% 51.6% 38.9%
Income2 40.0% 38.7% 41.7%
Income3 22.5% 9.7% 19.4%
Calorie+traffic
light
47.5% 41.9% 25.0%
Calorie-only 32.5% 38.7% 47.2%
Control 20.0% 19.4% 27.8%
Value Taste 62.5% 74.2% 80.6%
Value Health*** 25.0% 4.8% 2.8%
Health
Consciousness**
11.200 10.290 9.389
Repeat Visitor 70.0% 58.1% 58.3%
Lunch with
Friends**
50.0% 74.2% 61.1%
Business Lunch* 30.0% 16.1% 11.1%
Number of
Observations
40 62 36
Note: ***, **, and * represent statistical significance at the 1%, 5%, and 10%
levels, respectively.
a
For variable definitions, refer to Table 1.
Ellison et al. International Journal of Behavioral Nutrition and Physical Activity 2013, 10:21 Page 8 of 9
/>experimental design; however, no diner demographic
and attitudinal profiles were available. Results from the
larger data set showed the calorie+traffic light label leads
to a nearly identical 68.7 calorie reduction (on average),
a result which is statistically different than the control
menu. It should be noted, though, that t he calorie-
only label did not sig nificantly impact calories ordered
in either data set.
d
While drinks and beverages were not listed on the
menu (and thus had no nutritional information present
for diners), it should be pointed out that less than 25% of
diners ordered either a dessert or a caloric beverage; thus,
the majority of extra items ordered were listed on the
menu with the corresponding nutritional information.
Additional file
Additional file 1: Survey Instrument.
Competing interests
Author disclosure: Brenna Ellison, Jayson L. Lusk, David Davis, no competing
interests.
Authors’ contributions
All of the authors were involved in designing the research. BE and JLL
conducted the research and DD oversaw management of the restaurant. BE
had primary responsibility for analyzing the data and writing the paper, with
all of the authors contributing by reviewing and editing drafts of the
manuscript. All authors read and approved the final manuscript.
Author details
1
University of Illinois at Urbana-Champaign, 321 Mumford Hall, 1301 W.
Gregory Dr., Urbana, IL 61801, USA.
2
Oklahoma State University, 411 Ag Hall,
Stillwater, OK 74078, USA.
3
Oklahoma State University, 210 Human Sciences
West, Stillwater OK74078, USA.
Received: 8 May 2012 Accepted: 6 February 2013
Published: 8 February 2013
References
1. Economic Research Service (ERS): Food CPI and Expenditures. United States
Department of Agriculture. 2011. />CPIFoodAndExpenditures/Data/Expenditures_tables/table8.htm.
2. Food and Drug Administration (FDA): FDA Proposes Draft Menu and Vending
Machine Labeling Requirements, Invites Public to Comment on Proposals.
United States Department of Health and Human Services. 2011. http://www.
fda.gov/NewsEvents/Newsroom/PressAnnouncements/ucm249471.htm.
3. Harnack LJ, French SA: Effect of Point-of-Purchase Calorie Labeling on
Restaurant and Cafeteria Food Choices: A Review of the Literature. Int J
Behav Nutr Phys Act 2008, 5:1–6.
4. Swartz JJ, Braxton D, Viera AJ: Calorie Menu Labeling on Quick-service
Restaurant Menus: An Updated Systematic Review of the Literature. Int J
Behav Nutr Phys Act 2011, 8:135.
5. Backstrand JR, Wootan MG, Young LR, Hurley J: Fat Chance: A Survey of
Dietitians’ Knowledge of the Calories and Fat in Restaurant Meals.
Washington, DC: Center for the Science in the Public Interest; 1997.
6. Burton S, Creyer EH: What Consumers Don’t Know Can Hurt Them:
Consumer Evaluations and Disease Risk Perceptions of Restaurant Menu
Items. J Consum Affairs 2004, 38:121–145.
7. Burton S, Creyer EH, Kees J, Huggins K: Attacking the Obesity Epidemic:
The Potential Health Benefits of Providing Nutrition Information in
Restaurants. Am J Pub Health 2006, 96:1669–1675.
8. Glanz K, Basil M, Maibach E, Goldberg J, Snyder D: Why Americans Eat
What They Do: Taste, Nutrition, Cost, Convenience, and Weight Control
Concerns as Influences on Food Consumption. J Am Diet Assoc 1998,
98:1118–1126.
9. Rydell SA, Harnack LJ, Oakes JM, Story M, Jeffrey RW, French SA: Why Eat at
Fast-Food Restaurants: Reported Reasons among Frequent Consumers.
J Am Diet Assoc 2008, 108:2066–2070.
10. Thorndike AN, Sonnenberg L, Riis J, Barraclough S, Levy DE: A 2-Phase
Labeling and Choice Architecture Intervention to Improve Healthy Food
and Beverage Choices. Am J Pub Health 2012, 102:527–533.
11. Ellison B, Lusk JL, Davis D: Effect of Menu Labeling on Caloric Intake and
Restaurant Revenue in Full-Service Restaurants. Seattle: Selected paper for
presentation at the AAEA Annual Meeting; 2012. 12–14 August 2012.
12. Kraft FB, Goodell PW: Identifying the Health Conscious Consumer. J Health
Care Mktg 1993, 13:18
–25.
13. Berning JP, Chouinard HH, McCluskey JS: Consumer Preferences for
Detailed versus Summary Formats of Nutritional Information on Grocery
Store Shelf Labels. J Ag Food Ind Org 2008, 6:1–19.
14. Chandon P, Wansink B: The Biasing Health Halos of Fast-Food Restaurant
Health Claims: Lower Calorie Estimates and Higher Side-Dish
Consumption Intentions. J Cons Research 2007, 34:301–314.
15. Wilcox K, Vallen B, Block L, Fitzsimons GJ: Vicarious Goal Fulfillment: When
the Mere Presence of a Healthy Option Leads to an Ironically Indulgent
Decision. J Cons Research 2009, 36:380–393.
16. Vermeer WM, Stee nhuis IHM, Leeu wis FH, Heyma ns MW, Seidel l JC:
Small Portion Sizes in Worksite Cafeterias: Do They Help
Consumers to Reduce Their Food Intake? Int J Obesity 20 11,
35:1200–1207.
doi:10.1186/1479-5868-10-21
Cite this article as: Ellison et al.: Looking at the label and beyond: the
effects of calorie labels, health consciousness, and demographics on
caloric intake in restaurants. International Journal of Behavioral Nutrition
and Physical Activity 2013 10:21.
Submit your next manuscript to BioMed Central
and take full advantage of:
• Convenient online submission
• Thorough peer review
• No space constraints or color figure charges
• Immediate publication on acceptance
• Inclusion in PubMed, CAS, Scopus and Google Scholar
• Research which is freely available for redistribution
Submit your manuscript at
www.biomedcentral.com/submit
Ellison et al. International Journal of Behavioral Nutrition and Physical Activity 2013, 10:21 Page 9 of 9
/>