primer on molecular genetics
Bạn đang xem bản rút gọn của tài liệu. Xem và tải ngay bản đầy đủ của tài liệu tại đây (676 KB, 44 trang )
1
Primer on Molecular Genetics
2
DOE Human Genome Program
Primer on Molecular Genetics
Date Published: June 1992
U.S. Department of Energy
Office of Energy Research
Office of Health and Environmental Research
Washington, DC 20585
The "Primer on Molecular Genetics" is taken from the June 1992 DOE
Human
Genome 1991-92 Program Report
. The primer is intended to be an introduction to
basic principles of molecular genetics pertaining to the genome project.
Human Genome Management Information System
Oak Ridge National Laboratory
1060 Commerce Park
Oak Ridge, TN 37830
Voice: 865/576-6669
Fax: 865/574-9888
E-mail:
3
Contents
Primer on
Molecular
Genetics
Revised and expanded
by Denise Casey
(HGMIS) from the
primer contributed by
Charles Cantor and
Sylvia Spengler
(Lawrence Berkeley
Laboratory) and
published in the
Human Genome 1989–
90 Program Report
.
Introduction 5
DNA 6
Genes 7
Chromosomes 8
Mapping and Sequencing the Human Genome 10
Mapping Strategies 11
Genetic Linkage Maps 11
Physical Maps 13
Low-Resolution Physical Mapping 14
Chromosomal map 14
cDNA map 14
High-Resolution Physical Mapping 14
Macrorestriction maps: Top-down mapping 16
Contig maps: Bottom-up mapping 17
Sequencing Technologies 18
Current Sequencing Technologies 23
Sequencing Technologies Under Development 24
Partial Sequencing to Facilitate Mapping, Gene Identification 24
End Games: Completing Maps and Sequences; Finding Specific Genes 25
Model Organism Research 27
Informatics: Data Collection and Interpretation 27
Collecting and Storing Data 27
Interpreting Data 28
Mapping Databases 29
Sequence Databases 29
Nucleic Acids (DNA and RNA) 29
Proteins 30
Impact of the Human Genome Project 30
Glossary 32
4
5
Introduction
T
he complete set of instructions for making an organism is called its genome. It
contains the master blueprint for all cellular structures and activities for the lifetime of
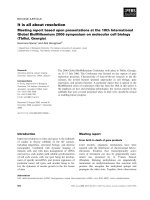
Fig. 1. The Human Genome at Four Levels of Detail. Apart from reproductive cells (gametes) and
mature red blood cells, every cell in the human body contains 23 pairs of chromosomes, each a
packet of compressed and entwined DNA (1, 2). Each strand of DNA consists of repeating
nucleotide units composed of a phosphate group, a sugar (deoxyribose), and a base (guanine,
cytosine, thymine, or adenine) (3). Ordinarily, DNA takes the form of a highly regular double-
stranded helix, the strands of which are linked by hydrogen bonds between guanine and cytosine
and between thymine and adenine. Each such linkage is a base pair (bp); some 3 billion bp
constitute the human genome. The specificity of these base-pair linkages underlies the mechanism
of DNA replication illustrated here. Each strand of the double helix serves as a template for the
synthesis of a new strand; the nucleotide sequence (i.e., linear order of bases) of each strand is
strictly determined. Each new double helix is a twin, an exact replica, of its parent. (Figure and
caption text provided by the LBL Human Genome Center.)
the cell or organism. Found in every nucleus of a person’s many trillions of cells, the
human genome consists of tightly coiled threads of deoxyribonucleic acid (DNA) and
associated protein molecules, organized into structures called chromosomes (Fig. 1).
6
Primer on
Molecular
Genetics
Deoxyribose
Sugar Molecule
Phosphate Molecule
Nitrogenous
Bases
A
T
C
G
G
C
T
A
Weak Bonds
Between
Bases
Sugar-Phosphate
Backbone
Fig. 2. DNA Structure.
The four nitrogenous
bases of DNA are
arranged along the sugar-
phosphate backbone in a
particular order (the DNA
sequence), encoding all
genetic instructions for an
organism. Adenine (A)
pairs with thymine (T),
while cytosine (C) pairs
with guanine (G). The two
DNA strands are held
together by weak bonds
between the bases.
A gene is a segment of
a DNA molecule (rang-
ing from fewer than
1 thousand bases to
several million), located
in a particular position on
a specific chromosome,
whose base sequence
contains the information
necessary for protein
synthesis.
If unwound and tied together, the strands of DNA would stretch more than 5 feet but
would be only 50 trillionths of an inch wide. For each organism, the components of these
slender threads encode all the information necessary for building and maintaining life,
from simple bacteria to remarkably complex human beings. Understanding how DNA
performs this function requires some knowledge of its structure and organization.
DNA
In humans, as in other higher organisms, a DNA molecule consists of two strands that
wrap around each other to resemble a twisted ladder whose sides, made of sugar and
phosphate molecules, are connected by “rungs” of nitrogen-containing chemicals called
bases. Each strand is a linear arrangement of repeating similar units called nucleotides,
which are each composed of one sugar, one phosphate, and a nitrogenous base (Fig.
2). Four different bases are present in DNA—adenine (A), thymine (T), cytosine (C), and
guanine (G). The particular order of the bases arranged along the sugar-phosphate
backbone is called the DNA sequence; the sequence specifies the exact genetic instruc-
tions required to create a particular organism with its own unique traits.
The two DNA strands are held together
by weak bonds between the bases on
each strand, forming base pairs (bp).
Genome size is usually stated as the total
number of base pairs; the human genome
contains roughly 3 billion bp (Fig. 3).
Each time a cell divides into two daughter
cells, its full genome is duplicated; for
humans and other complex organisms,
this duplication occurs in the nucleus.
During cell division the DNA molecule
unwinds and the weak bonds between
the base pairs break, allowing the strands
to separate. Each strand directs the
synthesis of a complementary new
strand, with free nucleotides matching up
with their complementary bases on each
of the separated strands. Strict base-
pairing rules are adhered to—adenine will
pair only with thymine (an A-T pair) and
cytosine with guanine (a C-G pair). Each
daughter cell receives one old and one
new DNA strand (Figs. 1 and 4). The
cell’s adherence to these base-pairing
rules ensures that the new strand is an
exact copy of the old one. This minimizes
the incidence of errors (mutations) that
may greatly affect the resulting organism
or its offspring.
7
Fig. 3. Comparison of Largest Known DNA Sequence with Approximate Chromosome and
Genome Sizes of Model Organisms and Humans. A major focus of the Human Genome Project
is the development of sequencing schemes that are faster and more economical.
Largest known continuous DNA sequence
(yeast chromosome 3)
Escherichia coli
(bacterium) genome
Largest yeast chromosome now mapped
Entire yeast genome
Smallest human chromosome (Y)
Largest human chromosome (1)
Entire human genome
350
4.6
5.8
15
50
250
3
BasesComparative Sequence Sizes
Thousand
Million
Million
Million
Million
Million
Billion
Genes
Each DNA molecule contains many genes—the basic physical and functional units of
heredity. A gene is a specific sequence of nucleotide bases, whose sequences carry the
information required for constructing proteins, which provide the structural components of
cells and tissues as well as enzymes for essential biochemical reactions. The human
genome is estimated to comprise at least 100,000 genes.
Human genes vary widely in length, often extending over thousands of bases, but only
about 10% of the genome is known to include the protein-coding sequences (exons) of
genes. Interspersed within many genes are intron sequences, which have no coding
function. The balance of the genome is thought to consist of other noncoding regions
(such as control sequences and intergenic regions), whose functions are obscure. All
living organisms are composed largely of proteins; humans can synthesize at least
100,000 different kinds. Proteins are large, complex molecules made up of long chains of
subunits called amino acids. Twenty different kinds of amino acids are usually found in
proteins. Within the gene, each specific sequence of three DNA bases (codons) directs
the cell’s protein-synthesizing machinery to add specific amino acids. For example, the
base sequence ATG codes for the amino acid methionine. Since 3 bases code for
1 amino acid, the protein coded by an average-sized gene (3000 bp) will contain 1000
amino acids. The genetic code is thus a series of codons that specify which amino acids
are required to make up specific proteins.
The protein-coding instructions from the genes are transmitted indirectly through messen-
ger ribonucleic acid (mRNA), a transient intermediary molecule similar to a single strand
of DNA. For the information within a gene to be expressed, a complementary RNA strand
is produced (a process called transcription) from the DNA template in the nucleus. This
8
Primer on
Molecular
Genetics
Fig. 4. DNA Replication.
During replication the DNA
molecule unwinds, with
each single strand
becoming a template for
synthesis of a new,
complementary strand.
Each daughter molecule,
consisting of one old and
one new DNA strand, is an
exact copy of the parent
molecule. [Source:
adapted from
Mapping Our
Genes—The Genome
Projects: How Big, How
Fast?
U.S. Congress,
Office of Technology
Assessment, OTA-BA-373
(Washington, D.C.: U.S.
Government Printing
Office, 1988).]
GC
C
A
A T
GC
A T
T A
C G
T A
GC
T A
C G
A T
C G
GC
T
T A
C G
A T
G
T
A
C
G
A
T
C
G
A
G
A T
A
A T
GC
A
T A
C G
T A
C G
GC
T A
C G
A T
G
C
G
T
C
GC
T A
C G
A T
GC
T A
C G
A T
GC
T A
C G
A T
ORNL-DWG 91M-17361
T
T
DNA Replication
Parent
Strands
Complementary
New Strand
Complementary
New Strand
mRNA is moved from the nucleus to the cellular cytoplasm, where it serves as the tem-
plate for protein synthesis. The cell’s protein-synthesizing machinery then translates the
codons into a string of amino acids that will constitute the protein molecule for which it
codes (Fig. 5). In the laboratory, the mRNA molecule can be isolated and used as a
template to synthesize a complementary DNA (cDNA) strand, which can then be used to
locate the corresponding genes on a chromosome map. The utility of this strategy is
described in the section on physical mapping.
Chromosomes
The 3 billion bp in the human genome are organized into 24 distinct, physically separate
microscopic units called chromosomes. All genes are arranged linearly along the chromo-
somes. The nucleus of most human cells contains 2 sets of chromosomes, 1 set given by
each parent. Each set has 23 single chromosomes—22 autosomes and an X or Y sex
chromosome. (A normal female will have a pair of X chromosomes; a male will have an X
9
and Y pair.) Chromosomes contain roughly equal parts of protein and DNA; chromosomal
DNA contains an average of 150 million bases. DNA molecules are among the largest
molecules now known.
Chromosomes can be seen under a light microscope and, when stained with certain dyes,
reveal a pattern of light and dark bands reflecting regional variations in the amounts of A
and T vs G and C. Differences in size and banding pattern allow the 24 chromosomes to
be distinguished from each other, an analysis called a karyotype. A few types of major
chromosomal abnormalities, including missing or extra copies of a chromosome or gross
breaks and rejoinings (translocations), can be detected by microscopic examination;
Down’s syndrome, in which an individual's cells contain a third copy of chromosome 21, is
diagnosed by karyotype analysis (Fig. 6). Most changes in DNA, however, are too subtle to
be detected by this technique and require molecular analysis. These subtle DNA abnor-
malities (mutations) are responsible for many inherited diseases such as cystic fibrosis and
sickle cell anemia or may predispose an individual to cancer, major psychiatric illnesses,
and other complex diseases.
Fig. 5. Gene Expression. When genes are expressed, the genetic information (base sequence) on DNA is first transcribed
(copied) to a molecule of messenger RNA in a process similar to DNA replication. The mRNA molecules then leave the cell
nucleus and enter the cytoplasm, where triplets of bases (codons) forming the genetic code specify the particular amino acids that
make up an individual protein. This process, called translation, is accomplished by ribosomes (cellular components composed of
proteins and another class of RNA) that read the genetic code from the mRNA, and transfer RNAs (tRNAs) that transport amino
acids to the ribosomes for attachment to the growing protein. (Source: see Fig. 4.)
NUCLEUS
DNA
Gene
mRNA
Copying
DNA in
Nucleus
tRNA Bringing
Amino Acid to
Ribosome
Free Amino Acids
Amino
Acids
Growing
Protein Chain
RIBOSOME incorporating
amino acids into the
growing protein chain
CYTOPLASM
ORNL-DWG 91M-17360
mRNA
mRNA
10
Primer on
Molecular
Genetics
Mapping and Sequencing the Human Genome
A primary goal of the Human Genome Project is to make a series of descriptive dia-
grams—maps—of each human chromosome at increasingly finer resolutions. Mapping
involves (1) dividing the chromosomes into smaller fragments that can be propagated and
char-acterized and (2) ordering (mapping) them to correspond to their respective locations
on the chromosomes. After mapping is completed, the next step is to determine the base
sequence of each of the ordered DNA fragments. The ultimate goal of genome research is
to find all the genes in the DNA sequence and to develop tools for using this information in
the study of human biology and medicine. Improving the instrumentation and techniques
required for mapping and sequencing—a major focus of the genome project—will in-
crease efficiency and cost-effectiveness. Goals include automating methods and optimiz-
ing techniques to extract the maximum useful information from maps and sequences.
A genome map describes the order of genes or other markers and the spacing between
them on each chromosome. Human genome maps are constructed on several different
scales or levels of resolution. At the coarsest resolution are genetic linkage maps, which
depict the relative chromosomal locations of DNA markers (genes and other identifiable
DNA sequences) by their patterns of inheritance. Physical maps describe the chemical
characteristics of the DNA molecule itself.
Fig. 6. Karyotype. Microscopic examination of chromosome size and banding patterns allows
medical laboratories to identify and arrange each of the 24 different chromosomes (22 pairs of
autosomes and one pair of sex chromosomes) into a karyotype, which then serves as a tool in the
diagnosis of genetic diseases. The extra copy of chromosome 21 in this karyotype identifies this
individual as having Down’s syndrome.
11
Geneticists have already charted the approximate positions of over 2300 genes, and a
start has been made in establishing high-resolution maps of the genome (Fig. 7). More-
precise maps are needed to organize systematic sequencing efforts and plan new
research directions.
Mapping Strategies
Genetic Linkage Maps
A genetic linkage map shows the relative locations of specific DNA markers along the
chromosome. Any inherited physical or molecular characteristic that differs among indi-
viduals and is easily detectable in the laboratory is a potential genetic marker. Markers
can be expressed DNA regions (genes) or DNA segments that have no known coding
function but whose inheritance pattern can be followed. DNA sequence differences are
especially useful markers because they are plentiful and easy to characterize precisely.
YEAR
66 68 70 72 74 76 78 80 82 84 86 88 90
0
500
1000
1500
2000
ORNL-DWG 91M-17362A
92
2500
NUMBER OF EXPRESSED GENES MAPPED
Fig. 7. Assignment of Genes
to Specific Chromosomes.
The number of genes assigned
(mapped) to specific chromo-
somes has greatly increased since
the first autosomal (i.e., not on the
X or Y chromosome) marker was
mapped in 1968. Most of these
genes have been mapped to
specific bands on chromosomes.
The acceleration of chromosome
assignments is due to (1) a com-
bination of improved and new
techniques in chromosome sorting
and band analysis, (2) data from
family studies, and (3) the intro-
duction of recombinant DNA
technology. [Source: adapted from
Victor A. McKusick, “Current
Trends in Mapping Human
Genes,”
The FASEB Journal
5(1),
12 (1991).]
12
Primer on
Molecular
Genetics
HUMAN GENOME PROJECT GOALS
Complete a detailed human genetic map
Complete a physical map
Acquire the genome as clones
Determine the complete sequence
Find all the genes
With the data generated by the project, investigators
will determine the functions of the genes and develop
tools for biological and medical applications.
2 Mb
0.1 Mb
5 kb
1 bp
ORNL-DWG 91M-17474
Resolution
HUMAN GENOME PROJECT GOALS
Markers must be polymorphic to be useful in mapping; that is, alternative forms must exist
among individuals so that they are detectable among different members in family studies.
Polymorphisms are variations in DNA sequence that occur on average once every 300 to
500 bp. Variations within exon sequences can lead to observable changes, such as differ-
ences in eye color, blood type, and disease susceptibility. Most variations occur within
introns and have little or no effect on an organism’s appearance or function, yet they are
detectable at the DNA level and can be used as markers. Examples of these types of
markers include (1) restriction fragment length polymorphisms (RFLPs), which reflect
sequence variations in DNA sites that can be cleaved by DNA restriction enzymes (see
box), and (2) variable number of tandem repeat sequences, which are short repeated
sequences that vary in the number of repeated units and, therefore, in length (a character-
istic easily measured). The human genetic linkage map is constructed by observing how
frequently two markers are inherited together.
Two markers located near each other on the same chromosome will tend to be passed
together from parent to child. During the normal production of sperm and egg cells, DNA
strands occasionally break and rejoin in different places on the same chromosome or on
the other copy of the same chromosome (i.e., the homologous chromosome). This process
(called meiotic recombination) can result in the separation of two markers originally on the
same chromosome (Fig. 8). The closer the markers are to each other—the more “tightly
linked”—the less likely a recombination event will fall between and separate them. Recom-
bination frequency thus provides an estimate of the distance between two markers.
On the genetic map, distances between markers are measured in terms of centimorgans
(cM), named after the American geneticist Thomas Hunt Morgan. Two markers are said to
be 1 cM apart if they are separated by recombination 1% of the time. A genetic distance of
1 cM is roughly equal to a physical distance of 1 million bp (1 Mb). The current resolution
of most human genetic map regions is about 10 Mb.
The value of the genetic map is that an inherited disease can be located on the map by
following the inheritance of a DNA marker present in affected individuals (but absent in
unaffected individuals), even though the molecular basis of the disease may not yet be
understood nor the responsible gene identified. Genetic maps have been used to find the
exact chromosomal location of several impor-
tant disease genes, including cystic fibrosis,
sickle cell disease, Tay-Sachs disease, fragile
X syndrome, and myotonic dystrophy.
One short-term goal of the genome project is
to develop a high-resolution genetic map (2 to
5 cM); recent consensus maps of some chro-
mosomes have averaged 7 to 10 cM between
genetic markers. Genetic mapping resolution
has been increased through the application of
recombinant DNA technology, including in vitro
radiation-induced chromosome fragmentation
and cell fusions (joining human cells with those
of other species to form hybrid cells) to create
panels of cells with specific and varied human
13
FATHER MOTHER
Marker M
and HD
M
HD
M
HD
M M
HD
Marker M
and HD
Marker M
Only
*
Marker M
and HD
CHILDREN
*
Recombinant: Frequency of this event reflects the distance
between genes for the marker M and HD.
ORNL-DWG 91M-17363
Fig. 8. Constructing a Genetic
Linkage Map. Genetic linkage
maps of each chromosome are
made by determining how fre-
quently two markers are passed
together from parent to child.
Because genetic material is some-
times exchanged during the pro-
duction of sperm and egg cells,
groups of traits (or markers) origi-
nally together on one chromosome
may not be inherited together.
Closely linked markers are less
likely to be separated by spon-
taneous chromosome rearrange-
ments. In this diagram, the vertical
lines represent chromosome 4
pairs for each individual in a family.
The father has two traits that can
be detected in any child who
inherits them: a short known DNA
sequence used as a genetic
marker (M) and Huntington’s
disease (HD). The fact that one
child received only a single trait (M)
from that particular chromosome
indicates that the father’s genetic
material recombined during the
process of sperm production. The
frequency of this event helps deter-
mine the distance between the two
DNA sequences on a genetic map .
chromosomal components. Assessing the frequency of marker sites remaining together
after radiation-induced DNA fragmentation can establish the order and distance between
the markers. Because only a single copy of a chromosome is required for analysis, even
nonpolymorphic markers are useful in radiation hybrid mapping. [In meiotic mapping
(described above), two copies of a chromosome must be distinguished from each other by
polymorphic markers.]
Physical Maps
Different types of physical maps vary in their degree of resolution. The lowest-resolution
physical map is the chromosomal (sometimes called cytogenetic) map, which is based on
the distinctive banding patterns observed by light microscopy of stained chromosomes. A
cDNA map shows the locations of expressed DNA regions (exons) on the chromosomal
map. The more detailed cosmid contig map depicts the order of overlapping DNA frag-
ments spanning the genome. A macrorestriction map describes the order and distance
between enzyme cutting (cleavage) sites. The highest-resolution physical map is the
complete elucidation of the DNA base-pair sequence of each chromosome in the human
genome. Physical maps are described in greater detail below.
14
Primer on
Molecular
Genetics
Low-Resolution Physical Mapping
Chromosomal map. In a chromosomal map, genes or other identifiable DNA fragments
are assigned to their respective chromosomes, with distances measured in base pairs.
These markers can be physically associated with particular bands (identified by cytoge-
netic staining) primarily by in situ hybridization, a technique that involves tagging the DNA
marker with an observable label (e.g., one that fluoresces or is radioactive). The location
of the labeled probe can be detected after it binds to its complementary DNA strand in an
intact chromosome.
As with genetic linkage mapping, chromosomal mapping can be used to locate genetic
markers defined by traits observable only in whole organisms. Because chromosomal
maps are based on estimates of physical distance, they are considered to be physical
maps. The number of base pairs within a band can only be estimated.
Until recently, even the best chromosomal maps could be used to locate a DNA fragment
only to a region of about 10 Mb, the size of a typical band seen on a chromosome.
Improvements in fluorescence in situ hybridization (FISH) methods allow orientation of
DNA sequences that lie as close as 2 to 5 Mb. Modifications to in situ hybridization
methods, using chromosomes at a stage in cell division (interphase) when they are less
compact, increase map resolution to around 100,000 bp. Further banding refinement
might allow chromosomal bands to be associated with specific amplified DNA fragments,
an improvement that could be useful in analyzing observable physical traits associated
with chromosomal abnormalities.
cDNA map. A cDNA map shows the positions of expressed DNA regions (exons)
relative to particular chromosomal regions or bands. (Expressed DNA regions are those
transcribed into mRNA.) cDNA is synthesized in the laboratory using the mRNA molecule
as a template; base-pairing rules are followed (i.e., an A on the mRNA molecule will pair
with a T on the new DNA strand). This cDNA can then be mapped to genomic regions.
Because they represent expressed genomic regions, cDNAs are thought to identify the
parts of the genome with the most biological and medical significance. A cDNA map can
provide the chromosomal location for genes whose functions are currently unknown. For
disease-gene hunters, the map can also suggest a set of candidate genes to test when
the approximate location of a disease gene has been mapped by genetic linkage tech-
niques.
High-Resolution Physical Mapping
The two current approaches to high-resolution physical mapping are termed “top-down”
(producing a macrorestriction map) and “bottom-up” (resulting in a contig map). With
either strategy (described below) the maps represent ordered sets of DNA fragments that
are generated by cutting genomic DNA with restriction enzymes (see Restriction En-
zymes box at right). The fragments are then amplified by cloning or by polymerase chain
reaction (PCR) methods (see DNA Amplification). Electrophoretic techniques are used to
separate the fragments according to size into different bands, which can be visualized by
15
direct DNA staining or by hybridization with DNA probes of interest. The use of purified
chromosomes separated either by flow sorting from human cell lines or in hybrid cell lines
allows a single chromosome to be mapped (see Separating Chromosomes box at right).
A number of strategies can be used to reconstruct the original order of the DNA fragments
in the genome. Many approaches make use of the ability of single strands of DNA and/or
RNA to hybridize—to form double-stranded segments by hydrogen bonding between
complementary bases. The extent of sequence homology between the two strands can be
Separating Chromosomes
Flow sorting
Pioneered at Los Alamos National Laboratory (LANL), flow sorting employs flow
cytometry to separate, according to size, chromosomes isolated from cells during
cell division when they are condensed and stable. As the chromosomes flow singly
past a laser beam, they are differen-tiated by analyzing the amount of DNA present,
and individual chromosomes are directed to specific collection tubes.
Somatic cell hybridization
In somatic cell hybridization, human cells and rodent tumor cells are fused (hybrid-
ized); over time, after the chromosomes mix, human chromosomes are preferentially
lost from the hybrid cell until only one or a few remain. Those individual hybrid cells
are then propagated and maintained as cell lines containing specific human chromo-
somes. Improvements to this technique have generated a number of hybrid cell
lines, each with a specific single human chromosome.
Restriction Enzymes: Microscopic Scalpels
Isolated from various bacteria, restriction enzymes recognize short DNA sequences
and cut the DNA molecules at those specific sites. (A natural biological function of
these enzymes is to protect bacteria by attacking viral and other foreign DNA.) Some
restriction enzymes (rare-cutters) cut the DNA very infrequently, generating a small
number of very large fragments (several thousand to a million bp). Most enzymes cut
DNA more frequently, thus generating a large number of small fragments (less than a
hundred to more than a thousand bp).
On average, restriction enzymes with
• 4-base recognition sites will yield pieces 256 bases long,
• 6-base recognition sites will yield pieces 4000 bases long, and
• 8-base recognition sites will yield pieces 64,000 bases long.
Since hundreds of different restriction enzymes have been characterized, DNA can
be cut into many different small fragments.
16
inferred from the length of the double-stranded segment. Fingerprinting uses restriction
map data to determine which fragments have a specific sequence (fingerprint) in common
and therefore overlap. Another approach uses linking clones as probes for hybridization to
chromosomal DNA cut with the same restriction enzyme.
Macrorestriction maps: Top-down mapping. In top-down mapping, a single
chromosome is cut (with rare-cutter restriction enzymes) into large pieces, which are
ordered and subdivided; the smaller pieces are then mapped further. The resulting macro-
restriction maps depict the order of and distance between sites at which rare-cutter
enzymes cleave (Fig. 9a). This approach yields maps with more continuity and fewer gaps
between fragments than contig maps (see below), but map resolution is lower and may
not be useful in finding particular genes; in addition, this strategy generally does not
produce long stretches of mapped sites. Currently, this approach allows DNA pieces to be
located in regions measuring about 100,000 bp to 1 Mb.
The development of pulsed-field gel (PFG) electrophoretic methods has improved the
mapping and cloning of large DNA molecules. While conventional gel electrophoretic
methods separate pieces less than 40 kb (1 kb = 1000 bases) in size, PFG separates
molecules up to 10 Mb, allowing the application of both conventional and new mapping
methods to larger genomic regions.
Primer on
Molecular
Genetics
Fig. 9. Physical Mapping Strategies. Top-down physical mapping (a) produces maps with few gaps, but map resolution may not
allow location of specific genes. Bottom-up strategies (b) generate extremely detailed maps of small areas but leave many gaps.
A combination of both approaches is being used. [Source: Adapted from P. R. Billings et al., “New Techniques for Physical
Mapping of the Human Genome,”
The FASEB Journal
5(1), 29 (1991).]
(a) (b)
Chromosome Linked Library
Detailed but incomplete
Arrayed Library
Fingerprint, map, sequence, or
hybridize to detect overlaps
Macrorestriction Map
Complete but low resolution
Bottom
Up
Top
Down
Contig
17
Contig maps: Bottom-up mapping. The bottom-up approach involves cutting the
chromosome into small pieces, each of which is cloned and ordered. The ordered frag-
ments form contiguous DNA blocks (contigs). Currently, the resulting “library” of clones
varies in size from 10,000 bp to 1 Mb (Fig. 9b). An advantage of this approach is the
accessibility of these stable clones to other researchers. Contig construction can be
verified by FISH, which localizes cosmids to specific regions within chromosomal bands.
Contig maps thus consist of a linked library of small overlapping clones representing a
complete chromosomal segment. While useful for finding genes localized to a small area
(under 2 Mb), contig maps are difficult to extend over large stretches of a chromosome
because all regions are not clonable. DNA probe techniques can be used to fill in the
gaps, but they are time consuming. Figure 10 is a diagram relating the different types of
maps.
Technological improvements now make possible the cloning of large DNA pieces, using
artificially constructed chromosome vectors that carry human DNA fragments as large as
1 Mb. These vectors are maintained in yeast cells as artificial chromosomes (YACs). (For
more explanation, see DNA Amplification.) Before YACs were developed, the largest
cloning vectors (cosmids) carried inserts of only 20 to 40 kb. YAC methodology drastically
reduces the number of clones to be ordered; many YACs span entire human genes. A
more detailed map of a large YAC insert can be produced by subcloning, a process in
which fragments of the original insert are cloned into smaller-insert vectors. Because
some YAC regions are unstable, large-capacity bacterial vectors (i.e., those that can
accommodate large inserts) are also being developed.
GENETIC
MAP
RESTRICTION
FRAGMENTS
ORNL-DWG 91M-17369
ORDERED
LIBRARY
SEQUENCE
Gene or
Polymorphism
Gene or
Polymorphism
Fig. 10. Types of Genome
Maps. At the coarsest resolution,
the genetic map measures
recombination frequency between
linked markers (genes or poly-
morphisms). At the next reso-
lution level, restriction fragments
of 1 to 2 Mb can be separated
and mapped. Ordered libraries of
cosmids and YACs have insert
sizes from 40 to 400 kb. The base
sequence is the ultimate physical
map. Chromosomal mapping (not
shown) locates genetic sites in
relation to bands on chromo-
somes (estimated resolution of
5 Mb); new in situ hybridization
techniques can place loci 100 kb
apart. These direct strategies
link the other four mapping
approaches diagramed here.
[Source: see Fig. 9.]
18
Sequencing Technologies
The ultimate physical map of the human genome is the complete DNA sequence—the
determination of all base pairs on each chromosome. The completed map will provide
biologists with a Rosetta stone for studying human biology and enable medical research-
ers to begin to unravel the mechanisms of inherited diseases. Much effort continues to be
spent locating genes; if the full sequence were known, emphasis could shift to determining
gene function. The Human Genome Project is creating research tools for 21st-century
biology, when the goal will be to understand the sequence and functions of the genes
residing therein.
Achieving the goals of the Human Genome Project will require substantial improvements
in the rate, efficiency, and reliability of standard sequencing procedures. While technologi-
cal advances are leading to the automation of standard DNA purification, separation, and
detection steps, efforts are also focusing on the development of entirely new sequencing
methods that may eliminate some of these steps. Sequencing procedures currently
involve first subcloning DNA fragments from a cosmid or bacteriophage library into special
sequencing vectors that carry shorter pieces of the original cosmid fragments (Fig. 11).
The next step is to make the subcloned fragments into sets of nested fragments differing
in length by one nucleotide, so that the specific base at the end of each successive
fragment is detectable after the fragments have been separated by gel electrophoresis.
Current sequencing technologies are discussed later.
Primer on
Molecular
Genetics
19
Fig. 11. Constructing Clones for Sequencing. Cloned DNA molecules must be made
progressively smaller and the fragments subcloned into new vectors to obtain fragments small
enough for use with current sequencing technology. Sequencing results are compiled to provide
longer stretches of sequence across a chromosome. (Source: adapted from David A. Micklos and
Greg A. Freyer,
DNA Science, A First Course in Recombinant DNA Technology
, Burlington, N.C.:
Carolina Biological Supply Company, 1990.)
HUMAN
CHROMOSOME
Average 400,000-bp
fragment cloned into YAC
YEAST ARTIFICIAL CHROMOSOME (YAC)
COSMID
Average 40,000-bp
fragment cloned into cosmid
Eco
RI
Eco
RI
Eco
RI
Eco
RI
Eco
RI
Eco
RI
Eco
RI
Bam
HI
Bam
HI
Bam
HI
Bam
HI
Bam
HI
Bam
HI
Bam
HI
Average 4000-bp
fragment cloned into
plasmid or sequencing
vector
PLASMID
PARTIAL NUCLEOTIDE SEQUENCE
(from human β-globin gene)
GGCACTGACTCTCTCTGCCTATTGGTCTATTTTCCCACCCTTAGGCTGCTGGTGGTCTACCC
TGGACCCAGAGGTTCTTTGAGTCCTTTGGGGATCTGTCCACTCCTGATGCTGTTATGG. . .
ORNL-DWG 91M-17367
RESTRICTION MAP
20
DNA Amplification:
Cloning and Polymerase
Chain Reaction (PCR)
Cloning (in vivo DNA
amplification)
Cloning involves the use of recombinant DNA
technology to propagate DNA fragments inside a
foreign host. The fragments are usually isolated
from chromosomes using restriction enzymes
and then united with a carrier (a vector). Follow-
ing introduction into suitable host cells, the DNA
fragments can then be reproduced along with the
host cell DNA. Vectors are DNA molecules
originating from viruses, bacteria, and yeast
cells. They accommodate various sizes of
foreign DNA fragments ranging from 12,000 bp
for bacterial vectors (plasmids and cosmids) to
1 Mb for yeast vectors (yeast artificial chromo-
somes). Bacteria are most often the hosts for
these inserts, but yeast and mammalian cells
are also used (a).
Cloning procedures provide unlimited material for
experimental study. A random (unordered) set of
cloned DNA fragments is called a library.
Genomic libraries are sets of overlapping frag-
ments encompassing an entire genome (b). Also
available are chromosome-specific libraries,
which consist of fragments derived from source
DNA enriched for a particular chromosome. (See
Separating Chromosomes box.)
Recombinant DNA Molecule
Cut DNA
molecules
with restriction
enzyme to
generate
complementary
sequences on
the vector and
the fragment
Vector DNA
Chromosomal DNA
Fragment
To Be Cloned
Join vector and chromosomal
DNA fragment, using
the enzyme DNA ligase
Introduce into bacterium
Recombinant
DNA Molecule
Bacterial
Chromosome
ORNL-DWG 92M-6649
(a)
(a)
Cloning DNA in Plasmids. By fragmenting DNA of any
origin (human, animal, or plant) and inserting it in the DNA of
rapidly reproducing foreign cells, billions of copies of a single
gene or DNA segment can be produced in a very short time.
DNA to be cloned is inserted into a plasmid (a small, self-
replicating circular molecule of DNA) that is separate from
chromosomal DNA. When the recombinant plasmid is intro-
duced into bacteria, the newly inserted segment will be
replicated along with the rest of the plasmid.
21
(b)
Constructing an
Overlapping Clone Library.
A collection of clones of
chromosomal DNA, called a
library, has no obvious order
indicating the original posit-
ions of the cloned pieces on
the uncut chromosome.
To establish that two partic-
ular clones are adjacent to
each other in the genome,
libraries of clones containing
partly overlapping regions
must be constructed. These
clone libraries are ordered by
dividing the inserts into smaller
fragments and determining
which clones share common
DNA sequences.
Restriction Enzyme Cutting Sites
Chromosomal DNA
Partially cut chromosomal DNA with a frequent-cutter
restriction enzyme (controlling the conditions so that
not all possible sites are cut on every copy of a specific
sequence) to generate a series of overlapping fragments
representing every cutting site in the original sample
Overlapping
Fragments
Cut vector DNA
with a restriction
enzyme
Join chromosomal fragments
to vector, using the enzyme
DNA ligase
Library of
Overlapping
Genomic Clones
Chromosomal DNA
Vector DNA
ORNL-DWG 92M-6650
Vector DNA
(b)
22
PCR (in vitro DNA amplification)
Described as being to genes what Gutenberg’s printing press was to the written word, PCR can amplify a
desired DNA sequence of any origin (virus, bacteria, plant, or human) hundreds of millions of times in a
matter of hours, a task that would have required several days with recombinant technology. PCR is espe-
cially valuable because the reaction is highly specific, easily automated, and capable of amplifying minute
amounts of sample. For these reasons, PCR has also had a major impact on clinical medicine, genetic
disease diagnostics, forensic science, and evolutionary biology.
PCR is a process based on a specialized polymerase enzyme, which can synthesize a complementary
strand to a given DNA strand in a mixture containing the 4 DNA bases and 2 DNA fragments (primers, each
about 20 bases long) flanking the target sequence. The mixture is heated to separate the strands of double-
stranded DNA containing the target sequence and then cooled to allow (1) the primers to find and bind to
their complementary sequences on the separated strands and (2) the polymerase to extend the primers into
new complementary strands. Repeated heating and cooling cycles multiply the target DNA exponentially,
since each new double strand separates to become two templates for further synthesis. In about 1 hour, 20
PCR cycles can amplify the target by a millionfold.
TARGET DNA
P1
P2
Taq
When heated to 72°C,
Taq
polymerase extends complementary
strands from primers
First synthesis cycle results
in two copies of
target DNA sequence
DENATURE
DNA
HYBRIDIZE
PRIMERS
EXTEND
NEW DNA
STRANDS
Second synthesis cycle
results in four copies of
target DNA sequence
DNA Amplification Using PCR
FIRST CYCLESECOND CYCLE
Reaction mixture contains target
DNA sequence to be amplified,
two primers (P1, P2), and
heat-stable
Taq
polymerase
Reaction mixture is heated
tp 95°C to denature target
DNA. Subsequent cooling
to 37°C allows primers to
hybridize to complementary
sequences in target DNA
Source:
DNA Science,
see Fig. 11.
23
T C G A
G
T
C
G
A
C
T
G
C
A
A
T
2. Sequence read (bottom to top)
from gel autoradiogram
T C G A
T C G A
1. Sequencing reactions loaded
onto polyacrylamide gel for
fragment separation
ORNL-DWG 91M-17368
Current Sequencing Technologies
The two basic sequencing approaches, Maxam-Gilbert and Sanger, differ primarily in the
way the nested DNA fragments are produced. Both methods work because gel electro-
phoresis produces very high resolution separations of DNA molecules; even fragments
that differ in size by only a single nucleotide can be resolved. Almost all steps in these
sequencing methods are now automated. Maxam-Gilbert sequencing (also called the
chemical degradation method) uses chemicals to cleave DNA at specific bases, resulting
in fragments of different lengths. A refinement to the Maxam-Gilbert method known as
multiplex sequencing enables investigators to analyze about 40 clones on a single DNA
sequencing gel. Sanger sequencing (also called the chain termination or dideoxy method)
involves using an enzymatic procedure to synthesize DNA chains of varying length in four
different reactions, stopping the DNA replication at positions occupied by one of the four
bases, and then determining the resulting fragment lengths (Fig. 12).
These first-generation gel-based sequencing technologies are now being
used to sequence small regions of interest in the human genome. Although
investigators could use existing technology to sequence whole chromo-
somes, time and cost considerations make large-scale sequencing projects of
this nature impractical. The smallest human chromosome (Y) contains 50 Mb;
the largest (chromosome 1) has 250 Mb. The largest continuous DNA
sequence obtained thus far, however, is approximately 350,000 bp, and the
best available equipment can sequence only 50,000 to 100,000 bases per
year at an approximate cost of $1 to $2 per base. At that rate, an unaccept-
able 30,000 work-years and at least $3 billion would be required for sequenc-
ing alone.
Fig. 12. DNA Sequencing. Dideoxy sequencing (also called chain-termination or
Sanger method) uses an enzymatic procedure to synthesize DNA chains of varying
lengths, stopping DNA replication at one of the four bases and then determining the
resulting fragment lengths. Each sequencing reaction tube (T, C, G, and A) in the
diagram contains
• a DNA template, a primer sequence, and a DNA polymerase to initiate synthesis of a
new strand of DNA at the point where the primer is hybridized to the template;
• the four deoxynucleotide triphosphates (dATP, dTTP, dCTP, and dGTP) to extend
the DNA strand;
• one labeled deoxynucleotide triphosphate (using a radioactive element or dye); and
• one
di
deoxynucleotide triphosphate, which terminates the growing chain wherever it
is incorporated. Tube A has
di
dATP, tube C has
di
dCTP, etc.
For example, in the A reaction tube the ratio of the dATP to
di
dATP is adjusted so that
each tube will have a collection of DNA fragments with a
di
dATP incorporated for each
adenine position on the template DNA fragments. The fragments of varying length are
then separated by electrophoresis (1) and the positions of the nucleotides analyzed to
determine sequence. The fragments are separated on the basis of size, with the shorter
fragments moving faster and appearing at the bottom of the gel. Sequence is read from
bottom to top (2). (Source: see Fig. 11.)
24
Sequencing Technologies Under Development
A major focus of the Human Genome Project is the development of automated sequenc-
ing technology that can accurately sequence 100,000 or more bases per day at a cost of
less than $.50 per base. Specific goals include the development of sequencing and
detection schemes that are faster and more sensitive, accurate, and economical. Many
novel sequencing technologies are now being explored, and the most promising ones will
eventually be optimized for widespread use.
Second-generation (interim) sequencing technologies will enable speed and accuracy to
increase by an order of magnitude (i.e., 10 times greater) while lowering the cost per base.
Some important disease genes will be sequenced with such technologies as (1) high-
voltage capillary and ultrathin electrophoresis to increase fragment separation rate and
(2) use of resonance ionization spectroscopy to detect stable isotope labels.
Third-generation gel-less sequencing technologies, which aim to increase efficiency by
several orders of magnitude, are expected to be used for sequencing most of the human
genome. These developing technologies include (1) enhanced fluorescence detection
of individual labeled bases in flow cytometry, (2) direct reading of the base sequence
on a DNA strand with the use of scanning tunneling or atomic force microscopies,
(3) enhanced mass spectrometric analysis of DNA sequence, and (4) sequencing by
hybridization to short panels of nucleotides of known sequence. Pilot large-scale
sequencing projects will provide opportunities to improve current technologies and will
reveal challenges investigators may encounter in larger-scale efforts.
Partial Sequencing To Facilitate Mapping, Gene
Identification
Correlating mapping data from different laboratories has been a problem because of
differences in generating, isolating, and mapping DNA fragments. A common reference
system designed to meet these challenges uses partially sequenced unique regions (200
to 500 bp) to identify clones, contigs, and long stretches of sequence. Called sequence
tagged sites (STSs), these short sequences have become standard markers for physical
mapping.
Because coding sequences of genes represent most of the potentially useful information
content of the genome (but are only a fraction of the total DNA), some investigators have
begun partial sequencing of cDNAs instead of random genomic DNA. (cDNAs are derived
from mRNA sequences, which are the transcription products of expressed genes.) In addi-
tion to providing unique markers, these partial sequences [termed expressed sequence
tags (ESTs)] also identify expressed genes. This strategy can thus provide a means of
rapidly identifying most human genes. Other applications of the EST approach include
determining locations of genes along chromosomes and identifying coding regions in
genomic sequences.
Primer on
Molecular
Genetics
25
End Games: Completing Maps and
Sequences; Finding Specific Genes
Starting maps and sequences is relatively simple; finishing them will require new
strategies or a combination of existing methods. After a sequence is determined using the
methods described above, the task remains to fill in the many large gaps left by current
mapping methods. One approach is single-chromosome microdissection, in which a piece
is physically cut from a chromosomal region of particular interest, broken up into smaller
pieces, and amplified by PCR or cloning (see DNA Amplification). These fragments can
then be mapped and sequenced by the methods previously described.
Chromosome walking, one strategy for filling in gaps, involves hybridizing a primer of
known sequence to a clone from an unordered genomic library and synthesizing a short
complementary strand (called “walking” along a chromosome). The complementary strand
is then sequenced and its end used as the next primer for further walking; in this way the
adjacent, previously unknown, region is identified and sequenced. The chromosome is
thus systematically sequenced from one end to the other. Because primers must be syn-
thesized chemically, a disadvantage of this technique is the large number of different
primers needed to walk a long distance. Chromosome walking is also used to locate
specific genes by sequencing the chromosomal segments between markers that flank the
gene of interest (Fig. 13).
The current human genetic map has about 1000 markers, or 1 marker spaced every
3 million bp; an estimated 100 genes lie between each pair of markers. Higher-resolution
genetic maps have been made in regions of particular interest. New genes can be located
by combining genetic and physical map information for a region. The genetic map basi-
cally describes gene order. Rough information about gene location is sometimes available
also, but these data must be used with caution because recombination is not equally likely
at all places on the chromosome. Thus the genetic map, compared to the physical map,
stretches in some places and compresses in others, as though it were drawn on a rubber
band.
The degree of difficulty in finding a disease gene of interest depends largely on what
information is already known about the gene and, especially, on what kind of DNA alter-
ations cause the disease. Spotting the disease gene is very difficult when disease results
from a single altered DNA base; sickle cell anemia is an example of such a case, as are
probably most major human inherited diseases. When disease results from a large DNA
rearrangement, this anomaly can usually be detected as alterations in the physical map of
the region or even by direct microscopic examination of the chromosome. The location of
these alterations pinpoints the site of the gene.
Identifying the gene responsible for a specific disease without a map is analogous to
finding a needle in a haystack. Actually, finding the gene is even more difficult, because
even close up, the gene still looks like just another piece of hay. However, maps give
clues on where to look; the finer the map’s resolution, the fewer pieces of hay to be tested.