gene isolation and mapping protocols
Bạn đang xem bản rút gọn của tài liệu. Xem và tải ngay bản đầy đủ của tài liệu tại đây (20.41 MB, 314 trang )
1
Gene Mapping Goes from FISH to Surfing the Net
John Valdes and Danilo A. Tagle
1. Introduction
The amval of the second millenmum will usher m unsurpassed information
and knowledge of our genetic constitution, and will promise to revolutronize
basic research and molecular medicine. The road toward a complete under-
standing of our genetic makeup is largely the fruit of the Human Genome
Project that has mmated, advanced, and made major strtdes in constructing
genetic and physical maps of humans and other model organisms. Already
enttre genomic sequences of a few prokaryottc organisms have become avarl-
able with efforts toward completion of the budding yeast not too far behind.
Gene mapping and identification are critical steps m this ambitrous undertak-
ing. Unfortunately, the identrficatton of genes, especially those responsible for
the vast majority of inherited human disorders, must often proceed without any
knowledge of then biochemical functions. To wit, positional clomng (I) has
taken center stage toward the initial steps m the molecular characterization of
the estimated 100,000 genes in the human genome. This approach has gar-
nered over 60 “diseased” genes thus far, with many more to come as the pro-
cess becomes more streamlined. Despite having achieved in the last several
years a framework of genetic and physical maps of the human genome, none-
theless the efficient and comprehensive isolation of transcribed sequences
within large targeted genomic intervals remains a formidable task. The numer-
ous chapters in this book document the creativity and ingenuity of various
investigators and laboratories m this global effort. Our aim in this introductory
chapter is to give an overvrew of gene mapping and assess where approaches
in gene isolation are headed m the near future.
From Methods IR Molecular B/o/ogy, Vol 68 Gene lsolatfon and Mapprng Protocols
Edlted by J Boultwood Humana Press Inc , Totowa, NJ
1
Valdes and Tag/e
7.7. ldenfifying
and
Defining the Chromosome of Interest
The mapping of a gene that contains disease-causing mutations frequently
begins with the assignment of the gene to a single chromosome or to a specific
subchromosomal region. Chromosomal gene assignments can be accomplished
in several ways. For diseases where a large collection of affected families
exists, the gene can be locahzed by lmkage analysts which involves studying
the segregation pattern of the disease phenotype with selected genetic markers
within a pedigree. Statistical methods are used to determine the likelihood that
the marker and disease are segregating Independently. If the chance of mde-
pendent segregation 1s Cl in 1000 (an LOD score of 3), then lmkage 1s assumed.
Identification of recombinant families using addmonal polymorphrc markers
allows further delineation of the lmked interval. Linkage analysis has shown
widespread success m mapping monogenic disorders that show clear Mende-
lian inheritance patterns. The same principles are now bemg applied to poly-
gemc diseases (those that show complex genetic patterns, likely owing to
multiple genes and/or environmental factors acting m combmation), but this
has proven difficult in practice (2). Proposed soluttons have mcluded use of
standardized ascertainment and the incorporation of interference models (3,4),
inclusion of larger sample sizes, or use of genetically homogeneous popula-
tions in lmkage disequilibrium studies (5).
Human-rodent somatic cell hybrids (either monochromosomal, regional/dele-
tion, or radiation-reduced mapping panels) provide a convenient resource for
mapping of genes by hybridization or polymerase chain reaction (PCR). Hybrid
cell lines have also been useful in genetic complementation studies, such as in
xeroderma plgmentosa and m Niemann-Pick disease (6). Aside from mapping,
radiation hybrids provide additional information about the order and distance
of markers/genes (7,s) where segments of DNA that are farther apart on a chro-
mosome are more likely to be broken apart by radiation and thus segregate
independently in the radiation hybrid cells than rf they were closely linked
together. Fluorescence in
situ
hybridization (FISH) is also widely used to
determine the chromosomal map location and the relative order of genes and
DNA sequences within a chromosomal band. Unlike hybrid panel mapping
where a cDNA clone or PCR primers are all that is needed, larger genomic
clones, such as cosmids, are needed when mapping via FISH. However FISH
can readily provide more precise regional mapping than regional or radiation
panels. FISH can also detect aneuploidy, gene amplification, and subtle chromo-
somal rearrangements. Discovery of a patient whose inherited disease has
resulted from a visible chromosomal abnormality has often been the ‘Jackpot”
that has accelerated efforts to clone the causal gene (9, IO). The ability to map
by FISH most chromosomal translocations that interrupts or inactivates the
Gene Mapping Goes from FISH to Surfing the Net
3
gene has tremendous utility m the field of cancer genetics (II), where molecu-
lar events leading to the loss of tumor suppressor genes (12) or the generation
of fusion genes (13) can often be detected at the chromosome level. Usmg
FISH on normal metaphase spreads, comparative genomic hybridization
(CGH) allows total genome assessment of changes m relative copy number
(regions of chromosomal loss, gain, or amplificattons) of DNA sequences using
DNA probes derived from tumor cells (14). CGH has the potential to identify
previously unknown regions involved m tumorigenesis.
1.2. Defining and Cloning the Physical Region
Once a genomic interval has been defined for a disease locus, the gene map-
ping efforts now shift toward constructmg a physical map of the candidate
region, determining accurate distances between markers, and cloning the
genomic segment m large insert clones. Physical distances can then be estab-
lished and correlated with the genetic distance (e.g., if two marker probes
hybridize to the same 250-kb fragment, then their maximum dtstance apart
must be 250 kb). Physical distances between genomic markers can be refined
with pulsed-field gel electrophoresis (PFGE) and a combination of rare cutting
restriction enzymes. Because such enzymes occur in GC-rich sequences, the
location of CpG islands, which are likely landmarks for expressed genes, can
then be determined. The pulsed-field maps also provide a reliable method for
verifying the extent of coverage of overlapping clones within a contig in rela-
tion to the actual genomic distance. PFGE can also be used to compare patient
and normal DNA samples, looking for genomic abnormalities that may have
been too small to be detected by cytogenetic techniques (13).
In long-range physical mapping, yeast artificial chromosomes (YACs) are
the cloning library of choice because of their larger insert size, which means
that fewer markers and clones are required to anchor and assemble the contig
(15,26). Where a dense ordered array of markers is available, bacterial artifi-
cial chromosomes (BACs), Pls, or even cosmids are preferred for screening
despite their smaller insert sizes (120 kb for BACs, 95 kb for P 1 s and 40 kb for
cosmids) because of their ease in purifying DNA, relative stability, and low
frequency of chimerism compared to YAC clones. Genomic clones isolated
for the candidate interval are analyzed for insert size and for degree of overlap
by marker content mapping using sequence-tagged sites (STSs) and repetitive
element fingerprint patterns. The clones or derivatives of it can be used as
probes for chromosome walking until full coverage of the candidate interval
are obtained. More importantly, these genomic clones provide a readily avail-
able source of DNA for isolating additional markers, for use as FISH or
hybridization probes, for generating sequence data, and for gene identification.
4 Valdes and Tag/e
1.3. Gene lsola tion
Genetic linkage analysis and physical mapping experiments can often
resolve the rough locatron of a gene to a region of 0.5-l centrmorgan (eqmva-
lent to a frequency of 1 recombinant/l00 meloses), which IS approx 1 Mb.
Such an interval may contain from 3G.50 genes, and rdenttfymg all the genes
n-r such a region and finding the causative gene for the disorder has been a
major bottleneck m most posmonal cloning projects. The choice of which gene
cloning strategies to utrhze often depends on the available resources in a given
laboratory. The common gene hunting methods can be divided mto hybrtdrza-
non-based and functional detection of sequences involved m RNA splicing.
Exon trapping identifies putative transcribed sequences from genomtc clones
(often cosmlds as starting templates) based on splrcmg signals present m
exon-mtron junctions. No assumptrons are made regarding the tissue-specific
pattern of expression of a given gene or of its level of expression. The targeted
exons can be internal
(17,18)
or directed toward the 3’-termmal exon
(19).
Numerous labs have applied the method successfully for both gene lsolatton
(20,21) and mapping intron-exon boundaries of known genes (22).
Transcribed sequences m genomtc DNA can also be detected by either using
labeled cDNAs as hybridization probes on arrayed genomic clones (23) or the
converse, where genomtc clones are used as probes against cDNA libraries
(24,25). The former approach has taken on numerous permutations where the
genomic YAC clones are either immobrlized on filters (26,27), brotmylated
(28-301, or used in solutron hybrrdizatron schemes (32-34). These methodolo-
gies assume some prior knowledge of the targeted gene’s expression level,
since moderately to abundantly expressed messages are those usually obtained,
as well as an idea on the proper tissue source of library to screen. Because the
techniques are hybrrdrzatron-based, problems with sticky or GC-rich cDNAs,
repeat sequences, and pseudogenes and related family gene family members
frequently accompany the final product.
None of the aforementtoned methodologtes are expected to garner full-
length clones. The end points using these techniques are for the most part small
exons or cDNA fragments that can then serve as additional expressed sequence
tagged sites (ESTs) or probes for rsolatmg larger clones
Other gene cloning strategies take advantage of certain features m the
genomlc DNA or transcript. One such feature would be CpG islands that are
areas of the human genome where the CpG dinucleotide is enriched (1 O-20
times greater than other regions). CpG islands tend to be associated with
the 5’-ends of genes and can therefore provide a means of tsolatmg those genes.
A recent survey of 375 genes m the GenBank database demonstrated that
almost all housekeeping genes, and about 40% of tissue-specific genes are
Gene Mapping Goes from FISH to Surfing the Net 5
associated wtth these Islands (3.5). These Islands can be isolated by rare-cutting
enzymes (36-38) or by PCR (39), and used as hybrrdrzatron probes against
cDNA libraries. Another feature would be the differential expression pattern
of genes in certain tissues. Subtraction techmques (40,41) have been used to
isolate genes spectfic to one particular tissue source or developmental stage,
This technique involves the use of a target cDNA hbrary (derived from a tissue
where the desired gene IS likely to be expressed) and a drover cDNA library to
subtract out most ubiquitously expressed sequences. Differential display (42-44)
is another method for isolating genes that are unique to a partrcular cell
type or developmental stage and allows the analysts of expressron patterns of
multiple cell types.
A third feature takes advantage of mutants m model organisms whose
phenotype resembles that in human. The mouse genome (as well as that of
other organisms) is also being investigated as part of the Human Genome
Project. Mouse genetic studies are able to take advantage of selective breeding,
short generation times, and backcrosses (matmg between two mice, one of
which is homozygous for a recessive tract, in order to establish the genotype of
the first). One possible approach to mappmg a gene is to isolate the mouse
homolog, determine its genetic localization within the mouse genome, and then
focus efforts on the part of the human genome to which it corresponds. Com-
parative mapping between the mouse and human is fairly well defined: The
entire genome can be separated into 68 homologous chromosomal regions (4.5,).
The observatron and characterizatron of naturally occurrmg mouse mutants
have also supplied model systems (46), as well as acceleratmg the search for
human disease genes (45).
1.4. Future Directions
There is no doubt that the number of genes being cloned by positional clon-
ing approaches is increasing at a rapid rate (5). Most of these genes have been
obtained using the methodologies outlined in this chapter. However newer
resources being made accessible through the Human Genome Project are
promising even to accelerate gene mapping and isolation at a more rapid rate.
With the increasing resolutton of the chromosome physical maps, it is now
feasible to embark on large-scale genomic sequencing (47). This has become
possible despite the lack of significant improvement in sequencing methodol-
ogy, but through a combination of faster computational machines to store and
analyze the data, ready availability of sequence-ready cosmtd clones and their
derivatives, and dense mapping information to help minimize overlap of
cosmid templates. Large-scale sequencing of genomtc clones has been com-
;sleted for a number of prokaryotic organisms (48,49) and implemented for
6 Valdes and Tag/e
diseased loci (50) as an additional gene searching tool. Sequences are queried
to the sequence databases and fed to the Gene Recognition and Analysis
Internet Link (GRAIL) server for exon prediction through computational analy-
sis of the sequence (51,.52).
Another critical development is the concerted effort to develop a transcript
map of the human genome that involves sequencing of human cDNA clones by
the Washington University Genome Sequencing Center under the auspices of
Merck (Whitehouse, NJ) (53). The centerpieces of this undertaking are the
oligo(dT)-primed, directionally cloned and normalized cDNA clones from vari-
ous tissue sources (54,55). Concomitant with the sequencing are efforts to
develop these sequences into gene-based STSs, and place them on the physical
map via YACs (56,57) and radiation hybrid maps. Although attempted in the
past on a limited scale, it is projected that this endeavor will generate approx
400,000 ESTs by early this year (53). The sequences, mapping information,
and homology results are easily accessible via World Wide Servers in the
Internet. As the number of the mapped cDNAs increase, these ESTs automati-
cally become candidate genes if they so happen to fall in an interval linked to a
disease locus. The tremendous potential of this resource can be gleamed from
recent statistics obtained by National Center of Biotechnology Information at
the National Institutes of Health that 79% of positionally cloned genes are
actually represented in the EST database (dBEST at i.
nlm.nih.gov/dbEST/index.html). Positional cloning will soon be simplified to
a positional candidate approach where linkage of a particular monogenic or
polygenic disorder to a particular chromosomal subregion will be followed by
a survey of the interval for any interesting ESTs (5).
References
1.
Collins,
F.
S. (1991) Of needles and haystacks: finding human disease genes by
positional cloning.
Clin. Genet. 39, 615-623.
2. Bishop, D. T. (1994) Linkage analysis: progress and problems.
Phil. Trans. R.
Sot. Land. 344,337-343.
3. Cloninger, C. R. (1994) Turning point in the design of linkage studies of schizo-
phrenia.
Am. J. Med. Genet. 54, 83-92.
4. Karlin, S. and Liberman, U. (1994) Theoretical recombination processes incorpo-
rating interference effects.
Theor. Popul. Biol. 46,
198-23 1.
5. Collins, F. S. (1995) Positional cloning moves from perditional to traditional.
Nut.
Genet. 9, 347-350.
6. Kurimasa, A., Ohno, K. and Oshimura, M. (1993) Restoration of the cholesterol
metabolism in 3T3 cell lines derived from the sphingomyelinosis mouse (spm/spm)
by transfer of a human chromosome 18.
Hum. Genet. 92,157-l 62.
7. Walter, M. A. and Goodfellow, P. N. (1993) Radiation hybrids: irradiation and
fusion gene transfer.
Trends Genet. 9,352-356.
8. James, M. R., Richard, C. W., III, Schott, J. J., Yoursy, C. , Clark, K., Bell, J.,
Tersilliger, J. D., Hazan, J., Dubay, C., Viginal, A., Agrapart, M., Imai, T.,
Nakamura, Y., Polymeropoulos, M., Weissenbach, J., Cox, D. R., and Lathrop, G.
M. (1994) A radiation hybrid map of 506 STS markers spanning human chromo-
some 11. Nut. Genet. 8,70-76.
9. Black, G. and Redmond, R. M. (1994) The molecular biology of Norrie’s disease.
Eye 8,491-496.
10. Chotai, K. A., Brueton, L. A., van Herwerden, L., Garrett, C., Hinkel, G. K., Schinzel,
A., Mueller, R. F., Speleman, F., and Winter, R. M. (1994) Six cases of 7p dele-
tion: clinical, cytogenetic and molecular studies. Am. J. Med. Genet. 51,270-276.
11. Cohen, M. M., Rosenblum-Vos, L. S., and Prabhakar, G. (1993) Human cytoge-
netics. Am. J. Dis. Child 147, 1159-l 166.
12. Johansson, B., Met-tens, F., and Mitelman, F. (1993) Cytogenetic deletion maps
of hematologic neoplasms: circumstantial evidence for tumor suppressor loci.
Genes Chromosomes Cancer 8,205-2 18.
13. Liu, P., Tarle, S. A., Hajra, A., Claxton, D. F., Marlton, P., Freedman, M.,
Siciliano, M. J., and Collins, F. S. (1993) Fusion between transcription factor
CBF beta/PEBP2 beta and a myosin heavy chain in acute myeloid leukemia.
Science 261, 1041-1044
14. Kallioniemi, A., Kallioniemi, 0. P., Sudar, D., Rutovitz, D., Gray, J. W.,
Waldman, F., and Pinkel, D. (1992) Comparative genomic hybridization: a rapid
new method for detecting and mapping DNA amplification in tumors. Semin.
Cancer Biol. 4,4 l-46.
15. Ramsay, M. (1994) Yeast artificial chromosome cloning. Mol. Biotechnol. 2,
181-201.
16. Khristich, J. V., Bailis, J., Diggle, K., Rodkins, A., Romo, A., Quackenbush, J.,
and Evans, G. A. (1994) Large-scale screening of yeast artificial chromosome
libraries using PCR. BioTechniques 17,498-50 1.
17. Duyk, G. M., Kim, S., Myers, R. M., and Cox, D. R. (1990) Exon trapping: a
genetic screen to identify candidate transcribed sequences in cloned mammalian
genomic DNA. Proc. Natl. Acad. Sci. USA 87,8995-8999.
18. Buckler, A. J., Chang, D. D., Graw, S. L., Brook, J. D., Haber, D. A., Sharp, P. A.,
and Housman, D. E. (1991) Exon amplification: a strategy to isolate mammalian
genes based on RNA splicing. Proc. Natl. Acad. Sci. USA 88,4005+009.
19. Krizman, D. B. and Berget, S. M. (1993) Efficient selection of 3’ terminal exons
from vertebrate DNA, Nucleic Acids Res. 21,5 198-5202.
20. Abel, K. J., Castila, L. H., Buckler, A. J., Couch, F. J., Ho, P., Schaefer, I.,
Chandrasekharappa, S. C., Collins, F. S., and Weber, B. L. (1994) Isolation of
gene sequences from the BRCAl region of chromosome 17q2 1 by exon ampliti-
cation, in Identification
of
Transcribed Sequences (Hochgeschwender, U. and
Gardiner, K., eds.), Plenum, New York, pp. 183-189.
21. Andreadis, A., Nisson, P. E., Koisk, K. S., and Watkins, P. C. (1993) The exon
trapping assay partly discriminates against alternatively spliced exons. Nucleic
Acids Res. 21,2217-2221.
8
Valdes and Tagle
22 Kwok, J B , Gardner, E., Warner, J. P., Ponder, B. A., and Mulligan, L. M. (1993)
Structural analysis of the human ret proto-oncogene usmg exon trapping
Oncogene 8,2575-2582.
23. Hochgeschwender, U , Sutcliffe, J G., and Brennan, M. B (1989) Construction
and screening of a genomic library spectfic for mouse chromosome 16. Proc
Nat1 Acad Scz USA 86,8482-8486.
24. Wallace, A4 R., Marchuk, D. A, Anderson, L. B., Letcher, R, Odeh, H. M ,
Saulmo, A M., Fountain, J. W , Brereton, A., Nicholson, J , and Mitchell, A. L.
(1990) Type I neurolibromatosis gene: identification of a large transcript disrupted
in three NFI patients. Science 249, 18 1-186
25. Elvm, P., Slynn, G., Black, D., Graham, A., Butler, R., Riley, J , Anand, R , and
Markham, A. F. (1990) Isolation of cDNA clones using yeast artificial chromo-
some probes. Nuclerc Aczds Res
l&39 13-39 17
26 Lovett, M , Kere, J , and Hinton, L M. (1991) Direct selection: a method for the
isolation of cDNAs encoded by large genomic regions. Proc. Nat1 Acad. Scz
USA 88,9628-9632.
27. Parimoo, S., PatanJab, S R., Shukla, H., Chaplin, D. D., and Weissman, S. M.
(1991) cDNA selection efficient PCR approach for the selection of cDNAs
encoded m large chromosomal DNA fragments. Proc. Nat1 Acad. SCL USA 88,
9623-9627.
28 Korn, B , Sedlacel, Z., Manta, A, Kioschis, P., Koneckt, D., Lehrach, H., and
Poustka, A (1992) A strategy for the selection of transcribed sequences m the
Xq28 region. Hum Mol Genet. 1,235-242.
29. Morgan, J G., Dolganov, G. M., Robbms, S E., Hmton, L M., and Lovett, M
(1992) The selective isolation of novel cDNAs encoded by the regions surround-
ing the human mterleukm 4 and 5 genes Nucleic Acids Res 20, 5 173-5 179.
30. Tagle, D. A., Swaroop, M., Lovett, M., and Collms, F. S (1993) Magnetic bead
capture of expressed sequences encoded within large genomic segments Nature
361,751-753.
3 1. Swaroop, A. and Yan, D. (1994) A sandwich-hybridtzation method for specific
and efficient selection of cDNA clones from genomic regions, m Zdentificatzon of
Transcrzbed Sequences (Hochgeschwender, U and Gardmer, K., eds.), Plenum,
New York, pp. 91-100.
32. Jagadeeswaran, P., Odom, M. W., and Boland, E J. (1994) Novel strategy for
isolating unknown coding sequences from genomic DNA by generating genomic-
cDNA chimeras, in Identzjkatlon of Transcrzbed Sequences (Hochgeschwender,
U. and Gardmer, K., eds.), Plenum, New York, pp 10 l-l 10.
33. Brookes, A. J. (1994) Identifymg and directly purifymg transcribed elements
coincident sequence cloning, in Zdentzfzcation of Transcribed Sequences (Hoch-
geschwender, U. and Gardiner, K , eds ), Plenum, New York, pp 111-122.
34. Hozier, J. C , Davis, L. M., Siebert, P. D., Dietrich, K., and Paterson, M C. (1994)
Finding candidate genes by preparative zn sztu hybridization, m Identification of
Transcribed Sequences (Hochgeschwender, U. and Gardmer, K., eds.), Plenum,
New York, pp 123-138.
Gene Mapping Goes from FISH to Surfing the Net 9
35. Larsen, F., Solheim, J , Kristensen, T , Kolsto, A. B., and Prydz, H (1993) A tight
cluster of five unrelated human genes on chromosome 16q22 1 Hum Mol. Genet
2,2589-2595
36. Larsen, F., Gundersen, G., Lopez, R., and Prydz, H. (1992) CpG Islands as gene
markers m the human genome Genomzcs 13,1095-l 107
37. Bird, A. P. (1989) Two classes of observed frequency for rare-cutter sites m CpG
islands Nucleic Aczds Res 17,9485.
38. Trtbtoh, C., Maestrmi, E., Bione, S., Tamamm, F., Mancini, M., Sala, C., Torrt,
G , Rivella, S , and Toniolo, D. (1994) Identification of genes and construction of
a transcriptional map in Xq28, m Identz$catzon of Transcrzbed Sequences
(Hochgeschwender, U and Gardmer, K., eds ). Plenum, New York, pp. 5-10
39. Valdes, J. M., Tagle, D. A , and Collins, F. S. (1994) Island rescue PCR: a rapid
and efficient method for isolating transcribed sequences from yeast arttfictal chro-
mosomes and cosmids Proc Nat1 Acad. Sci USA 91,5377-538 1.
40 Swaroop, A., Xu, J , Pawar, H., Jackson, C., Skolmck, C., and Agarwal, N. (1992)
A conserved retina-specific gene encodes a basic mottf/leucme zipper domam
Proc Nat1 Acad Scz USA 89,266-270.
41. Gratas, C., Herlyn, M., and Becker, D. (1994) Isolation and analysts of novel
human melanocyte-specific cDNA clones DNA Cell Biol 13, 5 15-5 19.
42. Liang, P , Averboukh, L , and Pardee, A. B. (1993) Distribution and cloning of
eukaryottc mRNAs by means of differential display. refinements and optimization
Nucleic Acids Res 21, 3269-3275
43. Liang, P., Averboukh, L., and Pardee, A. B (1993) Distribution and clonmg of
eukaryotic mRNAs by means of differential display refinements and opttmtza-
non. Nucleic Acids Res 21,3269-3275
44. Bauer, D , Muller, H., Reich, J., Riedel, H., Ahrenkiel, V., Warthoe, P., and
Strauss, M. (1993) Identtfication of differentially expressed mRNA species by an
improved display technique (DDRT-PCR) Nuclezc Aczds Res 21,4272-4280.
45. Delezoide, A. L and Vekemans, M. (1994) Waardenburg syndrome in man and
splotch mutants m the mouse: a paradigm of the usefulness of linkage and synteny
homologies m mouse and man for the genetic analysis of human congenital mal-
formations Bzomed Pharmacother 48,335-339
46. Brown, S D. (1994) Integrating maps ofthe mouse genome. Curr Opznion Genet
Dev. 4,389-394
47. Olson, M. V. (1995) A time to sequence. Science 270,394-396.
48. Fleischmann, R D., Adams, M. D., White, O., Clayton, R. A., Kirkness, E. F.,
Kerlavage, D R., et al (1995) Science 269,496-5 12
49. Fraser, C M , Gocayne, J. D., White, O., Adams, M. D., Clayton, R. A,
Fleischmann, R. D., et al (1995) The minimal gene complement of Mycoplasma
gemtahum Sczence 270, 397-403
50. Brody, L. C , Abel, K. J , Castilla, L H , Couch, F. J., McKinley, D. R., Yin, G. Y., Ho,
P. P , MeraJver, S , Chandrasekharappa, S C., Xu, J , Cole, J. L , Struewmg, J P , Valdes,
J M., Colhns, F. S , and Weber, B. L. (1995) Construction of a transcription map
surrounding the BRCAl locus of human chromosome 17 Genomzcs 25,238-247.
IO Valdes and Tag/e
5 1 Uberbacher, E C and Mural, R. J (1991) Locating protein-coding regions in
human DNA sequences by a multiple sensor-neural network approach Proc Nat1
Acad Scl USA 88, 11,261-l 1,265.
52. Shah, M. B., Guan, X., Einstein, J. R., Matls, S., Xu, Y , Mural, R. J , and
Uberbacher, E. C. (1994) User’s guide to GRAIL and GENQUEST (sequence
analysis, gene assembly and sequence comparison systems) e-mail servers and
XGRAIL (Version 1 2) and XGENQUEST (Version 1 1) client-server systems
Available by anonymous ftp to arthur.epm.oml. gov (128 219.9.76) from direc-
tory pub/xgrail or pub/xgenQuest as file Manual grail-genquest
53. Boguski, M. and Schuler, G. D. (1995) ESTabhshing a human transcript map
Nat Genet 10,369-371.
54. Soares, M. B., Bonaldo, M F., Jelene, P., Su, L , Lawton, L., and Efstrattadrs, A
(1994) Construction and characterization of a normalized cDNA library Proc
Nat1 Acad. Sci USA 91,228-232
55. Adams, M D., Soares, M. B., Kerlavage, A. R., Fields, C., and Venter, J. C. (1993)
Rapid cDNA sequencing (expressed sequence tags) from a dnectionally cloned
human mfant brain cDNA library. Nut Genet. 4,373-380
56 Polymeropoulos, M. H , Xiao, H., Sikela, J M , Adams, M , Venter, J C., and
Merril, C. R. (1993) Chromosomal drstribution of 320 genes from a brain cDNA
library Nat. Genet 4,381-386.
57. Berry, R , Stevens, T. J., Walter, N. A, Wilcox, A S , Rubano, T., Hopkins, J. A ,
Weber, J., Goold, R., Soares, M B , and Sikela, J M (1995) Gene-based
sequence-tagged-sites (STSs) as the basis for a human gene map. Nat Genet 10,
415-423.
Linkage Analysis of Genetic Disorders
Eugene W. Taylor, Jianfeng Xu, Ethylin Wang Jabs,
and Deborah A. Meyers
1. Introduction
1. 1. Definition
Genetic disorders follow a classic Mendelian dominant or recessive single-
locus pattern of inheritance or a complex genetic pattern (multiple genes and
environmental influences). In general, the complexity arises when the simple
correspondence between genotype and phenotype is not one to one due to pos-
sible misclasstfication of phenotype, mcomplete and age-dependent pene-
trance, phenocopies, genetic heterogeneity and/or ohgogemc inheritance.
Errors in diagnosis could be the result of variable expression of a disease with
mildly affected individuals being misdiagnosed as unaffected. In the presence
of incomplete or age-dependent penetrance, an mdividual who inherits a pre-
disposing disease allele may not manifest the disease at all or the chance of
manifesting the disease may depend on his or her age. On the other hand,
phenocopies are indivtduals who do not inherit the disease allele but have the
disease m question, probably caused by environmental factors and/or other
genes. Genetic heterogeneity is a situation where mutations in any one of
several genes may result m identical phenotype. Oligogemc inheritance
requires the simultaneous presence of mutations in multiple genes.
1.2. Types of Approaches
The lack of a clear one-to-one relationship between genotype and pheno-
type makes genetic studies difficult; however, several genetic epidemiology
approaches are helpful m determining if there is a genetic component to a com-
plex disorder. These approaches are used to determine whether a disorder is
caused by environmental factors, polygenes (several genes affect the disorder,
From Methods in Molecular B/ology, Vol 68 Gene /so/at/on and Mapping Protocols
Edlted by J Boultwood Humana Press Inc , Totowa, NJ
11
12
Taylor et al.
each by a small amount), major genes (one or several major genes involved),
or mixed polygenic and major genes (in addition to a major gene, there 1s still
a residual polygemc effect).
1.2.1. Familial Aggregation (Relative Risk)
Although familial aggregation of a disorder could be caused by either com-
mon environmental factors within a family or genetic components, it 1s usually
the first hint that a disorder may have a genettc component. In the presence of
familial aggregation, the recurrent risk for relatives of an affected person 1s
higher than that of the general population. Often, an accurate estimate of the
recurrent nsk m relattves and the populatton mcidence and prevalence is drff-
cult to obtain. Well-designed large-scale epidemiological studies and even
longitudmal studies are needed (I).
Relattve risk, h,, defined as the mctdence rate for a relative of an affected
person divided by that for the general population, is one measure of familial
aggregation. The subscript denotes the type of relative, for example ho and h,
are the risk to offspring and sibs, respectively. Rtsch (2) showed that genettc
mapping IS much easier for traits with hrgh hs (for example hs > 10) than for
those with low (for example hs < 2). Again, it may be difficult to obtain accu-
rate estimates of these risks. Risk ratios are very high for Mendelian disorders,
because family members of an affected individual may inherit the same gene,
whereas the risk in the general population is very low.
1.2.2. Twin Studies
Twms constttute a unique sample design provided by nature, and are an
excellent way to match for age and many envrronmental factors. The goal of
twm studies is to compare similarities (correlation coefficients for quantitative
traits and concordance rates for qualitative traits) m monozygotic twins (MZ)
and dizygotrc twms (DZ). A large difference m the degree of similarity between
MZ and DZ twins suggests a genetic component. For example, in a study of
938 female twin pairs, there is a concordance rate of 37.3% of major depres-
sion in MZ twins, compared to a DZ rate of 23.9%, which suggests a genetic
etrology (3). Studies of twins raised apart (adopted) can be very useful m par-
titioning of environmental influences.
I .2.3. Segregation Analysis
Segregation analysis is used in Mendelian disorders to estimate various
parameters, such as penetrance, whereas for complex disorders, segregation
analysis is a useful tool to identify the mode of inheritance and estimate impor-
tant parameters. In complex segregation analysts, the fitting of various speci-
fied models to the observed inheritance pattern m the pedigrees is compared.
Lmkage Analysis
13
In other words how likely is tt that we observe the mherrtance pattern in the
available pedigrees if the mherttance pattern 1s polygemc, one-locus major gene
or multiple genes? The best Iittmg and most parsimonious model (model with
higher likelihood and less parameters) suggests that the specified model is the
most likely mode of mherttance. Models from segregation analysis are needed
if the classic LOD score approach is used for the lmkage analysrs. For example,
a complex segregation analysis, using the computer program S.A G.E. (4), of
adjusted log IgE levels (adjusted for age) in a Dutch asthma famtly study popu-
lation (5) was performed, since IgE levels, an easily measured quantitattve
trait, correlate with the presence of asthma. Evidence was obtained for a major
gene inherited as a recessive trait yielding a model that could be used for lmkage.
Unfortunately, segregation analysis 1s sensitive to bias m the ascertainment
of families. The common ascertainment scheme for lmkage analyses, of select-
mg only pedigrees with multiple affected members, may lead to false evidence
of Mendellan inheritance and also to an overestrmate of gene frequency and
penetrance. However, if families are selected through a single proband, such as
m the Dutch asthma study described above, segregation analysis with adjust-
ment for ascertamment is possible. It 1s often difficult to detect a major gene,
with relatively small family sizes. Usually only one locus analysis is performed,
and it is difficult to analyze for the presence of multiple distinct loci (6). How-
ever, multilocus segregation analysts is especially worth considermg if there is
a quantitative measure related to disease status that is easily measured.
2. Parametric Linkage Analysis
2. I. Definition
Genetic linkage is used to elucidate the underlying genetic mechanisms for
inherited disorders (traits) and to find chromosomal locations for the suscepti-
bility disease genes. The demonstration of a lmkage is often considered the
highest level of statistical “proof’ that a disease is the result of a genetic mecha-
nism (7). At present, there are two major categories of genetic linkage analysis,
parametric linkage analysis using family pedigree methods and allele sharing
analysis using relative pairs (especially sib pairs).
Genetic linkage is defined as the violation of Mendel’s law of independent
assortment. The law states that the alleles at two chromosome locations (loci)
will assort independently and are transmitted to offspring m random combina-
tions. Nonindependent assortment occurs when genetic loci are positioned near
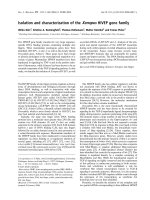
each other on the same chromosome (Fig. 1). As the distance between two loci
increases, crossovers (recombination fraction) between the two loci increase,
producing new haplotypes (the alleles for a chromosomal region received by
an individual from a given parent [8]).
14 Taylor et al,
14
23
b
d
34 14
N N N R
Fig. 1. Shows a pedrgree demonstrating linkage of a disease locus to a marker.
Children a, b, and c show no recombmation (N) between the marker and the dtsease
locus. Child d shows the occurrence of a recombmatron event (R) This child has the
disease allele 4, but IS unaffected
Parametric lmkage analysis involves the comparison of likelrhoods of
observing the segregation pattern of two loci within the pedigree for several
specific hypotheses. First, the hkelihood of observing the segregation pattern
of two loci assummg the null hypothesis of no genetlc linkage is calculated,
that is, independent assortment between the two loci or
z = log[L(fq/L@) = OS]
(1)
where Z = LOD, 0 = recombmation fraction, and L = likelihood of observ-
ing the patterns of inheritance at the given 8. Next, the likelihoods for each of
several alternative hypotheses4ifferent extents of crossing over (recombma-
tion fractionFare calculated and compared with the likelihood of the null
hypothesis by means of an “odds ratio.” This is commonly done using the
LINKAGE computer programs (9). The odds ratio consists of the likelihood of
an alternative hypothesis divided by the likelihood of the null hypothesis. For
Mendelian disorders, an odds ratio of >lOOO: 1 is usually considered evidence
for linkage (10). Clinical aspects of the disorder being studied, i.e., late age of
onset, failure of affected individuals to reproduce, or mode of inheritance, are
all factors that make it unlikely that a single family will provide significant
evidence for linkage, so often multiple small families are used The LOD scores
are summed over pedigrees as seen m the example in Table 1. To allow sum-
mation of pedigrees, the base 10 logarithm of the odds ratio is reported (LOD
score) at different recombinatron fractions. Strong evidence for lmkage of the
locus for
Treacher Collins syndrome and a marker on chromosome 5 (D5S210)
Linkage Analysis
Table 1
LOD Scores of Families with Treacher Collins Syndrome
and Marker DSS210a
Recombination fraction, 8
0.01 0.05 0.10 0.20 0.30
Family 1 0.97 1.49 1.55 1.34 0.94
Family 2 0.42 0 39 0.36 0.28 0.20
Family 3 1.78 1.65 1.49 1.13 0.73
Family 4 1.19
111
1.02 0.82 0.59
Family 5 0.29 0.26
0.22
0.13
0.06
Family 6 0.59 0.54 0.47 0.32 0.17
Family 7 3 01 2.77 2.46 1.80 1.14
Family 8 0.29 0.26 0.21 0.13 0.06
Total 8 54 8.47
7.78 5.95 3.89
aAdapted from Jabs et al (II).
was obtained (Table 1). A total LOD score of 8.54 at a recombination fraction
of 1% was obtained, suggesting that the disease locus maps very close to this
marker (II). Family 7 by itself has an LOD score of >3; the magnitude of the
resulting LOD score 1s affected by family size and informativeness of a given
marker. Markers with a heterozygosity of >.70 are generally used, this will
help increase the power of the study by making more pedigrees informative.
To search the entire genome, markers mapped at 10 CM intervals are often used,
resulting in genotyping approximately 350 markers. The density of markers
used in such a genome screen will depend on the mformatlveness of the mark-
ers, structure and number of families, and mode of inheritance for the disease,
If the two loci being studied are both genetic markers, the parametric link-
age analysis is straight forward, because the mode of inheritance of a genetic
marker is usually codominant and there is one-to-one relationship between
genotype and phenotype. The situation is similar for a simple Mendelian dis-
ease locus, because by definition, the disorder is controlled by a major locus
with known mode of inheritance, and it is safe to infer the genotype from the
phenotype. There may be rare cases of misdiagnosis, and it may be necessary
to estimate the degree of penetrance for unaffected family members. Linkage
analysis has been successfully applied to many Mendelian traits. The simplest
situation is when unequivocal linkage can be demonstrated in a single large
pedigree with LOD score >3, even though other families may show no linkage
(genetic heterogeneity). If linkage cannot be established on the basis of any
single pedigree or seen in the total sample of families, one can ask whether a
subset ofpedigrees collectively shows evidence of Imkage. Of course, one can-
16 Taylor et al.
not simply choose those families with positive LOD scores Such an expost
selection criteria will always produce a positive LOD score. However, families
can be selected on the basis of a priori considerations (for example, different
clmical presentations). The admixture test using the computer program
HOMOG can be used for genetic heterogeneity when the families are not
divided m groups based on other criteria, such as clinical differences (8). For
small families, it 1s difficult to estimate accurately the degree of heterogeneity
from this type of analysis.
2.2. Problems in Complex Disorders
Parametric lmkage analysis may not be useful for a complex disorder, mainly
because of the breakdown of the simple relationship between phenotype and
genotype, caused by the following*
1. Mrsdiagnosrs-the mrsdragnosed affected family members are not susceptrbrhty
gene carrters, whereas the misdiagnosed “unaffecteds” actually carry the suscep-
tibrhty gene,
2 Incomplete penetrance owmg to reduced penetrancwertain percent of the
unaffected famrly members are susceptibility gene carriers,
3 Phenocopy-indrviduals with the disorder are affected by some other mecha-
nism and do not have the susceptibility gene under study (possibly a different
gene);
4. Heterogeneity-some affected famthes have a genetic defect m another locus
and thus do not have the susceptibrhty gene under study; and
5 Ohgogemc inherrtancea disease phenotype is the result of several defectrve
genes, erther additrve or mteractrve.
Thus, in a given family, the phenotype “affected” may or may not be owmg
to the specific gene under study. It is necessary to relate an individual’s
genotype for the susceptibility gene from his or her phenotype for linkage stud-
ies. The breakdown m the relationship between phenotype and genotype
increases the difficulty of finding linkage using parametric linkage analysis
(6). These factors affect all methods of linkage analysis of complex disorders,
including allele-sharing methods, because they create uncertainty. However
the impact tends to be greater m parametric lmkage analysis where the results
are the outcome of two components, the correct specified model and lmkage.
As can be seen, the correct specified model is often difficult to determine for
complex disorders.
2.3. Strategies Used in the Analysis of Complex Disorders
Parametric linkage analysis for complex disorders, however, is by no means
useless. The understanding of these difficulties may help researchers to
overcome these problems, and there are several successful examples, such as
Linkage Analysis 17
early onset breast cancer (12). Several strategies can be considered m the para-
metric linkage analysis of complex disorders. Overestrmatmg the degree of
penetrance can lead to spurious evidence against linkage owing to individuals
who inherit a trait-causing allele, but are unaffected. “Affected only” paramet-
ric lmkage analysis is a common practice used to deal with the problem of
incomplete and age-dependent penetrance (6). This type of analysis might
decrease the effective number of meioses. However, it decreases the possible
impact of false recombinants from unaffected family members who are gene
carriers. In the case of an obscure phenotype where there may be a relatively
high rate of misdiagnosis, various alternative diagnostic schemes can be
applied. However, it is then necessary to adjust for the number of disease
models used when determming significance. Another approach is first to
study a related phenotype where information on a genetic model may be
available. An example of this is total serum IgE levels, a quantitative mea-
sure correlated with the presence of asthma (13). After obtaining evidence
for a major locus for IgE regulation mapping to 5q, linkage analysis with the
asthma phenotype was performed, resulting m evidence for linkage to this
same region (24).
Parametric lmkage analysis has also been successfully applied to disorders
with genetic heterogeneity. If available, a clinical variable, such as age of onset
or severity, can be used to subdivide a sample mto two groups of pedigrees.
Families can thus be selected on the basis of a priorz considerations. An
example of this approach is provided by the genetic mapping of a gene for
early onset breast cancer (BRCAl) to chromosome 17q. Families were added
to the linkage analysis in order of their average age of onset, resulting in an
LOD score that rose steadily to a peak of 6.0 with the inclusion of families with
onset before age 47 and then fell with addition of late onset pedigrees (22).
Notwithstanding these successes, many failed linkage studies may result from
the presence of a high degree of heterogeneity, It is usually wise to try to define
clinically a homogeneous set of families.
Although several simulation studies have suggested that in a disorder caused
by two genes, a single-locus approxrmation has high power to detect linkage
(15), a correctly specified two-locus model can sometime significantly increase
evidence for linkage. An example 1s the parametric linkage analysis between
the locus for IgE levels and markers on chromosome 5q. An LOD score of
3.0 for marker D5S436 was first reported using a one-locus recessive model
in a Dutch asthma family study. After a subsequent segregation analysis sug-
gesting that a two-locus recessive model fit the inheritance pattern signifi-
cantly better than one-locus recessive model, parametric linkage analysis
using the best two-locus model gave the LOD score of 4.6 for the same
marker (16).
18 Taylor et al.
2.4. Multipoin t Mapping
It is possible to combine information from several markers to increase the
mformativeness of the famtlies. Families that are not informative for a spe-
cific marker may be informative for the flanking markers. This method can
be used to pinpoint the most likely map location for the disease gene. In
Table 2, the multipoint analysis shows that the most likely location for
BRCAl is close to D17874. As described previously, families with a young
age of onset showed the strongest evidence for linkage. Multipomt analysis
is sensitive to errors m genotyping and phenotyping, and care must be taken
to ensure data integrity. Linkage disequilibrium (a deviation of random
occurrences of specific alleles in haplotypes) studies can then be used to
refine further the location of the disease gene (81. This approach is especially
effective if the families come from an isolated population, thus increasing
the possibility of a founder effect.
2.5. Cautions
Misspectficatton of marker allele frequencies can cause false positive link-
age results, especially m families where many parents are untyped. This is
because underestimation of allele frequencies may lead to spurious lmkage
mformation. For example, if cousms share a “rare” allele, this suggests the
presence of linkage. However, if the grandparents are deceased, they may
have been homozygous for the allele in question and the cousins actually
inherited different copies of the allele. Thus, it is important to consider the
allele frequencies from both population data and the study sample. The other
problem is multiple tests, mainly owmg to the uncertainty of modes of inherit-
ance. This will inflate the type I error (i.e., false positive) and make LOD score
results difficult to interpret (6). Two approaches are very useful in these cases.
First is a computer simulation method where marker data with no linkage can
be simulated using the same pedigree information (availability of typed per-
sons) and the same characteristics of the marker (heterozygosity) where the
highest LOD score was observed (6). Then, the simulated data is analyzed using
the same approaches (number of models tested) that were used in the actual
analysis. An empirical significance level is then obtained. The other approach
is to adjust the significance level by the number of models tested (3 +
log[number of models tested]) (8). It is difficult to determine the exact cut
point for significance in complex disorders. On the one hand, it is important to
type additional markers in any region with a suggestion of linkage, especially
m regions with known candidate genes. On the other hand, it is important to
realize that this may be a false-positive result. Replications between studies are
very important (17).
Table 2
LOD Scores Based on Multipoint Analysis of Families with Breast Cancer Grouped by Age of Onseta
Map distancesb
D17S78
D17S41 D17S74
Famhes
;3;
0.00
0.02 0.04 0.06 0.08
0.10 0.12
0.14 0.16 0.184
0.208
145 2.83 3.09 3.30
3.47 3.57 3 41 4.46
4
60 5.24
5.41 5.24
46-5 1 Xl.30 -0.07 0.01
0.03 -0.05 -0.20 -1.58
-2.71 -9 14 -5.61 -4.24
>51 -6.70 -5.80
-5.51 -5.52 -5.89 6.98
4 60
-7
94 -15 21 -8 94 -6.79
“Adapted from Hall et al (12)
bAppropnate map locations. There IS 10% recombmatlon between D 17878 and D 17S4 1, and 6%, between D 17S4 1 and D 17874
20 Taylor et al.
3. Nonparametric (Allele-Sharing) Methods
3.1. Definition
Unlike parametric lmkage analysis which depends on assummg a genetic
model, allele-sharmg methods are not based on a specific disease model.
One simply tests whether the inheritance pattern of markers for a chromosome
region is consistent with random Mendelian segregation If there is a linkage
between a locus for a trait and a chromosomal region, for a qualitative trait,
affected relative pans should share alleles identical by descent (IBD), that is,
inherited from a common ancestor within the pedigree, more often than
expected under Mendehan inheritance and independent assortment. For a quan-
titative trait, relative pairs should show a correlation between the magnitude of
then phenotypic difference and the number of alleles shared IBD. Sib-pan
methods are the simplest and most commonly used allele-sharing methods (IS).
3.2. Qualitative Trait: Affected Sib-Pair Analysis
Considering the possible problems in complex disorders, espectally incom-
plete and age-dependent penetrance and misdiagnosis, many researchers focus
on affected sib-pair methods, although the theories also apply to unaffected
sib-pairs. Under the hypothesis of no linkage between a disease predisposing
locus and a marker, affected sib-pans sharing of marker alleles IBD will be
independent from their phenotype, and follow Mendehan expectation of shar-
ing IBD 0, 1, and 2, with the frequencies of 0.25. 0.5, and 0.25. This distribu-
tion of sharing marker allele IBD can also be expressed as a mean number of
alleles IBD = OS[ l(O.5) + 2(0.25)]/2. If, however, there is linkage between the
disease predisposmg locus and a marker, the Mendelian expectation of sharing
marker allele IBD will deviate from the above distributions Several statistical
methods have been proposed to test this deviance. One of most powerful meth-
ods is a mean test, which tests whether the mean number of a marker allele IBD
is significantly different from 0.5 (19). Table 3 shows sib-pair analysts based
on the mean test for bipolar disorder and markers located on chromosome 18
(20). Increased sharing (>0.5) was observed for several markers, although most
were not highly significant.
Another newly developed affected sib-pair method is the likelihood method
(2,21), where a LOD score is calculated from the ratio of two likelihoods.
the likelihood of observed marker allele IBD of affected sib pairs and the
likelihood of sharing IBD under the null hypothesis of no linkage, that is, Men-
delian expectation.
Affected sib-pair allele-sharing methods can also be used to investigate pos-
sible parental origin effect for the disorders. One can look at affected sib-pairs
sharing paternal and maternal alleles IBD separately. This may be useful in the
Linkage Analysis
21
Table 3
Results of Affected Sib-Pair Analyses
for Bipolar Disorder
and Chromosome 18 Marker9
Marker
# Pairs Mean r) valueb
DlSS59 109 0.50
D18S54 61 0 50
D18S62 86 0 50
D18S843 91 051
D18S464 68
0 55 0.05
Dl8S53
112 0.56 0 02
D18S71 96 0.49
D18837 46 0.64 0.001
D18S48
56 0.53
0.09
D18S40 84 0 57 0.02
D18S45 45 0 52
“Adapted from Stme et al (20)
bAll
p values <O 1 are reported
presence of imprinting or mitochondrial inheritance. For example, in bipolar
disorder, there is evidence for linkage to chromosome 18 and excess sharing is
especially pronounced m paternally transmitted alleles @ = 0.004) (20).
3.3. Quantitative Trait
The basis for the allele-sharing method for a quantitative trait is straightfor-
ward: siblings that share more alleles at a locus IBD should be more similar
in phenotypic measurement than siblings that share fewer alleles. Thus, the
squared difference of phenotype values between sibs can be regressed on
the sharing of marker alleles IBD (18). There is evidence for linkage if the
regression coefficient is sigmficantly negative (i.e., sibs with a small differ-
ence tend to share two alleles).
An example of this method is the sib-pair analysis for total IgE levels in the
Dutch asthma family study. Significant negative regression coefficients were
found for several markers on 5q (5). As previously described, positive LOD
scores were obtained for these same markers using the genetic model obtained
from the segregation analysis.
3.4. Multipoint Sib-Pair Analysis
Most allele-sharing methods are primarily based on studying genetic
markers one at a time. Such analyses may be inadequate, since the exact IBD
status cannot always
be inferred at the marker loci (for example, if parents
22
Taylor et a/.
were not genotyped). Kruglyak and Lander (22) proposed a method of
complete multipoint analysis using the information from all genetic markers
to infer the full probability distribution of the IBD status at each point along
the chromosome.
3.5. Advantages and Limitations
Allele-sharing methods are nonparametric linkage analyses, that is, they
require no prior assumptions about such parameters as mode of inheritance,
penetrance, phenocopy rate, and disease allele frequency. In this sense, they
are more robust than parametric methods because we are not dependent on as
many potential erroneous model assumptions. Moreover, the problem of trying
multiple models and correcting for inflation of the LOD score (as is often
required in such cases) is avoided in these approaches, although one must still
correct for multiple diagnostic schemes. The trade-off is that allele-sharing
methods are often less powerful than a correctly specified linkage model (6,.
Sib-pairs methods are important tools for linkage studies of complex
disorders, and are often used for genome screens. In addition to the advantages
described above, sib-pairs are relatively easy to ascertain in large numbers,
and tend to be more closely matched for age and environment than other
relative pairs.
It would, however, be incorrect to conclude that the genetic model of the
disease is irrelevant. The fact that a model is not required in the analysis only
implies that the model cannot be misspecified. Thus, false negative or false
positive findings will not be owing to the use of an incorrect model. Instead,
the mode of inheritance of the disease influences the power of allele-sharing
methods directly. Determining the model of inheritance for major genes for
susceptibility to a complex disorder may provide useful information on under-
standing the pathophysiology of the disorder. Once evidence for linkage is
obtained, more complex modeling, such as two and three locus or MOD (chang-
ing the model to maximize the LOD score) score analysis (23), may provide
further insight into disease mechanisms.
4. Summary
Basic principles and methods of genetic analysis were covered in this chapter.
The approaches of linkage analysis for Mendelian or complex disorders can be
summarized in the following flowchart (Fig. 2). It is important that the clinical,
analytical, and molecular investigators be involved in all steps in the process.
Mapping genes for complex disorders is often more difficult than mapping genes
for Mendelian disorders, but both may prove to be very important in understand-
ing disease processes and designing new treatments. Practical use of computer
programs available for genetic analysis is detailed elsewhere (24).
Linkage Analysis
Question
Is there Mendelian
inheritance or familial
aggregation ?
For complex disorders,
is there a major gene 7 Is
it dominant or recessive ?
Where is this major gene
in the human genome ?
Is there a linkage with
DNA markers under a
specific genetic model ?
Is there an increased
allele sharing for affected
relatives (sib pairs) or for
relatives with similar
phenotype ?
Analysis repeated after
typing additional makers
in region to narrow the
region of interest
23
Study Design
Family Clinical Study
Segregation Study
1
Linkage Analysis
A. Parametric Approach
B. Allele-Sharing Approach
(sib-pair analyses)
1
Multipoint and Fine mapping
Fig. 2. Flowchart of linkage analysis.
References
1. Khoury, M. J., Beaty, T. H., and Cohen, H. B. (1993) Fundamentals of Genetic
Epidemiology. Oxford University Press, New York.
2. Risch, N. (1990) Linkage strategies for genetically complex traits. II. The power
of affected relative pairs. Am. J. Hum. Genet. 46,229-241.
24 Taylor et al.
3. Kendler, K. S , Neale, M. C , Kessler, R C , Heath, A , and Eaves, L J (1993) A
longrtudmal twin study of l-year prevalence of major depression m women Arch
Gen Psychzatry 50,843-852
4 S A.G E. (1994) Statistical Analysts for Genetic Epidemiology, Release 2 2. Com-
puter program package available from the Department of Biometry and Genetics,
LSU Medical Center, New Orleans, LA
5. Meyers, D. A., Postma, D. S , Panhuysen, C I. M., Xu, J , Amelung, P J., Levitt,
R C , and Bleecker, E R (1994) Evrdence for a locus regulating total serum IgE
levels mapping to chromosome 5 Genomics 23,464-470
6. Lander, E. S and Schork, N. J (1994) Genetic dissection of complex traits
Science 265,2037-2048.
7. Elston, R. C. (1981) Segregation analysis Adv. Human Genet. 11,63-120.
8. Ott, J. (1992) Analyszs of Human Genetzc Linkage. Johns Hopkins University
Press, Baltimore, MD
9 Lathrop, G. M., Lalouel, J. M., Julier, C , and Ott, J. (1984) Strategies for
multilocus lmkage analysis m humans. Proc. Nat1 Acad. SCI. USA 81,3443-3446
10 Morton, N. E. (1955) Sequential tests for the detection of linkage. Am J, Hum
Genet 7,277-3 18
11. Jabs, E. W., Lr, X., Coss, C A , Taylor, E W., Meyers, D A , and Weber, J. L.
(1991) Mappmg the Treacher Collins Syndrome Locus to 5q3 1.3-q33.3 Genomzcs
11,193-198
12. Hall, J M , Lee, M. K., Newman, B., Morrow, J. E., Anderson, L A , Huey, B ,
and King, M C (1990) Lmkage of early-onset familial breast cancer to chromo-
some 17q2 1. Sczence 250(4988), 1684-1689
13. Sears, M., Burrows, B., Flannery, E M , Herbison, G P., Hewitt, C. J , and
Holdaway, M. D (1991) Relation between airway responsiveness and serum IgE
m children with asthma and in apparently normal children N Engl J Med 325,
1967-1971.
14. Panhuysen, C. I M., Levitt, R. C , Postma, D S., Xu, J., Amelung, P. J , Holroyd,
K. J., Altena, R. V., Koeter, G. H., Meyers, D. A., and Bleecker, E R (1995)
Evidence for a susceptibility locus for asthma mapping to chromosome 5q
J Invest Med. 43(Suppl.), 281A.
15. Greenberg, D. A. and Hodge, S. E. (1989) Lmkage analysts under “random” and
“genetic” reduced penetrance. Genet. Epldemlol. 6,259-264.
16. Xu, J., Levitt, R. C , Panhuysen, C. I. M , Postma, D. S., Taylor, E. W.,
Amelung, P .J , Holroyd, K J , Bleecker, E. R., and Meyers, D A (1995)
Evidence for two unlmked loci regulating total serum IgE levels Am J Hum
Genet 57,425+30.
17. Thomson, G. (1994) Identifying complex drsease genes: progress and paradigms.
Nature Genet 8, 108-l 10
18. Haseman, J. K. and Elston, R. C. (1972) The investrgatron of lmkage between a
quantitative trait and a marker locus. Behav. Genet. 2,3-19.
19. Blackwelder, W. C. and Elston, R C. (1985) A comparison of sib-pan lmkage
tests for disease susceptibility loci. Genet Epldemlol 2, 85-97.
Linkage Analysis 25
20 Stme, 0 C , Xu, J. F., Koskela, R., McMahon, F J , Gschwend, M., Frtddle, C.,
Clark, C. D., McInms, M. G., Sampson, S. G., Breschel, T. S., Vishto, E., Riskin,
K., Feilotter, H., Chen, E., Shen, S , Folstein, S , Meyers, D. A , Botstem, D.,
Marr, T. G., and DePaulo, J. R. (1995) Evidence for linkage of bipolar disorder to
chromosome 18 with a parent-of-ongm effect. Am. J Hum Genet 57, 1384-1394.
21 Holman, P (1993) Asymptotic properties of affected-sib-pair linkage analysis
Am J Hum Genet 52,519-527.
22. Kruglyak, L. and Lander, E. S. (1995) Complete multipoint sib-pax analysis of
quahtattve and quantitative traits. Am J, Hum Genet 57, 439-454
23. Hodge, S E. and Elston, E R. (1994) Lods, Wrods and Mods: the interpretation
of lod scores calculated under different models Genet Epldemiol. 11,32%342
24. Terwtlhger, J. D. and Ott, J. (1994) Handbook of Human Genetzc Lznkuge. Johns
Hopkins Umverstty Press, Baltimore, MD.