hematopoietic stem cell protocols
Bạn đang xem bản rút gọn của tài liệu. Xem và tải ngay bản đầy đủ của tài liệu tại đây (2.43 MB, 318 trang )
Humana Press
Hematopoietic
Stem Cell
Protocols
Edited by
Christopher A. Klug
Craig T. Jordan
Humana Press
M E T H O D S I N M O L E C U L A R M E D I C I N E
TM
Hematopoietic
Stem Cell
Protocols
Edited by
Christopher A. Klug
Craig T. Jordan
AGM and Yolk Sac HSC 1
1
From: Methods in Molecular Medicine, vol. 63: Hematopoietic Stem Cell Protocols
Edited by: C. A. Klug and C. T. Jordan © Humana Press Inc., Totowa, NJ
1
Isolation and Analysis of Hematopoietic Stem Cells
from Mouse Embryos
Elaine Dzierzak and Marella de Bruijn
1. Introduction
Recently, there has been much interest in the embryonic origins of the adult
hematopoietic system in mammals (1). The controversy surrounding the
potency and function of hematopoietic cells produced by the yolk sac com-
pared to those produced by the intrabody portion of the mouse embryo has
prompted much new research in the field of developmental hematopoiesis
(2–8). While the yolk sac is the first tissue in the mammalian conceptus to
visibly exhibit hematopoietic cells, the intrabody region—which at different
stages of development includes the splanchnopleural mesoderm, para-aortic
splanchnopleura (PAS) and the aorta-gonad-mesonephros (AGM) region—
clearly contains more potent undifferentiated hematopoietic progenitors and
stem cells before the yolk sac. Furthermore, the most interesting dichotomy
revealed by these studies is that terminally differentiated hematopoietic cells
can be produced in the mouse embryo before the appearance of cells with adult
repopulating capacity. Thus, the accepted view of the adult hematopoietic hier-
archy with the hematopoietic stem cell (HSC) at its foundation does not reflect
the hematopoietic hierarchy in the developing mouse embryo (9). Because this
field offers many questions concerning the types of hematopoietic cells present
in the embryo, the lineage relationships between these cells, and the molecular
programs necessary for the development of the embryonic and adult hemato-
poietic systems, this section presents the approaches taken and the materials
and methods necessary to explore the mouse embryo for the presence of the
first adult repopulating HSCs.
2 Dzierzak and de Bruijn
2. Materials
2.1. Isolation and Dissection of Embryonic Tissues
1. Dissection needles: sharpened tungsten wire of 0.375-mm diameter (Agar Scien-
tific Ltd.) attached to metal holders typically used for bacterial culture inocula-
tion.
2. Dissection microscope: any suitable dissection microscope with magnification
range from ×7–40 with a black background stage and cold light source.
3. Culture plates: 60 × 15 mm plastic tissue culture dishes.
4. Medium: phosphate-buffered saline (PBS) with 10% fetal calf serum (FCS), peni-
cillin (100 U/mL) and streptomycin (100 µg/mL).
2.2. Organ Explant Culture
1. Millipore 0.65 µm DV Durapore membrane filters: Before use, filters are washed
and sterilized in several changes of boiling tissue-culture water (Sigma, cat. #W-
3500) and dried in a tissue-culture hood.
2. Stainless-steel mesh supports: Supports were custom-made in our workshop by
bending a 22 mm × 12 mm rectangular piece of stainless-steel wire mesh so that
it stands 5 mm high with a 12 mm × 12 mm supportive platform. Supports are
washed in nitric acid (HNO
3)
for 2–24 h, then rinsed five times in sterile milliQ
water. Subsequently, they are sterilized in 70% ethanol and rinsed two times in
tissue-culture water (Sigma). Then, the supports are dried in a tissue-culture hood.
3. 6-Well tissue culture plates.
4. Curved fine point forceps.
5. Medium: Myeloid long-term culture (LTC) media (M5300, StemCell Technolo-
gies). Supplemented with hydrocortisone succinate (Sigma), 10
–5
M final con-
centration.
6. Scalpel blade.
2.3.1. Preparation of a Single-Cell Suspension from Dissected
Embryonic Tissues
1. Collagenase Type I (Sigma): Make a 2.5% stock solution in PBS and freeze
aliquots at –20
o
C. For use, make a 1:20 dilution of stock collagenase in PBS-10%
FCS-Pen-Strep. One mL of 0.12% collagenase will disperse approx 10 embry-
onic tissues when incubated at 37
o
C for 1 h.
2.4.1. PREPARATION AND STAINING OF SINGLE-CELL SUSPENSION
1. Propidium iodide (Sigma).
2. Heat-inactivated FCS.
3. Hematopoietic-specific antibodies, available from sources such as Pharmingen.
AGM and Yolk Sac HSC 3
2.5.1. Colony-Forming Unit-Spleen (CFU-S) Assay
1. Tellyesniczky’s solution: for 100 mL, mix 90 mL of 70% ethanol, 5 mL of gla-
cial acetic acid, and 5 mL of 37% formaldehyde (100% formalin).
2.5.2.1. PERIPHERAL BLOOD DNA PREPARATION AND PCR ANALYSIS
1. Blood Mix: 0.05 M Tris-HCl pH 7.8, 0.1 M EDTA, 0.1 M NaCl, 1% SDS, 0.3 mg/
mL Proteinase K.
2. RNase A: 10 mg/mL stock solution.
3. Phenol-Chloroform-Isoamyl alcohol.
4. 2 M sodium acetate (pH 5.6).
5. Isopropanol.
6. 70% ethanol.
7. LacZ PCR primers: lacz1 5’GCGACTTCCAGTTCAACATC3'
lacz2 5’GATGAGTTTGGACAAACCAC3'
8. YMT2 PCR primers: ymt1 5’CTGGAGCTCTACAGTGATGA3'
ymt2 5’CAGTTACCAATCAACACATCAC3'
9. Myogenin PCR primers: myo1 5’TTACGTCCATCGTGGACAGC3'
myo2 5’TGGGCTGGGTGTTAGTCTTA3'
10. Deoxynucleotide 5' triphosphate (dNTP) mix: stock solution of 10 mM each of
deoxyadenosine 5' triphosphate (dATP), deoxythymidine 5' triphosphate (dTTP),
deoxyguanosine 5' triphosphate (dGTP), deoxycytidine 5' triphosphate (dCTP).
11. PCR (10X) mix: 100 mM Tris-HCl, pH 9.0, 15 mM MgCl
2
, 500 mM KCl, 1%
Triton-X-100, 0.1% w/v stabilizer.
12. Taq polymerase.
2.5.2.2. MULTILINEAGE ANALYSIS
1. Complete medium: RPMI-1640, 5% FCS, 2 mM L-glutamine, 10 mM HEPES,
100 U/mL penicillin, 100 µg/mL streptomycin, and 100 µM 2-mercaptoethanol.
2. Lipopolysaccharide (Sigma).
3. Murine interleukin 2 (IL-2)(Biosource)
4. Concanavalin A (Sigma).
5. L-cell conditioned medium.
6. Lineage-specific antibodies are routinely used (available from sources such as
Pharmingen).
3. Methods
3.1. Isolation and Dissection of Embryonic Tissues
1. To obtain embryonic tissues for the analysis of HSCs and progenitors, adult male
mice are mated with two females in the late afternoon. Females are checked for
the presence of a vaginal plug the following morning. If a plug is found, this is
considered embryonic d 0 (E0) (see Note 1).
4 Dzierzak and de Bruijn
2. Pregnant females at the chosen day of gestation are sacrificed, and uteri removed
into a 60 × 15 mm tissue-culture dish containing PBS-FCS (PBS with 10% FCS,
penicillin 100 U/mL and streptomycin 100 µg/mL).
3. Using a dissection microscope (×7–8 magnification) and fine forceps or scissors,
remove the muscular wall of uterus from the individual decidua. Then with small
grasps of the forceps, remove Reichert’s membrane, which is the thin tissue layer
surrounding the yolk sac (13). During these manipulations, the embryos are trans-
ferred to other culture dishes containing PBS-FCS to wash away maternal blood
contamination.
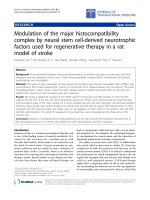
Fig. 1. Schematic diagram of the dissection procedure on an E10/E11 mouse em-
bryo. Dark broken lines show the regions in which a series of cuts are performed on
the mouse embryo. (A) The yolk sac (YS) is removed by cutting the vitelline artery
(VA) and umbilical artery (UA) the site where they join the yolk sac. A second cut
adjacent to the embryo body frees the arteries. (B) The dissection needles cut the head
and tail regions from the trunk of the embryo which contains the AGM and liver (L).
(C) The internal organs (gastrointestinal tract, heart, and liver) are dissected away
first, and then the dorsal tissues (the neural tube and somites) are removed. (D) After
turning the remaining trunkal region of the embryo so that the ventral side is facing
upwards, the dissection needles are inserted under the AGM region, and the remaining
somitic tissue is dissected away.
AGM and Yolk Sac HSC 5
4. The yolk sac is isolated by grasping with the fine-tipped forceps and tearing open
this tissue which surrounds the embryo. The yolk sac is torn off at the blood
vessels (vitelline and umbilical vessels) which connect it to the embryo proper
(Fig. 1A). The embryo is now covered only by a very thin amnionic sac that may
have been broken during the dissection. The vitelline and umbilical arteries may
now be obtained with fine scissors by cutting them off at the connection to the
embryo body proper (for staging of embryos, see Note 2).
5. For the dissection of fetal liver and the AGM region from the embryo proper, we
switch to the use of dissection needles and a slightly higher magnification. Dis-
section needles are made from small pieces of sharpened tungsten wire attached
to metal holders, which are typically used for bacterial culture inoculation. A
sharpening stone, normally used to sharpen knives, is used to produce a fine point
at the tip of the tungsten wire. One needle is generally used to hold the embryo in
the area where cutting is desired. The other needle is slowly moved alongside the
holding needle in a cutting action. Only small precise areas are dissected with
each needle placement.
6. Briefly, to dissect an E10/E11 embryo as it is lying on its side, the dissection
needles are used to cut the trunk of the embryo from the tail and head (see Fig.
1B). The needles are then used to remove the lung buds, heart, liver and gas-
trointestinal (GI) tract from the embryo. The liver can then be dissected cleanly
from the heart, GI tract, and remaining connective tissue (Fig. 1C).
7. Next the somites and neural tube, running along the dorsal side of the embryo,
are removed with care to maintain the integrity of the dorsal aorta (Fig. 1C). The
trunk of the embryo is now adjusted so the ventral side is facing upwards. The
AGM region is now clearly visible. The remaining somites can be cut away by
inserting the needles under the AGM (Fig. 1D).
3.2. Organ Explant Culture
An organ explant culture has been developed to examine the growth of
colony-forming units-spleen (CFU-S) and long-term repopulating hematopoi-
etic stem cells (LTR-HSC) in individual embryonic tissues (5). Beginning at
E8.5 (9 somite-pair stage), the circulation between the mouse embryo body
and the yolk sac is established (6). Thus, in vitro culture of explanted tissues
allows for the analysis of these tissues in an isolated manner, preventing cellu-
lar exchange. The culture method was optimized for the maintenance/produc-
tion of CFU-S and LTR-HSC by placing the dissected tissues at the air/medium
interface in the culture rather than submerging them in medium. No exogenous
hematopoietic growth factors are added; thus the CFU-S and HSC rely only on
the endogenous signals provided by the embryonic tissue.
3.2.1. Culture Procedure
1. One wire mesh support is placed into each well of a 6-well culture plate, and the
wells are filled with 5 mL of medium.
6 Dzierzak and de Bruijn
2. With forceps, a filter is placed onto the mesh support and allowed to become
permeated with medium. The medium level should be adjusted so that the filter is
at the air-medium interface.
3. Individual dissected embryonic tissues are placed on the filters, using curved
forceps. Up to six individual tissues can be cultured per filter. Empty wells of the
culture plate are filled with PBS or sterile water (to maintain humidity), and the
culture plate is carefully placed in a 37
o
, 5% CO
2
incubator. Tissue explants are
cultured for 2–3 d.
3.2.2. Harvest of Cultured Tissues
1. Using forceps and gloved hands, the filter holding explanted tissues is removed
from the culture plate. The filter is held in one hand, while a scalpel blade is used
to scrape each tissue individually from the surface of the filter.
3.3. Transplantation of Embryonic Hematopoietic Cells
into Adult Recipients
In vivo transplantation assays have long been established for the purpose of
examining cell populations for the presence of HSCs or progenitors (16). In
measuring the hematopoietic capacity of embryonic tissues, we have used both
the short-term CFU-S assay (3,5,17) and the LTR-HSC assay (5,10,11). While
the frequency of CFU-S and LTR-HSCs is a useful measurement for adult
bone-marrow populations, since these cells are in limited numbers within an
individual embryo, pools of embryo-derived cells are typically used in trans-
plantation assays. Thus, after staging mouse embryos from the available litters
by counting somite pairs, only embryos within a desired developmental win-
dow are used (for example, from late E10, we would pool embryos of 36–40
somite pairs [sp]). The embryos are dissected and a single-cell suspension is
prepared from the pooled tissues, noting the number of tissue embryo equiva-
lents. It is thus possible to determine the absolute numbers of CFU-S and re-
populating units in an individual embryo within a temporal context at the
earliest stages of development.
3.3.1. Cell Preparation
1. Collagenase treatment is performed to obtain a single-cell suspension from dis-
sected embryonic tissues or from explant cultures of embryonic tissues. Tissues
are placed into 1.0 mL of 0.12% collagenase in PBS-FCS-Pen-Strep and incu-
bated at 37
o
C for 1 h. During the incubation, the tube is occasionally tapped to
aid the dispersion of the tissue.
2. After incubation, the tube is placed on ice. Five mL of PBS-10% FCS is added to
the cells and using a blunt-ended pipet held against the bottom of the test tube,
the tissue suspension is pipetted back and forth up to 20 times to disperse the
cells. Cells are centrifuged at 250g and washed two times.
AGM and Yolk Sac HSC 7
3. Viable cell counts are performed using Trypan blue dye exclusion. After collage-
nase treatment, it is expected that only approx 50–75% of the embryonic cells
will be viable. Table 1 provides a summary of the expected number of viable
cells that can be obtained from the PAS/AGM and yolk sac from E9, E10, and
E11 embryos after collagenase treatment.
4. For immediate in vivo injection, the desired number of cells or known embryo
equivalents of cells are suspended in PBS (0.2 mL–0.5 mL per recipient). If some
time will elapse before injection, cells are suspended in PBS with 10% FCS, and
later washed and resuspended in PBS alone. All cell suspensions are kept on ice.
5. To promote the survival of the irradiated recipient mice so that the engraftment
properties of hematopoietic cells from embryonic tissues can be measured, we
typically cotransplant a small number of normal unmarked (recipient-type) adult
spleen cells (2×10
5
) into each recipient along with the marked test cells (10,11).
These cells are included in the volume (0.2–0.5 mL) to be injected intravenously
into the lateral tail vein. Also, competitive transplantation strategies with un-
marked HSCs (18) can be used to test for the quality of the donor-marked he-
matopoietic cells.
3.3.2. Transplantation Protocol
Male or female (nontransgenic) 2–3-mo-old mice can be used as recipients
for donor embryonic cells in CFU-S or LTR-HSC assays. When using the Y
chromosome as the genetic marker for donor embryonic cells, female recipi-
ents of the same strain are required. As in all transplantation protocols, the use
of a transgene marker in donor embryonic cells requires the use of either male
or female nontransgenic recipients of the same strain as the donor transgenic.
We have used inbred strains (C57BL/6, C57BL/10) and F1 strain combina-
tions ([CBA × C57BL/10]F1, [129 × C57BL/6]F1) as recipients in our trans-
plantation experiments.
1. The mice designated for transplantation experiments are housed in filter-top
microisolator cages which eliminate the possibility of viral infection within the
colony. Before transplantation, recipients are maintained on 0.037% HCl water
(3.7% stock diluted 1:100) for at least 2 wk.
Table 1
Number of Viable Cells Obtained from Mouse Embryonic Tissues after
Collagenase Treatment
Embryonic Somite
Cell number (× 10
4
) per tissue
day pairs PAS/AGM Yolk sac
E9 20–29 8.4 +/– 3.8 12.5 +/– 4.8
E10 30–39 12.0 +/–3.5 20.1 +/– 6.9
E11 >40 21.2 +/– 6.2 47.1 +/– 3.8
8 Dzierzak and de Bruijn
2. On the day of transplantation, recipients are irradiated with a split dose of 9 gy
for LTR-HSC and 10 gy for CFU-S from a gamma radiation source. The first
dose of 4.5–5 gy is given 3 h before the second dose of 4.5–5 gy. The dose of
irradiation should be tested within each facility, because variation in the lethal
dose of gamma sources and in the strains of mice have been observed.
3. Prior to injection, adult mice are warmed briefly under a heating lamp to dilate
the blood vessels and restrained in a holder through which the tail can be threaded.
The tail is cleaned with 70% ethanol to make visible the veins lateral to the dor-
sal-lateral tail artery.
4. Injection of 0.2–0.5 mL (per recipient) into the lateral tail vein is performed us-
ing a 1-mL tuberculin syringe and 25–26-gauge needle. Thereafter, mice are
maintained on antibiotic water containing 0.16% neomycin sulfate (Sigma) for at
least 4 wk.
3.4. Flow Cytometric Analysis/Sorting of Cells from
Embryonic Tissues
The cell-surface marker characterization of functional HSCs and the pro-
genitors within the developing mouse conceptus pose special problems in iso-
lation, viability, and analysis. As discussed in previous sections, the numbers
of cells isolated from the hematopoietic tissues of early-stage embryos are lim-
ited. For phenotypic analysis only, without any functional transplantation, only
a few embryos are required. However, several litters of embryos must be iso-
lated and dissected on the same day when functional cells are to be sorted
fluorescence-activated cell-sorting (FACS). For example, a good cell-sorting
experiment using two different antibodies for the isolation of cells to be trans-
planted in limiting dilution into adult recipients requires approx 20–40 AGM
regions from marked E11 embryos (11). Studies such as these require team-
work, allowing the rapid dissection of embryos by several researchers simulta-
neously.
3.4.1. Preparation, and Staining of Single-Cell Suspension
1. Embryonic tissues are collagenase-treated as described in subheading 3.3.1,
steps 1–3. After washing, the cells are suspended in PBS with 10% heat-inacti-
vated FCS.
2. Incubation with CD16/CD32 (2.4G2) monoclonal antibody (MAb) (anti-FcRII
and III, Pharmingen) is performed for 20 min on ice to lower nonspecific staining.
3. This is followed by incubation with antibodies of interest (for example, CD34-
biotin and c-kit-Fluorescein-5 isothiocyanate (FITC), Pharmingen) for 20–30 min
on ice. Cells are then washed twice in PBS with 10% FCS and Pen-Strep and
subsequently incubated with fluorochrome-conjugated streptavidin when
required.
AGM and Yolk Sac HSC 9
4. Again, labeled cells are washed twice and filtered through a 40-µm nylon mesh
screen (Falcon) to remove cell clumps. After washing, cells are resuspended in
PBS with 10% FCS containing 0.5 µg/mL propidium iodide (PI, Sigma) (11).
3.4.2. Sorting
1. Viable cells are defined by exclusion of PI-positive and high obtuse scatter or
low forward scatter on a FACStar Plus or Vantage cell sorter (Becton-Dickinson)
or any other appropriate cell sorter. Fig. 2 shows forward-scatter and side-scatter
FACScan plots of AGM, fetal liver and yolk sac cells from E11 embryos. Vary-
ing distributions of the cells from each of these tissues on the basis of size and
granularity are observed after gating out dead cells (PI positive) and debris.
2. Collection gates for marker-positive cells are set by comparison to cells stained
with fluorochrome-conjugated immunoglobin isotype controls (11). Viable fluo-
rescent positive cells are collected and reanalyzed for purity and counted.
3. For functional transplantation assays, sorted cells are suspended in PBS at the
desired cell number or embryo equivalent for injection as described in Subhead-
ing 3.3.1., step 4. We have obtained the best results on cells transplanted as soon
as possible after the sorting procedure (this is about 8 h after starting the dissec-
tion of the embryos).
3.5. Analysis of Transplanted Adult Mice
3.5.1. CFU-S Assay
1. To determine the CFU-S
11
content of embryonic tissues, tissues are collagenase-
treated as described in Subheading 3.3.1., step 1 and cells are injected into the
tail vein of lethally irradiated (10 gy) mice (3,5,17). Control irradiated mice that
do not receive cells should be included in each experiment, to check for residual
endogenous spleen-colony formation.
Fig. 2. FACScan plots for forward-scatter and side-scatter of AGM, yolk sac, and
fetal liver cells from E11 mouse embryos. Debris and dead cells (based on PI staining)
are gated out. The number of cells analyzed per sample is 1.5 × 10
4
.
10 Dzierzak and de Bruijn
2. Eleven days after transfer, the spleens are excised and fixed in Tellyesniczky’s
solution, and the macroscopic surface colonies are counted. Up to 10–12 colo-
nies per spleen can easily be counted. Thus, the cell dose chosen for injection
should be determined to ensure that no more than this number is obtained per
spleen. A typical dose of cells for injection is in the range of 2–4 embryo equiva-
lents (4–8 × 10
5
) of E11 AGM cells per recipient adult mouse.
3. To exclude contribution in CFU-S activity by either maternally derived cells or
residual endogenous CFU-S, genetically marked donor cells can be used to check
for the origin of the CFU-S (see Note 3).
4. After isolation of spleens from the recipient mice, the tissue is not fixed, but
placed in PBS in a small tissue-culture plate. Individual spleen colonies are dis-
sected using cataract scissors under a dissection microscope (3). DNA is isolated
from each individual colony, and a donor-marker-specific polymerase chain re-
action (PCR) is performed to determine the genetic origin of the colonies.
3.5.2. LTR-HSC Assay
To test for long-term hematopoietic repopulation in the transplanted ani-
mals, the peripheral blood of recipients is analyzed two times for the presence
of donor-derived cells: once at 1–2 mo posttransplantation as a preliminary
screening for engraftment, and once at 4–6 mo posttransplantation for true
HSC-derived contribution (19). To assay for multilineage reconstitution, do-
nor-positive mice are sacrificed 4–6 mo posttransplantation, hematopoietic or-
gans are taken, and donor contribution to the various hematopoietic lineages is
determined as described in Subheading 3.5.2.1., steps 1–6.
3.5.2.1. PERIPHERAL BLOOD DNA PREPARATION AND PCR ANALYSIS
1. Peripheral blood (100–200 µL) is collected from the retro-orbital plexus or via
the tail vein from recipient mice (in the absence of any anticoagulants) and placed
directly into an eppendorf tube containing 500 mL of “blood mix.” Samples are
shaken and placed in a 55
o
C water bath for 4–24 h.
2. After a quick spin in the microfuge to remove any of the sample condensed on
the top of the Eppendorf tube, 20 µL of RNase A (10 µg/mL) is added, and the
sample is incubated in a 37
o
C water bath for 1 h.
3. This is followed by phenol-chloroform extraction (500 µL) in an Eppendorf
shaker for 15 min. After a 15 min spin in a microfuge at 16,000g, the aqueous
phase (550 µL) is transferred to a clean Eppendorf tube and DNA is precipitated
after addition of 50 µL of 2 M sodium acetate (pH 5.6) and 400 µL isopropanol.
4. The samples are spun again at 16,000g for 15 min, the isopropanol is removed,
and the DNA is washed with 700 µL of 70% ethanol. After another spin for 15
min at 16,000g, the ethanol is decanted, and the DNA is dried and resuspended in
50 µL of water. Samples are stored at –20
o
C until use.
5. Analysis of blood DNA for the donor genetic marker is done by PCR. We have
routinely used a LacZ transgene or a Y-chromosome marker as the genetic
AGM and Yolk Sac HSC 11
marker. Simultaneously, a PCR for DNA normalization is performed using
myogenin primers. One mL of DNA is added to 1 mL of deoxynucleotide 5'
triphosphate (dNTP) mix, 5 µL of 10X PCR buffer, 1 µL of each primer (100 ng
each), 1 ml Taq polymerase plus water to a total volume of 50 µL. The conditions
for the LacZ-myogenin PCR are: 92
o
C for 5 min, followed by 30 cycles at 92
o
C
for 1 min, 55
o
C for 2 min, 72
o
C for 2 min, and a final single cycle at 72
o
C for 7
min. The sizes of the amplified products are 670 base pairs (bp) for LacZ and 245
bp for myogenin. The conditions for the YMT-2 male marker-myogenin PCR
are: 92
o
C for 5 min, followed by 30 cycles at 92
o
C for 1 min, 60
o
C for 2 min, and
72
o
C for 2 min, and a final single cycle at 72
o
C for 7 min. The sizes of the ampli-
fied products are 342 bp for YMT-2 and 245 bp for myogenin. These conditions
may vary, depending on the instrument used for PCR.
6. After the PCR, the amplified products are run on a 1.5–2% agarose gel with
appropriate donor-marker contribution controls (100%, 10%, 1%, and 0%, which
are made by mixed transgenic or male DNA with nontransgenic or female DNA).
Gels are blotted according to standard Southern blotting procedures and [
32
P]-
labeled probes are used for hybridization. Percentage engraftment by donor cells
is determined by quantitation of radioactive bands on a phosphorimager.
3.5.2.2. MULTILINEAGE ANALYSIS
To test for long-term multilineage hematopoietic reconstitution, the periph-
eral blood, bone marrow, thymus, lymph nodes, and spleen are isolated from
reconstituted mice at least 4 months after transfer. When a cell-surface marker
can be used to detect donor-cell repopulation (as with the Ly-5.1/Ly-5.2
congenics) multilineage repopulation can be tested through FACS analysis of
the different tissues, using a donor-specific MAb in combination with hemato-
poietic lineage-specific antibodies. When a genetic marker is used to detect
donor-type reconstitution, cells of the different hematopoietic lineages are pu-
rified and DNA is isolated from them. This can be done by growing cells in the
presence of lineage-specific stimuli/growth factors—in order to obtain rela-
tively pure populations of B, T, and myeloid cells—or alternatively, by sorting
cells to high purity by FACS using antibodies that recognize the different he-
matopoietic lineages.
1. For culture of B or T cells, spleen cells are grown for 3–4 d in “complete me-
dium” supplemented with either 10 µg/mL lipopolysaccharide or 10–40 U/mL
murine interleukin 2 (IL-2) together with 5 µg/mL concanavalin A, respectively.
2. Macrophages can be obtained by growing peritoneal, spleen, or bone-marrow
cells for 4–10 d in complete medium in the presence of 10% L-cell-conditioned
medium as a source of M-CSF. After culture, the purity of the cells can be deter-
mined through FACS analysis using B, T, and macrophage-specific antibodies,
and DNA is isolated.
3. To sort B, T, myeloid, and erythroid cells from spleen and bone-marrow cell
12 Dzierzak and de Bruijn
suspensions, the following lineage-specific antibodies are routinely used (avail-
able from sources such as Pharmingen). For B cells, these are RA3–6B2 (anti-
CD45R, B220) and 1D3 (anti-CD19). For T cells, the combination of 53–6.7
(anti-CD8a, Ly-2) and H129.19 (anti-CD4, L3T4)) MAb is a good option, as the
CD4 and CD8 antigens are expressed at a higher level on T cells than the pan-T
cell marker CD3, thereby facilitating their detection. Myeloid cells can be puri-
fied using M1/70 (anti-CD11b, Mac-1), which recognizes complement receptor
3, expressed on both macrophages and granulocytes. As CD11b is also expressed
by a subset of B cells (the CD5-positive B cells) present in the peritoneal cavity
and spleen, it is advised to use this marker in combination with a B cell-marker
when sorting myeloid cells from these tissues. To purify for erythroid cells, TER-
119 is generally used.
4. After sorting, the purity of the isolated populations is checked, and usually ex-
ceeds 95%. DNA is isolated from at least 10
4
sorted cells and donor-type recon-
stitution tested by PCR using donor-specific primers as described in Subheading
3.5.2.1., steps 5 and 6.
4. Notes
1. We have routinely used a transgene as the genetic marker of the donor embryonic
cells (10,11). Other markers available are the Y chromosome marker (if embryos
are typed for sex) (5) and the Ly5.1/5.2 congenic system (12). When using
transgenes as markers, the use of homozygous transgenic males mated to normal
females will eliminate any detectable contribution of the maternal blood cells
which can be a source of contamination during the dissection of embryos.
2. The embryos within a litter are staged by counting somite pairs (sp) (14) and
examining eye pigmentation and the shape of the limb buds (15). Since embryos
within a single litter can vary by as much as 0.5 d in gestation, this assures that
embryonic tissues used for experiments will be developmentally similar. For bet-
ter contrast, a dissection microscope with a black background stage and a cold
light source is used to illuminate the embryos from the side (at 10–15× magnifica-
tion). E8–8.5 embryos have 1–7 sp; E8.5–9 embryos have 8–14 sp; E9–9.5 em-
bryos have 13–20 sp, and E9.5–10 embryos have 21–30 sp. Embryos of 30–35 sp
are considered early E10, 36–37 sp mid-E10, and 38–40 late E10. At E11, sp are
greater than 40, the eye pigmentation ring is closing, and the limb buds are rounded
with the beginning of internal digital segmentation.
3. It is rare to find maternal contribution to CFU-S activity, because embryos and
tissues are washed throughout the dissection procedure. However, when very low
CFU-S numbers per spleen are obtained or endogenous CFU-S activity is found
in the control spleens, use of the donor genetic marker may be necessary to clearly
prove the donor-origin of the CFU-S.
AGM and Yolk Sac HSC 13
Acknowledgments
The authors thank all members of the laboratory, past and present, especially Dr.
Alexander Medvinsky, Dr. Maria-Jose Sanchez and Dr. Albrecht Muller for con-
tributing to the development of the protocols and procedures described in this
chapter. Also, we thank Drs. Marian Peeters and Robert Oostendorp for critical
comments on the manuscript. Our research is supported by the Netherlands Scien-
tific Organization (901–08–090), the Leukemia Society of America (1034–94),
the KWF (EUR 99–1965), and the National Institutes of Health (DK54077–02).
References
1. Dzierzak, E., Medvinsky, A., and de Bruijn, M. (1998) Qualitative and quantita-
tive aspects of haemopoietic cell development in the mammalian embryo. Immu-
nology Today 19(5), 228–236.
2. Moore, M. A. and Metcalf, D. (1970) Ontogeny of the haemopoietic system: yolk
sac origin of in vivo and in vitro colony forming cells in the developing mouse
embryo Br. J. Haematol. 18(3), 279–296.
3. Medvinsky, A. L., Samoylina, N. L., Muller, A. M., and Dzierzak, E. A. (1993)
An early pre-liver intraembryonic source of CFU-S in the developing mouse.
Nature 364(6432), 64–67.
4. Godin, I. E., Garcia-Porrero, J. A., Coutinho, A., Dieterlen-Lievre, F., and Marcos,
M. A. (1993) Para-aortic splanchnopleura from early mouse embryos contains
B1a cell progenitors. Nature 364(6432), 67–70.
5. Medvinsky, A. and Dzierzak, E. (1996) Definitive hematopoiesis is autonomously
initiated by the AGM region. Cell 86(6), 897–906.
6. Cumano, A., Dieterlen-Lievre, F., and Godin, I. (1996) Lymphoid potential,
probed before circulation in mouse, is restricted to caudal intraembryonic
splanchnopleura. Cell 86(6), 907–916.
7. Yoder, M. C., Hiatt, K., Dutt, P., Mukherjee, P., Bodine, D. M., and Orlic, D.
(1997) Characterization of definitive lymphohematopoietic stem cells in the day 9
murine yolk sac. Immunity 7(3), 335–344.
8. Godin, I., Garcia-Porrero, J. A., Dieterlen-Lievre, F., and Cumano, A. (1999) Stem
cell emergence and hemopoietic activity are incompatible in mouse
intraembryonic sites. J. Exp. Med. 190, 43–52.
9. Dzierzak, E. and Medvinsky, A. (1995) Mouse embryonic hematopoiesis. Trends
Genet. 11(9), 359–366.
10. Muller, A. M., Medvinsky, A., Strouboulis, J., Grosveld, F., and Dzierzak, E.
(1994) Development of hematopoietic stem cell activity in the mouse embryo.
Immunity 1(4), 291–301.
11. Sanchez, M. J., Holmes, A., Miles, C., and Dzierzak, E. (1996) Characterization
of the first definitive hematopoietic stem cells in the AGM and liver of the mouse
embryo. Immunity 5(6), 513–525.
12. Spangrude, G. J., Heimfeld, S., and Weissman, I. L. (1988) Purification and char-
acterization of mouse hematopoietic stem cells. Science 241(4861), 58–62.
14 Dzierzak and de Bruijn
13. Hogan, B., Costantini, F., and Lacy, E. (1986) Manipulating the Mouse Embryo:
A Laboratory Manual, Cold Spring Harbor Laboratory, Cold Spring Harbor, NY.
14. Kaufman, M. (1992) The Atlas of Mouse Development, Academic Press Limited,
London, pp. 5–8.
15. Samoylina, N. L., Gan, O. I., and Medvinsky, A. L. (1990) Development of the
hemopoietic system: Splenic colony forming units in mouse embryogenesis. Sov.
J. Dev. Biol. 21, 127–133.
16. Lemischka, I. R. (1991) Clonal, in vivo behavior of the totipotent hematopoietic
stem cell. Seminars in Immunology 3, 349–355.
17. Medvinsky, A. L., Gan, O. I., Semenova, M. L., and Samoylina, N. L. (1996)
Development of day-8 colony-forming unit-spleen hematopoietic progenitors
during early murine embryogenesis: spatial and temporal mapping. Blood 87(2),
557–566.
18. Harrison, D. E., Jordan, C. T., Zhong, R. K., and Astle, C. M. (1993) Primitive
hemopoietic stem cells: Direct assay of most productive populations by competi-
tive repopulation with simple binomial, correlation and covariance calculations.
Exp. Hematol. 21(2), 206–219.
19. Jordan, C. T. and Lemischka, I. R. (1990) Clonal and systemic analysis of long-
term hematopoiesis in the mouse. Genes Dev. 4(2), 220–232.
Mouse HSC Isolation 15
15
From: Methods in Molecular Medicine, vol. 63: Hematopoietic Stem Cell Protocols
Edited by: C. A. Klug and C. T. Jordan © Humana Press Inc., Totowa, NJ
2
The Purification of Mouse Hematopoietic Stem
Cells at Sequential Stages of Maturation
Sean J. Morrison
1. Introduction
Hematopoietic stem cells (HSCs) are rare, self-renewing progenitors that
give rise to all lineages of blood cells. HSCs can be found in all hematopoietic
organs, from the para-aortic mesoderm (1,2) and yolk sac (3,4) in fetuses to the
bone marrow (reviewed in ref. 5), blood and spleens of adults.
HSCs can be isolated by flow-cytometry, based on surface-marker expres-
sion. Multipotent hematopoietic progenitors have been purified as Thy-1
lo
Sca-
1
+
Lineage
-/lo
bone-marrow cells (9). Although this population contained all
multipotent progenitors in C57BL/Ka-Thy-1.1 mice (10), it was heterogeneous,
containing transiently reconstituting multipotent progenitors in addition to
long-term reconstituting HSCs (11,12). We found cell-intrinsic differences
between long-term self-renewing HSCs and transiently reconstituting
multipotent progenitors that permit the independent isolation of these progeni-
tor populations (13). Three distinct multipotent progenitor populations were
isolated from the bone marrow of C57BL/Ka-Thy-1.1 mice (13–15): the Thy-
1
lo
Sca-1
+
Lineage
–
Mac-1
–
CD4
–
c-kit
+
population contained mainly long-term
self-renewing HSCs (see Note 1), the Thy-1
lo
Sca-1
+
Lineage
-
Mac-1
lo
CD4
–
population contained mainly transiently self-renewing multipotent progenitors
(see Note 2), and the Thy-1
lo
Sca-1
+
Mac-1
lo
CD4
lo
population contained mainly
non-self-renewing multipotent progenitors (see Note 3). These populations
form a lineage in which frequency (13), self-renewal potential (14), cell-cycle
status (13,16), and gene expression (17,18) vary with each stage in the progres-
sion toward lineage commitment (14). The ability to isolate HSCs at sequential
16 Morrison
stages of development permits direct analyses of their properties and the prop-
erties of their immediate progeny.
The properties of HSCs also change during ontogeny (19,20). For example,
fetal liver HSCs give rise to bone-marrow HSCs (21,22), but HSCs in the bone
marrow and fetal liver are phenotypically and functionally distinct (23,24).
HSCs can be purified from fetal liver as Thy-1
lo
Sca-1
+
Lineage
–
Mac-1
+
CD4
–
cells (23, see Note 4). This population contains all of the multipotent progeni-
tors from the fetal liver of C57BL/Ka-Thy-1.1 mice. Overall, HSCs can be
isolated at four sequential stages of development in the fetal liver and bone
marrow.
Other markers have also been identified that permit the purification of long-
term self-renewing HSCs from mouse bone marrow. Rhodamine
123
lo
Hoechst
lo
cells (25), or rhodamine 123
lo
Sca-1
+
Lin
-
cells that are Thy-1
lo
(26) or c-kit
+
(27) are pure or nearly pure populations of long-term reconstitut-
ing HSCs. Although rhodamine
med-high
cells are enriched for transiently recon-
stituting multipotent progenitors (27–29), no evidence has established that it is
possible to purify transiently reconstituting multipotent progenitors based on
elevated levels of rhodamine staining. Long-term self-renewing HSCs can also
be purified as CD34
–
Sca-1
+
c-kit
+
Lin
–
cells (30). Although transiently reconsti-
tuting multipotent progenitors are enriched in the CD34
+
fraction, no evidence
indicates that they can be purified based on CD34 expression. Finally, AA4.1-
Lin
-
Aldehyde dehydrogenase
+
cells have also been found to be highly enriched
for long-term HSCs, but the phenotype of transiently reconstituting multipotent
progenitors with respect to these markers has not been addressed (31). Thus
other markers permit the purification of HSCs, but they have not been shown
to permit the simultaneous purification of transiently reconstituting multipotent
progenitors
2. Materials
2.1. Isolation of Bone Marrow
1. Adult Thy-1.1
+
, Ly-6.2 (Ly-6
b
) mice such as C57BL/Ka-Thy-1.1 or AKR/J. Typi-
cally, 6–10-wk-old mice are used, but older mice can also be used for the isola-
tion of HSCs.
2. Staining medium: Hank’s Balanced Salt Solution (HBSS) with 2% heat-inacti-
vated calf serum.
3. Nylon screen to filter the bone-marrow cells after isolation (for example, the cell
strainer with 70 µm nylon mesh from Falcon, product #2350 is suitable).
4. 3-mL syringes with 25-gauge needles to flush marrow out of femurs and tibias.
5. Use 6-mL or 15-mL tubes to stain bone-marrow cells. Note that cells must be
transferred to 6-mL Falcon 2058 tubes for fluorescence-activated cell-sorting
Mouse HSC Isolation 17
(FACS) on Becton Dickinson machines or Falcon 2005 tubes for FACS on
Cytomation machines.
2.2. Staining of Bone Marrow
Most of the antibodies described in this protocol are available from
Pharmingen (San Diego, CA), and hybridomas are readily available from a
number of laboratories.
1. Lineage-marker antibodies: KT31.1 (anti-CD3), GK1.5 (anti-CD4), 53–7.3 (anti-
CD5), 53–6.7 (anti-CD8), M1/70 (anti-CD11b; Mac-1), Ter119 (anti-erythrocyte-
progenitor antigen; Ly76), 6B2 (anti-B220; CD45R), and 8C5 (anti-Gr-1;
Ly-6G). Note that all antibodies should be titrated before use, and used at dilu-
tions that brightly stain antigen-positive cells without nonspecifically staining
antigen-negative cells.
2. Fluorescein-5-isothiocyanate (FITC)-conjugated 19XE5 antibody (anti-Thy-1.1;
CD90.1).
3. Biotinylated E13, anti-Sca-1 (Ly6A/E) antibody.
4. Allophycocyanin (APC)-conjugated anti-c-kit (CD117) antibody, such as 2B8.
Note that some anti-c-kit antibodies, like 2B8, give brighter staining than others,
like 3C11, and are preferable.
5. APC-conjugated M1/70 (anti-Mac-1 antibody). This must provide bright stain-
ing without nonspecific background in order to cleanly distinguish Mac-1
lo
cells
(see ref. 32).
6. Phycoerythrin-conjugated GK1.5 (anti-CD4 antibody). This must give bright
staining without nonspecific background in order to cleanly distinguish CD4
lo
cells.
7. Streptavidin conjugated to Texas Red or PharRed (APC-Cy7), depending on the
configuration of the FACS machine (lasers and filters). The dye conjugated to
streptavidin must be compatible with simultaneous analysis of FITC, phycoeryth-
rin, and APC.
8. A viability dye such as propidium iodide (PI) or 7-aminoactinomycin D (7-AAD).
Depending on FACS machine configuration, 7-AAD may be superior because it
has a more narrow emission spectrum and therefore causes fewer compensation
problems with other dyes.
2.3. Pre-Enrichment of Progenitors with Magnetic Beads
1. A MACS cell separation unit from Miltenyi Biotec (Auburn, CA).
2. MiniMACS (MS
+
) columns (designed to hold 10
7
cells) or midiMACS (LS
+
)
columns (designed to hold 10
8
cells) from Miltenyi Biotec. In bone-marrow
preparations obtained from 3–6 mice, 1 or 2 miniMACS columns can be used. In
preparations using larger amounts of bone-marrow midiMACS columns are pre-
ferred.
3. Streptavidin-conjugated paramagnetic beads from Miltenyi Biotec.
18 Morrison
2.4. FACS
1. A FACS machine with at least four-color capability, such as a Becton Dickinson
FACS Vantage (San Jose, CA), or a Cytomation MoFlo (Fort Collins, CO).
2.5. Isolation of Fetal Liver HSCs
Reagents for the isolation of fetal liver HSCs are the same as described in
Subheadings 2.1. and 2.2., except that fetal livers are obtained from E12 to
E15 timed pregnant mice. To maximize the yield of HSCs, E14.5 livers are
preferred.
3. Methods
3.1. Isolation of Bone Marrow
Obtain bone marrow from a 6–12-wk-old mouse of appropriate genotype
(Ly-6.2, Thy-1.1)
1. Sacrifice the mouse by cervical dislocation and dissect the femurs and tibias.
2. Cut the ends off the bones to facilitate access to the marrow cavity.
3. Flush the marrow out of each bone using a 25-gauge needle to force staining
medium through the marrow cavities. Collect the marrow and staining medium
in a Petri dish.
4. Prepare a single-cell suspension by drawing the marrow and staining medium
through the needle into the syringe. Expel the marrow back out of the syringe
into a 6-mL or 15-mL tube, depending on the amount of marrow to be stained.
The marrow will tend to dissociate as it passes through the needle, but the result-
ing cell suspension must still be filtered as it is expelled into the tube, by placing
a nylon screen over the mouth of the 6-mL or 15-mL tube.
3.2. Staining of Bone Marrow
The bone marrow contains three different multipotent progenitor popula-
tions: long-term self-renewing Thy-1
lo
Sca-1
+
Lineage
-
Mac-1
–
CD4
–
c-kit
+
cells,
transiently self-renewing Thy-1
lo
Sca-1
+
Lineage
-
Mac-1
lo
CD4
–
cells, and non-
self-renewing Thy-1
lo
Sca-1
+
Mac-1
lo
CD4
lo
cells. Because of differences in
Mac-1 and CD4 staining, the bone marrow must be divided into three aliquots
to stain for each population separately.
3.2.1. Staining for Long-Term Self-Renewing Thy-1
lo
Sca-1
+
Lineage
–
Mac-1
–
CD4
–
c-kit
+
Cells
1. Suspend bone-marrow cells in antibodies at a density of 10
8
cells per mL. Cells
are stained first with unlabeled antibodies against lineage markers. The lineage
cocktail is a mixture of antibodies against CD3 (KT31.1), CD4 (GK1.5), CD5
Mouse HSC Isolation 19
(53–7.3), CD8 (53–6.7), B220 (6B2), and Gr-1 (8C5), erythrocyte-progenitor an-
tigen (Ter119), and Mac-1 (M1/70). In order to maximize the enrichment of long-
term self-renewing HSCs, it is necessary to eliminate Mac-1
lo
and CD4
lo
transiently reconstituting multipotent progenitors. Thus, it is critical to use anti-
bodies against Mac-1 and CD4 that stain brightly (see Figs. 2–4). In some cases
it is preferable to use directly conjugated antibodies against Mac-1 and CD4. If
directly conjugated antibodies are used, they should not be included in the lin-
eage cocktail, but should be included with other directly conjugated antibodies in
step 4. Always incubate in antibodies for 20–25 min on ice. After this incubation
period, dilute the cells in at least 10 vol of staining medium, then centrifuge for 6
min at 600g.
2. Aspirate the supernatant, then resuspend the cell pellet in anti-rat immunoglobu-
lin (IgG) second-stage antibody conjugated to phycoerythrin. For example, suit-
able second stage antibodies are available from Jackson Immunoresearch (West
Grove, Pennsylvania). After incubating for 20 min on ice, wash off unbound
antibody by diluting in staining medium and centrifuging.
3. Resuspend the cell pellet in 0.1 mg/mL rat IgG to block unbound sites on the
second-stage antibody. Incubate for 10 min on ice.
4. Without washing or centrifuging, add all directly conjugated antibodies to the
cell suspension including biotinylated anti-Sca-1, and APC-conjugated anti-c-kit
(2B8), FITC-conjugated anti-Thy-1.1, as well as phycoerythrin-conjugated anti-
bodies against CD4 and Mac-1 if these were not included in the lineage cocktail.
After incubating for 20 min, wash the cells twice by diluting in staining medium
followed by centrifugation.
5. The cells can now either be pre-enriched using magnetic beads (see Subheading
3.3.), or prepared for FACS of unenriched cells. If FACS will be performed on
unenriched cells, complete the staining by incubating in streptavidin conjugated
to Texas Red or PharRed for 20 min on ice. After washing, resuspend the cells in
staining medium containing a viability dye (PI at 1 µg/mL or 7-AAD at 2 µg/
mL), and leave on ice pending FACS (see Subheading 3.4.). If cells are to be
pre-enriched using magnetic beads, see Subheading 3.3.
3.2.2. Staining for Transiently Self-Renewing Thy-1
lo
Sca-1
+
Lineage
–
Mac-1
lo
CD4
–
Cells
1. Stain for 20 min in a cocktail of antibodies against all lineage markers except
Mac-1. Directly conjugated Mac-1 antibody will be used later in the protocol.
Dilute in staining medium, and centrifuge.
2. Resuspend the cell pellet in phycoerythrin-conjugated anti-rat IgG. After incu-
bating for 20 min, dilute and centrifuge.
3. Resuspend the cell pellet in 0.1 mg/mL rat IgG to block unbound sites on the
second-stage antibody. Incubate for 10 min on ice.
4. Without washing or centrifuging, add all directly conjugated antibodies to the
cell suspension, including biotinylated anti-Sca-1, APC-conjugated anti-Mac-1
(M1/70), FITC-conjugated anti-Thy-1.1, and phycoerythrin-conjugated anti-CD4
20 Morrison
when it is not included in the lineage cocktail. After incubating for 20 min, wash
the cells twice by diluting in staining medium followed by centrifugation.
5. The cells are now ready for pre-enrichment with magnetic beads (see Subhead-
ing 3.3.), or the staining can be completed by incubating in streptavidin conju-
gated to Texas Red or PharRed for 15–20 min on ice. The cells should then be
resuspended in staining medium containing a viability dye (PI at 1µg/mL or 7-
AAD at 2 µg/mL) pending FACS (see Subheading 3.4.).
3.2.3. Staining for Isolation of Non-Self-Renewing Thy-1
lo
Sca-1
+
Mac-
1
lo
CD4
lo
Cells
1. Stain in directly conjugated antibodies: biotinylated anti-Sca-1, FITC-conjugated
anti-Thy-1.1, phycoerythrin-conjugated anti-CD4, and APC-conjugated anti-
Mac-1.
2. Pre-enrich with magnetic beads by proceeding to Subheadings 3.3, or stain in
streptavidin-Texas Red, and then resuspend in PI or 7-AAD pending FACS (see
Subheading 3.4.). Note that Thy-1
lo
Sca-1
+
Mac-1
lo
CD4
lo
cells appear to be nega-
tive for other lineage markers.
3.3. Pre-Enrichment of Progenitors with Magnetic Beads
Since the populations described in Subheadings 3.2.1.–3.2.3. represent only
0.01–0.03% of normal adult bone-marrow cells, FACS can be very time-con-
suming without pre-enrichment. Progenitors can be pre-enriched by selecting
Sca-1
+
cells using streptavidin-conjugated paramagnetic beads, such as those
provided by Miltenyi Biotec.
1. Resuspend the cell pellet in degassed staining medium plus streptavidin-conju-
gated paramagnetic beads. Staining medium can be degassed by incubating it
under vacuum for 20 min. For 10
8
cells, use 0.4 mL staining medium plus 0.1 mL
magnetic beads. Exercise care not to introduce air bubbles while resuspending
cells. Incubate for 15 min at 4°C.
2. During this incubation period, prepare a miniMACS column (capacity 10
7
cells
in the magnetic fraction) by running degassed staining medium through it. This
column size is appropriate for enriching progenitors from up to 2.5 × 10
8
bone-
marrow cells (~3 mice). If larger amounts of bone marrow are being processed,
then midiMACS columns with a capacity of 10
8
cells in the magnetic fraction
can be used.
3. Without washing or centrifuging, add Texas Red or PharRed-conjugated
streptavidin to the cell suspension (depending on FACS configuration). Incubate
for an additional 15 min at 4°C. Dilute in staining medium, then centrifuge.
4. Resuspend the cell pellet in 0.2 mL of medium per 10
8
cells. Add the resus-
pended cells to a MACS column and place the column in the magnet. After the
liquid phase has passed through the magnet, return the cell suspension to the top
of the magnet twice, allowing the cells to pass through the column a total of three
Mouse HSC Isolation 21
times. Unbound cells in the fluid phase within the column must be washed out by
running staining medium through the column (typically 1 mL for miniMACS and
5 mL for midiMACS) . The magnetic fraction (retained within the column) should
be enriched in Sca-1
+
cells. It can be eluted from the column by removing the
column from the magnet, and forcing approx 0.5 mL of staining medium through
the column with a plunger provided by the manufacturer.
5. Pellet the magnetic fraction by centrifugation, then resuspend in staining me-
dium containing a viability dye such as PI (1 µg/mL) or 7-AAD (2 µg/mL).
3.4. FACS
In order to purify the multipotent progenitor populations, two consecutive
rounds of sorting should be performed. In each round, sort the cells into stain-
ing medium. Containing a viability dye (PI or 7AAD) to mark any cells that die
after the first round of sorting.
Fig. 1 A reanalysis of long-term self-renewing HSCs isolated by FACS from the
bone marrow of C57BL/Ka-Thy-1.1 mice. The shaded histograms represent Thy-
1
lo
Sca-1
+
Lineage
-
Mac-1
–
CD4
–
c-kit
+
cells, and the unshaded histograms represent
whole bone-marrow cells.
22 Morrison
Fig. 2.A reanalysis of transiently self-renewing multipotent progenitors isolated
by FACS from the spleens of cyclophosphamide/G-CSF treated mice (15). The shaded
histograms represent Thy-1
lo
Sca-1
+
Lineage
-
Mac-1
lo
CD4
–
cells, and the unshaded his-
tograms represent unseparated splenocytes. Although these cells were isolated from
the spleens of mobilized mice, the fluorescence profile of Thy-1
lo
Sca-1
+
Lineage
-
Mac-
1
lo
CD4
–
cells isolated from bone marrow is very similar (13). Note that although c-kit
was not used as a marker to isolate these cells, all cells in this population are c-kit
+
(13,15).
1. The fluorescence profiles of Thy-1
lo
Sca-1
+
Lineage
-
Mac-1
–
CD4
–
c-kit
+
cells rela-
tive to whole bone-marrow cells are shown in Fig. 1. Cells considered negative
for a marker have fluorescence levels consistent with autofluorescence (un-
stained) background. Cells are Thy-1
lo
if they have fluorescence greater than
autofluorescence, but less than that exhibited by T cells.
2. The fluorescence profiles of Thy-1
lo
Sca-1
+
Lineage
-
Mac-1
lo
CD4
–
cells are shown
in Fig. 2. Although Fig. 2 shows cells isolated from the spleens of cyclophospha-
mide/granulocyte colony stimulating factor (G-CSF)-mobilized mice, the fluo-
rescence profiles are very similar to that observed in bone marrow. Mac-1
lo
cells
have fluorescence greater than autofluorescence background, but less than most
mature myeloid cells.
Mouse HSC Isolation 23
3. The fluorescence profiles of Thy-1
lo
Sca-1
+
Mac-1
lo
CD4
lo
cells are shown in Fig.
3. CD4
lo
cells have fluorescence greater than autofluorescence background but
less than CD4
+
T cells. Bright CD4 and Mac-1 staining are required to distin-
guish CD4
lo
and Mac-1
lo
cells from background.
3.5. Purification of Fetal-Liver HSCs
1. Prepare a single-cell suspension from E12 to E15 fetal liver. Remove the fetal
livers and make a single-cell suspension by drawing the cells into a syringe
through a 25-gauge needle and then expelling the cells into a tube through a
nylon screen.
Fig. 3.A reanalysis of non-self-renewing multipotent progenitors isolated by
FACS from the bone marrow of C57BL/Ka-Thy-1.1 mice. The shaded histograms
represent Thy-1
lo
Sca-1
+
Mac-1
lo
CD4
lo
cells. The fluorescence profile of the whole
bone-marrow cells from which the Thy-1
lo
Sca-1
+
Mac-1
lo
CD4
lo
cells were isolated is
not shown. Although c-kit was not used as a marker to isolate these cells, all cells in
this population are c-kit
+
(13). Note the increased frequency of contaminating CD4
hi
and Mac-1
hi
cells in this population. Because no negative markers are used in the
isolation of this population, it is more difficult to isolate cleanly. Two consecutive
rounds of sorting are required to eliminate contaminants.
24 Morrison
2. Stain the fetal liver cells with a cocktail of antibodies against lineage markers
including CD3 (KT31.1), CD4 (GK1.5), CD5 (53–7.3), CD8 (53–6.7), B220
(6B2), Gr-1 (8C5), and erythrocyte-progenitor antigen (Ter119). Of these mark-
ers, Ter119 is most important, because most fetal liver cells are Ter119
+
. After
20 min incubation on ice, dilute and centrifuge.
3. Resuspend the cell pellet in anti-rat IgG second-stage antibody conjugated to
phycoerythrin. After incubating for 20 min on ice, wash by diluting in staining
medium and centrifuging.
4. Resuspend the cell pellet in 0.1 mg/mL rat IgG to block unbound sites on the
second-stage antibody. Incubate for 10 min on ice.
5. Without washing or centrifuging, add all directly conjugated antibodies to the
cell suspension, including biotinylated anti-Sca-1, APC-conjugated anti-Mac-1,
and FITC-conjugated anti-Thy-1.1. After incubating for 20 min, wash the cells
twice by diluting in staining medium, followed by centrifugation.
6. The cells can now either be pre-enriched using magnetic beads (see Subheading
Fig. 4.A reanalysis of HSCs isolated by FACS from the livers of C57BL/Ka-Thy-
1.1 fetuses. The unshaded histograms represent Thy-1
lo
Sca-1
+
Lineage
-
Mac-1
+
CD4
–
cells, and the shaded histograms represent unseparated fetal liver cells. Note that the
bulk of lineage marker staining on unseparated fetal liver cells derives from Ter119
+
erythroid precursors.