hepatitis b and d protocols volume 2
Bạn đang xem bản rút gọn của tài liệu. Xem và tải ngay bản đầy đủ của tài liệu tại đây (6.38 MB, 549 trang )
Hepatitis B and D
Protocols
Edited by
Robert K. Hamatake, PhD
Johnson Y. N. Lau, MD
M E T H O D S I N M O L E C U L A R M E D I C I N E
TM
Volume II: Immunology,
Model Systems,
and Clinical Studies
Hepatitis B and D
Protocols
Edited by
Robert K. Hamatake, PhD
Johnson Y. N. Lau, MD
Volume II: Immunology,
Model Systems,
and Clinical Studies
1
Studying Host Immune Responses
Against Duck Hepatitis B Virus Infection
Darren S. Miller, Edward M. Bertram, Catherine A. Scougall,
Ieva Kotlarski, and Allison R. Jilbert
1. Introduction
The duck hepatitis B virus (DHBV) is a species-specific virus that causes either tran-
sient (acute) or persistent infections, primarily in hepatocytes in the liver, with release
of high titers of infectious virions and noninfectious “empty” surface antigen particles
into the bloodstream.
Because hepadnavirus replication is noncytolytic, cell-mediated immune (CMI)
responses to viral antigens are thought to be responsible for the clearance of virus from
infected cells and for the liver damage seen in transient and persistent infections. This is
presumed to occur via a direct, cytolytic effect of viral antigen-specific cytotoxic T
lymphocytes (CTLs) on infected hepatocytes, or via the noncytopathic action of inflam-
matory cytokines. In addition, neutralizing antibodies have been shown to prevent
infection by blocking the ability of virus particles to bind to receptors on target cells.
DHBV-infected ducks and woodchuck hepatitis virus (WHV)-infected woodchucks
are the most widely accepted and frequently used animal models for the study of viral
replication, infection outcomes, and the pathogenic mechanisms related to human hep-
atitis B virus (HBV) infection. Use of the DHBV model has allowed us to study the
effects of viral dose, age, and inoculation route on the course of DHBV infection (1–4)
and the effect of immunization with various forms of vaccine on all these parameters
(5). However, until recently, studies of the immune response to DHBV infection have
been hampered by the relatively poor characterization of the duck lymphoid system and
the lack of appropriate reagents. This chapter describes a number of assays that allow
study of components of the duck immune system and the cellular and humoral immune
responses to DHBV infection.
The chapter has been divided into three sections that include:
1. Purification and characterization of duck lymphocytes and thrombocytes from peripheral
3
From: Methods in Molecular Medicine, vol. 96: Hepatitis B and D Protocols, volume 2
Edited by: R. K. Hamatake and J. Y. N. Lau © Humana Press Inc., Totowa, NJ
4Miller et al.
blood (6) and conditions for in vitro growth and lectin stimulation of duck peripheral blood
mononuclear cells (PBMCs; 7,8).
2. Histological methods for detection of cellular and viral antigens in duck tissues including
identification of duck T lymphocytes using anti-human CD3⑀ antibodies (9), identification
of Kupffer cells in the liver and phagocytic cells in the spleen, and detection of DHBV anti-
gens in fixed tissues by immunoperoxidase staining.
3. Detection of viral antigens, DHBV-specific antibodies, and viral DNA in duck serum using
enzyme-linked immunosorbent assays (ELISA) for DHBV surface antigen (DHBsAg), anti-
bodies to DHBV surface antigen (anti-DHBs antibodies), antibodies to DHBV core antigen
(anti-DHBc antibodies), and polymerase chain reaction (PCR) assays for detection of
DHBV DNA.
These techniques provide the opportunity to study immune responses to DHBV but
are by no means complete. For example, we have made numerous unsuccessful
attempts to develop viral antigen-specific CTL assays but progress has been hampered
by lack of suitable major histocompatibility class (MHC)-matched target cells. The
recent cloning by Professor David Higgins and colleagues of a series of duck T-
lymphocyte and cellular markers, that includes CD3, CD4, CD8, MHC I, and MHC II
(10–13), should allow more comprehensive monitoring of immune responses to DHBV
(see Note 1).
1.1. Purification and Characterization of Duck Lymphocytes
and Thrombocytes from Peripheral Blood
Avian blood contains lymphocytes, monocytes, thrombocytes, red blood cells, het-
erophils, and eosinophils. Duck lymphocytes are round nongranular cells with large
round nuclei and little cytoplasm and have a diameter of 4–8 m (6). Duck monocytes
are round cells with large, often indented, nuclei and with more cytoplasm than lym-
phocytes, although it can be difficult to distinguish one cell type from the other. Duck
thrombocytes, which are essential for blood clotting, are of similar size to lymphocytes
but are highly vacuolated, making it possible to distinguish them from lymphocytes
using flow cytometry owing to their increased side scatter (6). Duck red blood cells
(DRBCs) are nucleated and strictly ought to be considered as a subset of PBMCs. How-
ever, for the purposes of this chapter, duck PBMC preparations do not include DRBCs.
They contain the mononuclear cells that can be separated from whole blood using
Ficoll-Paque density gradients. DRBCs and heterophils pellet to the bottom of Ficoll-
Paque gradients. Further information on avian hematology and photographs of the cell
populations present in avian blood are available on the World Wide Web (14,15).
Most published reports of duck lymphocyte cultures have used PBMCs collected
from Ficoll-Paque gradients including the cells present at the plasma–Ficoll-Paque
interface and in the Ficoll-Paque above the DRBC pellet. PBMCs collected in this way
include 22–26% T lymphocytes (9) and up to 60% thrombocytes, with the remainder
not clearly identified, although most are likely to be B lymphocytes and monocytes.
Unlike the findings with mammalian and chicken lymphocytes, antibodies to duck
immunoglobulins (Ig) bind to a large proportion of duck lymphocytes from blood,
spleen, thymus, and bursa of Fabricius and therefore are not useful for identifying and
Host Immune Responses Against DHBV 5
isolating duck B lymphocytes (16). Moreover, monoclonal antibodies specific for deter-
minants on mouse, rat, human, and chicken T lymphocytes do not react with duck lym-
phocytes (D. Higgins, personal communication). However, a rabbit antiserum that
reacts with a conserved intracytoplasmic portion of the human CD3⑀ chain binds to
duck lymphocytes with a staining pattern similar to that of mammalian T lymphocytes
(6). These antibodies precipitate a 23-kDa protein from duck lymphoblast lysates, sug-
gesting that duck lymphoid tissues contain lymphocytes functionally equivalent to
mammalian and chicken T cells (6). Because the anti-human CD3⑀ antibodies are spe-
cific for an intracellular epitope, they cannot be used to identify and/or isolate viable
cells. However, they have been used to identify a subset of duck lymphocytes by FAC-
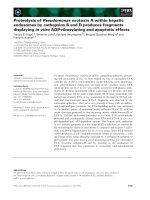
Scan analysis (see Subheading 3.1.2. and Fig. 1). The CD3⑀ antibodies can also be used
for immunostaining of lymphocytes in tissue sections (see Subheading 3.2.1.). Duck
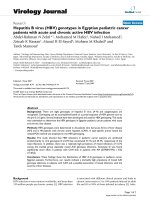
thrombocytes can be distinguished from lymphocytes by both flow cytometry (Fig. 2A)
and FACScan analysis using the anti-duck thrombocyte BA3 monoclonal antibodies
(subtype IgG2a; see Subheading 3.1.3.; Fig. 2B).
The methods described in Subheading 3.1.4. build on attempts in the 1980s to iden-
tify and separate duck lymphocytes into T and B cells (16) and to define conditions for
the in vitro culture and optimization of responses to phytohemagglutinin (PHA) and
concanavalin A (Con A) (17). We have further defined the in vitro culture conditions
that support proliferation of duck lymphocytes. These include nylon wool fractionation
of PBMCs, a technique that enriches for T lymphocytes in mammals and chickens, and
coculturing nylon wool-fractionated duck PBMCs in the presence of homologous
adherent cells (monocytes) and DRBC (8,18; Subheading 3.1.4.; Fig. 3).
Following culture of duck PBMCs large multinucleated syncytia are observed in
approx 50% of cultures from 3–7 d of incubation. The presence of these syncytia often
inhibits mitogen- and antigen-induced proliferation of the cells resulting in decreased
incorporation of [
3
H]thymidine. The syncytia are strikingly similar to osteoclasts that
develop on culture of human (19), mouse (20), and chicken (21–23) PBMCs. Examples
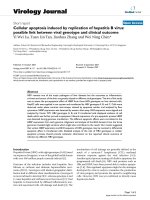
of duck syncytia are shown in Fig. 4.
Despite optimization of the in vitro proliferation assays described above, it is not yet
possible to reproducibly detect proliferation of DHBV antigen-specific T lymphocytes
from ducks immunized or infected with DHBV. Problems with reproducibility of the in
vitro assays may, in part, be due to the development of syncytia and their inhibitory
effects on lymphocyte proliferation. In any case, further efforts are required to stan-
dardize the assays before we can reliably measure CMI responses to DHBV infection.
Supernatants from PHA-stimulated duck PBMCs and spleen cells have also been
shown to contain lymphokines capable of maintaining proliferation of duck lym-
phoblasts (7; see Subheading 3.1.5.). It is possible that supernatants from DHBV
antigen-stimulated PBMCs from ducks previously infected with DHBV may contain
cytokines equivalent to those released from mammalian and chicken T cells, which
mediate CMI responses. Assays developed to detect such cytokines in culture super-
natants may also prove to be useful in measuring CMI to DHBV.
6Miller et al.
Fig. 1. FACScan analysis of single-cell suspensions of duck lymphoid organs. Cells were pre-
treated with acetone–paraformaldehyde and labeled with either rabbit anti-human CD3⑀ anti-
serum (black line) or the negative control rabbit anti-bovine myoglobin antiserum (gray line)
before the addition of FITC-conjugated sheep anti-rabbit IgG as described in the text.
1.2. Histological Methods for Detection of Cellular and
Viral Antigens in Duck Tissues
Histological and immunostaining techniques have been developed for the identifica-
tion of duck T lymphocytes, Kupffer cells, and phagocytic cells in a range of tissues,
and for the detection of DHBV antigens in liver, pancreas, kidney, and spleen. Using
these techniques it is possible to monitor infected tissues for changes in cellular infiltra-
Host Immune Responses Against DHBV 7
Fig. 2. FACScan analysis of duck PBMCs. Dot plot of duck PBMC (A). The gated region was
analyzed further using the anti-duck thrombocyte BA3 monoclonal antibodies (black line) or a
negative control monoclonal antibodies before the addition of FITC-conjugated sheep anti-mouse
IgG (B). The cell populations in the gated region of A were also separated on a FACStar cell
sorter (data not shown) and were morphologically identified as thrombocytes (with increased side
scatter) and lymphocytes (with decreased side scatter).
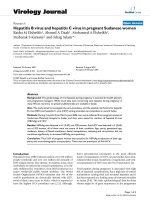
Fig. 3. Comparison of duck in vitro T-cell responses to PHA. Eight different ducks were bled
and stimulation of their T lymphocytes by PHA (5 g/mL) was measured following the method
described in the text.
8Miller et al.
tion and viral expression, and relate these to the development of viraemia and antibody
responses in the bloodstream (3).
Duck T lymphocytes can be detected in sections of formalin-fixed tissues using
anti-human CD3⑀ antibodies (see Subheading 3.2.2.). Phagocytic cells can be identi-
fied in duck liver and spleen by intravenous inoculation of ducks with colloidal car-
bon followed by histological identification of carbon containing cells (see
Subheading 3.2.3.). In the liver the phagocytic Kupffer cells are located within the
hepatic sinusoids (Fig. 5A), while the phagocytic cells present in the spleen are pres-
ent around the periellipsoid sheath in a similar location to the ellipsoid-associated
cells described in chicken spleen (24,25). Phagocytic cells in duck liver and spleen
can also be identified in sections of ethanol-fixed tissues using mouse monoclonal
antibodies, 2E.12, raised against duck liver and kindly supplied to us by Dr. John
Pugh. This reagent identifies both Kupffer cells in the liver (Fig. 5B) and ellipsoid-
associated cells in the spleen. Similar reagents that detect Kupffer and ellipsoid-
associated cells have been described for the chicken (26,27). DHBV-infected cells
can be identified in ethanol–acetic acid fixed tissues using polyclonal rabbit anti-
recombinant DHBV core antigen (rDHBcAg; 1) and anti-DHBV pre-S/S monoclonal
antibodies (1H.1; 28).
The primary cell type in the liver supporting DHBV replication is the hepatocyte,
and high levels of viral antigens and viral DNA can readily be detected in the cytoplasm
of infected cells within the liver lobule (Fig. 5C). We have found no evidence that Kupf-
fer or endothelial cells support DHBV replication (1–3); DHBV antigens and DHBV
DNA have been detected within Kupffer cells only during the clearance phase of acute,
Fig. 4. Demonstration of giant cells (syncytia) in cultures of duck PBMCs (A) and adherent
cells alone (B) following 5 d of culture as described in Subheading 3.1.4. and Note 8. In addition
to the very large syncytia, DRBC and T lymphocytes can also be seen in A. Bar = 100 m. Final
magnification =
× 90.5.
Host Immune Responses Against DHBV 9
transient DHBV infections or following challenge of immune ducks with high doses of
DHBV (3; A. Jilbert, unpublished data).
1.3. Detection of Antigens, Antibodies, and Viral DNA in Duck Serum
Antibody responses to the HBV surface, core, and e antigens have been detected in
the sera of humans following transient HBV infection. Anti-surface (anti-HBs) antibod-
ies are a marker of resolution of transient HBV infection. In chronic HBV infection,
antibodies to the viral surface proteins are generally not detected in serum, although it
is possible their presence is masked by the formation of immune complexes with sur-
face antigen particles. Antibodies to the HBV core protein (anti-HBc antibodies) can be
readily detected in the sera of patients with chronic HBV infection as can antibodies to
e antigen (anti-HBe antibodies) that develop following seroconversion from e antigene-
mia. Anti-HBe antibodies are unable to neutralize viral infectivity.
ELISAs have been developed for quantitation of DHBsAg (Fig. 6) and detection of
anti-DHBs (Fig. 7A) and anti-DHBc (Fig. 7B) antibodies. In the DHBsAg ELISA rab-
bit anti-DHBs antibodies (see Subheading 3.3.1.) are used to coat the plates and cap-
ture DHBsAg from duck serum samples. Bound DHBsAg is then detected using
anti-DHBV pre-S/S monoclonal antibodies (1H.1; 28). In the anti-DHBs ELISA the
Fig. 5. (A) A section of formalin-fixed duck liver collected at autopsy 24 h after intravenous
inoculation with 165 mg/kg body wt of colloidal carbon. Phagocytic (Kupffer) cells located
within the hepatic sinusoids have taken up carbon. Counterstained with hematoxylin and eosin.
(B). Section of ethanol-fixed duck liver after immunostaining with the 2E.12 monoclonal anti-
bodies specific for duck Kupffer and phagocytic cells. Stained cells are located within the hepatic
sinusoids. Counterstained with hematoxylin. (C) A section of ethanol–acetic acid fixed duck liver
collected from an adult duck (B47) 5 d following intravenous inoculation with a high dose of
DHBV. Detection of DHBV pre-S/S antigen in the cytoplasm of hepatocytes using anti-DHBV
pre-S/S monoclonal antibodies (1H.1). Counterstained with hematoxylin. Bar = 100 m. Final
magnification A–C = × 163.
10 Miller et al.
plates are coated with 1H.1, followed by sucrose gradient purified DHBsAg to capture
the antibodies, and bound antibodies are detected using rabbit anti-duck IgY. In the anti-
DHBc ELISA plates are coated with rDHBcAg (1), and bound antibodies are again
detected using rabbit anti-duck IgY antibodies. Rabbit anti-duck IgY antibodies are pre-
pared by immunization of rabbits with duck IgY from egg yolk (18; see Subheadings
3.3.2. and 3.3.3.). The ELISAs for detection of anti-DHBs and anti-DHBc antibodies
thus detect total bound Ig and allow investigation of the overall humoral responses to
DHBV infection (2–5) but do not distinguish between IgM, IgY, and IgY (⌬Fc) (29)
subtype antibodies.
In congenitally DHBV-infected ducks, anti-DHBc antibodies can be detected in
the serum from approx 80 d post-hatch (4), while in experimentally DHBV-infected
ducks anti-DHBc antibodies are detected from as early as 7–10 d post-inoculation and
Fig. 6. (A) Diagrammatic representation of the quantitative ELISA used to detect DHBsAg in
duck sera. (B) A typical standard curve for the quantitative DHBsAg ELISA generated using high
titer DHBV-positive duck serum and NDS (negative control). The levels of DHBsAg in test sam-
ples are calculated using the standard curves. The cutoff for negative/positive results is set at three
times the standard deviation from the mean value obtained with NDS.
Host Immune Responses Against DHBV 11
persist throughout the course of infection (4). Anti-DHBs antibodies are detected at
high levels only in the sera of ducks that have resolved their DHBV infection, but can
also be detected at low levels in the sera of congenitally and experimentally DHBV-
infected ducks with persistent DHBV infection (Wendy Foster, personal communica-
tion). In this case anti-DHBs antibodies may be masked by the formation of immune
complexes between the anti-DHBs antibodies and circulating DHBsAg.
Detailed analyses of humoral immune responses to DHBV infection have been per-
formed in 4-mo-old ducks inoculated with 1 × 10
3
,1 × 10
6
,1 × 10
9
or 2 × 10
11
DHBV
genomes (3). In these studies increasing the dose of inoculated virus shortened the time
to appearance and increased the levels of detectable antibodies. An increase in the
inoculum from 1 × 10
9
to 2 × 10
11
DHBV genomes resulted in Ͼ1 log increases in anti-
Fig. 7. (A) Diagrammatic representation of the ELISA used to detect anti-DHBs antibodies.
Levels of anti-DHBs antibodies are expressed as the reciprocal of the log serum dilution that
gives an OD of 0.4 at an absorbance of 490 nm. (B) Diagrammatic representation of the ELISA
used to detect anti-DHBc antibodies. Levels of anti-DHBc antibodies are expressed as the recip-
rocal of the log serum dilution that gave an OD of 0.5 at an absorbance of 490 nm.
12 Miller et al.
DHBc antibodies that reflected the extensive infection of the liver observed in these
ducks on d 9–12 post-inoculation. Two of the three 4-mo-old ducks receiving the high-
est dose of virus were able to resolve their DHBV infection, and developed anti-DHBs
antibodies.
2. Materials
2.1. Purification and Characterization
of Duck Lymphocytes and Thrombocytes from Peripheral Blood
2.1.1. Solutions
1. Ficoll-Paque (Pharmacia, Uppsala, Sweden).
2. Hanks’ balanced salt solution (HBSS), supplemented with 100 IU/mL of penicillin and 100
g/mL of streptomycin, is used to prepare and wash cell suspensions.
3. Heat-inactivated (20 min at 56°C) normal duck serum (NDS): Each batch of NDS is tested to
ensure that it does not stimulate or maintain proliferation of duck lymphocytes when added
to culture medium.
4. Cell culture medium (CM): RPMI-1640 (Gibco Laboratories, Grand Island, NY) with
2 mmol/L of
L-glutamine, 0.1 mmol/L of -mercaptoethanol, 5 g/mL of indomethacin, and
5% NDS (see Note 2).
5. PBS: 0.1 M phosphate-buffered saline, pH 7.2.
6. P/B/A: PBS with 0.1% bovine serum albumin (BSA), 0.1 % azide.
7. P/A: PBS with 0.1% azide.
8. Trypan blue for viable cell counting.
9. Phytohemagglutinin-P (PHA; Difco, Michigan, USA) is used for stimulation of duck lym-
phocytes and is made up as a stock of 1 mg/mL in PBS.
10. Rabbit anti-human CD3⑀ antiserum (DAKO, Denmark, cat. no. A 452) is an affinity-isolated
polyclonal antiserum. It reacts to amino acids 156–168 (intracellular) of the human CD3⑀
chain and cross-reacts with duck T cells.
11. Intracellular staining solution: 45% acetone, 9.25% paraformaldehyde in PBS.
12. Normal sheep serum (NSS).
13. Fluorescein isothiocyanate (FITC)–anti-rabbit IgG and FITC–anti-mouse IgG (Silenus).
14. Cell culture supernatant from the cell line BA3, producing monoclonal antibodies specific
for duck thrombocytes (the cell line is available from the authors on request).
15. 1% Paraformaldehyde in PBS.
16. [
3
H]Thymidine, 1 Ci/50 L of CM (Amersham).
2.1.2. Equipment
1. 10-mL syringes with 21-gauge needles.
2. Heparinized 10-mL blood collection tubes.
3. 10- and 50-mL centrifuge tubes.
4. Benchtop centrifuge (200–400g).
5. Biohazard hood.
6. Tissue culture quality pipets and pipettor (1 L–10 mL volumes).
7. Hemocytometer and microscope.
8. Nylon wool columns: Each nylon wool (NW; Pacific Diagnostics) column consisted of 0.32
g of sterile NW in a 5-mL syringe wrapped in aluminum foil and autoclaved.
9. Parafilm.
Host Immune Responses Against DHBV 13
10. 24-well tissue culture trays (Corning, cat. no. 25820).
11. 96-well tissue culture trays (Falcon, cat. no. 3072).
12. 25-cm
2
tissue culture flasks (Corning, cat. no. 25100-25).
13. Humidified incubator set at 37°C.
14. Flow cytometry tubes.
15. Flow cytometer (FACscan, Becton-Dickinson).
16. Tray shaker (Titertek).
17. Flow cell harvester (Flow Laboratories).
18. Glass fiber discs (Flow Laboratories).
19. -counter (Beckman).
2.1.3. Samples for Study
Pekin-Aylesbury (Anas platyrhynchos) crossbred ducks were used for all experi-
ments and were obtained at 1 d of age from commercial duck suppliers in Australia
known to carry DHBV-negative or congenitally DHBV-infected ducks.
2.2. Histological Methods for Detection
of Cellular and Viral Antigens in Duck Tissues
2.2.1. Solutions
1. 10% buffered formalin in PBS.
2. Glacial acetic acid (AR grade).
3. Xylene (AR grade—toxic and must be used in a fume hood).
4. Ethanol (AR grade; 100%) and diluted with distilled water to 95% and 70%.
5. PBS, pH 7.2.
6. Methanol (AR grade).
7. 10 mM Citrate buffer, pH 6.0.
8. Trypsin (grade II, 0.25 mg/mL) in PBS, pH 7.2.
9. Normal horse serum (NHS).
10. Rabbit anti-human CD3⑀ antiserum (DAKO, Denmark, cat. no. A 452).
11. Normal rabbit serum (NRS) for use as a negative control.
12. Monoclonal anti-duck DHBV pre-S/S antibodies (1H.1; 28).
13. Monoclonal anti-duck Kupffer cell antibodies, 2E.12 (provided by Dr. John Pugh).
14. Polyclonal rabbit anti-recombinant DHBV core antigen (rDHBcAg) (1).
15. Biotin–anti-rabbit Ig (Vectorstain ABC kit, Burlingame, CA, USA).
16. Streptavidin–horseradish peroxidase (HRP) (Vectorstain ABC kit, Burlingame, CA, USA).
17. Sheep anti-mouse HRP (Amersham, cat. no. NA 9310).
18. Goat anti-rabbit antiserum HRP (Kirkegaard and Perry Laboratories, Gaithersburg, MD).
19. 0.5 mg/mL of diaminobenzidine tetrahydrochloride (DAB; Sigma, cat. no. D-5637) in PBS.
Caution: DAB is toxic and the powder must be handled with care and dissolved and
aliquoted in a fume hood. Store frozen at −20°C.
20. H
2
O
2
.
21. Mayer’s hematoxylin solution.
22. Methyl green.
23. DePeX mounting medium (Gurr Microscopy Products).
14 Miller et al.
24. Colloidal carbon prepared from Indian ink (Educational Colours, Melbourne) should be dia-
lyzed against saline and autoclaved, then mixed with 20 mg/mL of autoclaved gelatin in
saline at 56°C. Finally, the carbon–gelatin mix should be filtered through a 0.8-m filter to
remove any clumps.
25. Fetal calf serum (FCS).
2.2.2. Equipment
1. Glass slides and coverslips.
2. Slide racks.
3. Slide staining chambers.
4. Magnetic stirrer and stirring rods.
5. Microwaves: Toshiba 1000 W and NEC (model 702).
6. “PAP pen” (Dakopatts, USA).
7. Humidified chamber.
8. Incubator set at 37°C.
2.3. Detection of Antigens, Antibodies,
and Viral DNA in Duck Serum
2.3.1. Solutions
1. TBS: 10 mM Tris-HCl, pH 8.7; 140 mM NaCl, with 0.1% sodium azide.
2. 1% (w/v) dextran sulfate in TBS.
3. TN: 10 mM Tris-HCl, pH 7.4; 150 mM NaCl.
4. 66% (w/v) sucrose solutions in TN.
5. 1 M Tris-HCl, pH 9.0.
6. Saturated sodium sulfate solution.
7. Saturated ammonium sulfate solution.
8. PBS containing 0.05% Tween-20 (PBS/T).
9. 5% SM–PBS/T: 5% Skim milk in PBS/T.
10. o-Phenylenediamine (OPD) (Sigma, cat. no. P9187).
11. 0.1% BSA in PBS.
12. 2.5 M H
2
SO
4
.
13. Recombinant DHBV core antigen (rDHBcAg) (1).
14. Sheep anti-mouse HRP (Amersham, cat. no. NA 9310).
15. Anti-DHBV pre-S/S monoclonal antibodies (1H.1; 28).
16. Rabbit anti-duck IgY antibodies (see Subheading 3.3.3.).
17. Ammonium sulfate precipitated rabbit anti-DHBs antibodies (see Subheading 3.3.4.).
18. Goat anti-rabbit HRP (Kirkegaard and Perry Laboratories, Gaithsburg, MD).
19. 20% Polyethylene glycol 6000 (PEG) dissolved in 1 M NaCl.
20. 0.7% NaOH.
21. 3-Aminopropyl-triethoxysilane (Sigma, cat. no. A3648).
22. PCR reagents: 20 M of each primer, 10X PCR reaction buffer, 200 M dNTPs, 1.64 mM
MgCl
2
, Taq polymerase (Geneworks, Adelaide, cat. no. BTQ-1).
23. Forward PCR primer 2554: TTCGGAGCTGCCTGCCAAGG.
24. Reverse PCR primer 269c: GGAGCACCTGAGCTTGGATC.
25. 500 mM Tris-HCl, pH 6.8.
26. 0.06 M acetate buffer, pH 4.0. (Add 6.9 mL of glacial acetic acid to 2 L of distilled water.
Add 0.756 g of NaOH).
Host Immune Responses Against DHBV 15
2.3.2. Equipment
1. Dialysis tubing.
2. Whatman No. 1 paper.
3. Whatman No. 2 paper.
4. Beckman L8-80 centrifuge.
5. 50-mL polycarbonate Oakridge tubes.
6. Polypropylene centrifuge tubes (Beckman, cat. no. 331372).
7. Beckman SW-41 rotor and centrifuge.
8. 96-well flat-bottom ELISA trays (Corning Inc., cat. no. Costar 3590).
9. Dynatech MR 5000 plate reader set at a wavelength of 490 nm.
10. Microfuge.
11. Microfuge tubes.
12. Gene Amp 2400 PCR machine (Perkin Elmer).
13. Bicinchoninic acid protein assay kit (Sigma, cat. no. BCA-1).
3. Methods
3.1. Methods for Purification and Characterization
of Duck Lymphocytes and Thrombocytes from Peripheral Blood
3.1.1. Purification of PBMCs
1. Using a 21-gauge needle and a 10-mL syringe collect 10–20 mL of blood from the jugular
vein of a duck and dilute into an equal volume of HBSS in heparinized collection tubes. Mix
well. (See Note 3.)
2. Carefully layer 3 mL of diluted blood over 3 mL of Ficoll-Paque at 4°C.
3. Centrifuge at 200g for 20 min at room temperature (RT) and collect the PBMCs present both
at the plasma Ficoll-Paque interface and within the Ficoll-Paque layer above the red cell pel-
let. (See Note 4.)
4. Wash cells three times in HBSS and count cell numbers of the collected PBMCs using a
hemocytometer and a microscope with a × 40 objective.
5. For nylon wool fractionated PBMCs, equilibrate each nylon wool column by adding CM,
seal the ends with parafilm, and incubate for 1 h at 37°C. Make sure there are no air pockets
in the column.
6. Load 5 × 10
7
duck PBMCs in 1.25 mL of CM warmed to 37°C onto each nylon wool column
and incubate at 37°C in an atmosphere of 5% CO
2
in air. Collect the cells that do not adhere
to nylon wool by washing each column with 6.5 mL of CM warmed to 37°C. Count the cells
and resuspend in CM to the appropriate concentration. (See Note 5.)
3.1.2. Flow Cytometry Detection of T Lymphocytes by
Intracellular Staining for CD3⑀
1. Wash 10
7
PBMCs (from Subheading 3.1.1., step 4) two times in PBS by centrifuging at
200g for 8 min at 4°C, then remove the supernatant and carefully add a solution containing
45% acetone, 9.25% paraformaldehyde in PBS. Vortex-mix for 10 s, then wash three times
with cold P/B/A. Treatment with this solution will make the cells permeable to antibodies;
however, this process will also lead to some cell loss.
2. An indirect method is used to stain the cells. Incubate the cells with rabbit anti-human CD3⑀
antiserum (1:50 dilution) or NRS in P/B/A containing 10% NSS for 45 min at 4°C.
16 Miller et al.
3. Wash the cells in P/B/A and incubate with FITC-conjugated sheep anti-rabbit IgG (1:100
dilution preadsorbed for 60 min by the addition of 10% NDS) for 45 min at 4°C.
4. Wash the cells once in P/B/A at 4°C, then once in P/A at 4°C, and then add 500 L of 1%
paraformaldehyde in PBS to the cell pellet. Paraformaldehyde-fixed cells can be stored for
several weeks at 4°C or analyzed immediately by FACScan (Becton-Dickinson).
5. Examples of FACScan analysis of single cell suspensions of duck lymphoid organs and PHA-
stimulated PBMCs stained with rabbit anti-human CD3⑀ antiserum are shown in Fig. 1.
3.1.3. Flow Cytometry Detection
of Thrombocytes Using BA3 Monoclonal Antibodies
1. Wash 10
6
PBMCs two times in P/B/A and incubate with cell culture supernatant from the
mouse hybridoma cell line BA3 containing 10% NSS for 45 min at 4°C.
2. Wash the cells two times in P/B/A and incubate with FITC-conjugated sheep anti-mouse Ig
(1:100 dilution preadsorbed for 60 min by the addition of 10% NDS) for 45 min at 4°C and
wash and fix in 1% paraformaldehyde before FACScan analysis as described above.
3. Alternatively, if BA3 monoclonal antibodies are not available, flow cytometry can be used to
identify thrombocytes from lymphocytes by their increased side scatter. FACScan analysis
of duck PBMCs and detection of thrombocytes with BA3 monoclonal antibodies is shown in
Fig. 2.
3.1.4. Conditions for In Vitro Growth and Lectin Stimulation of Duck PBMCs
1. Purification of adherent cells (monocytes): Load 8 × 10
5
duck PBMCs in 50 L of CM onto
each well of a flat-bottomed 96-well tray and incubate for 1 h at 37°C in 5% CO
2
. Shake
trays for 30 s on a tray shaker and remove the nonadherent cells. Wash the wells two times
with 200 L of CM.
2. Purification of DRBC: Take 0.1 mL of DRBCs from the pellet beneath the Ficoll-Paque solu-
tion used to prepare duck PBMCs. Wash the DRBC three times in HBSS and resuspend in
CM to 4 × 10
6
cells/mL for use in the in vitro proliferation assay. (See Note 6.)
3. Add 8 × 10
5
cells/well of nylon wool fractionated duck PBMCs in 100 L of CM to the
adherent monocytes in each well of a 96-well tray. Add 4 × 10
5
DRBCs/well in 50 L and
culture with 5 g/mL of PHA in CM. (See Note 7.)
4. Culture cells for 4–6 d at 37°C in sealed boxes in a gas phase of 10% CO
2
, 7% O
2
, and 83%
N
2
. Proliferation is measured by addition of 50 L of CM containing 1 Ci of [
3
H]thymidine
to each well and incubating for a further 4 h. (See Note 8.)
5. Harvest cells onto glass fiber discs using a flow cell harvester. The amount of radioactivity
incorporated is measured using a -counter. The results are expressed as counts per minute
(cpm; mean ± SEM) for each quadruplicate set of cultures.
6. A comparison of the in vitro T cell responses of PBMCs from eight different ducks to 5
g/mL of PHA is shown in Fig. 3.
3.1.5. Measurement of a Duck Interleukin-2 (IL-2)-Like Cytokine
1. Production of a duck IL-2-like cytokine: Take 10
8
Ficoll-Paque fractionated PBMCs pre-
pared from individual ducks and resuspend in 5 mL of CM containing 20 g/mL of PHA and
incubate in 25-cm
2
flasks at 37°C in 10% CO
2
in air for 2.5 h. Duck PBMCs, in the presence
of PHA, behave like mammalian PBMCs in that most of the cells readily adhere to the plas-
tic surface after settling in the flask. Wash the cells that have attached to the flask three times
in warm HBSS to remove unbound PHA and incubate them with 5 mL of fresh CM at 37°C
in 10% CO
2
in air for a further 24 h. Harvest the supernatant from each culture and store at
Host Immune Responses Against DHBV 17
−20°C to assay for the ability to maintain the proliferation of duck lymphoblasts (described
in step 3 below).
2. Production of duck T lymphoblasts: Culture 8 × 10
6
Ficoll-Paque fractionated duck PBMCs
in each well of a 24-well tray in 2 mL of CM with 5 g/mL of PHA. After 4 d in culture at
37°C in a sealed box in a gas phase of 10% CO
2
, 7% O
2
, and 83% N
2
, pool lymphoblasts and
wash four times in CM before resuspending at 2.5 × 10
5
cells/mL in CM.
3. Cytokine assay: Prepare duplicate 8 × twofold dilutions of each test supernatant in 100-L
volumes in CM in a 96-well tray. Add 100 L of freshly prepared duck T lymphoblasts to
each well and incubate for 20 h at 37°C in an atmosphere of 5% CO
2
in air. At this time pulse
the tray for 4 h with [
3
H]thymidine and measure cell proliferation as described above.
3.2. Histological Methods for Detection
of Cellular and Viral Antigens in Duck Tissues
3.2.1. Tissue Sample Preparation for Histological and Immunoperoxidase
Staining of T Lymphocytes, Kupffer Cells, and DHBV Antigens (See Note 9)
1. For routine histological examination and immunostaining of CD3⑀ antigens, fix tissue sam-
ples in 10% formalin in PBS overnight at RT.
2. For the immunostaining of Kupffer cells in the liver and phagocytic cells in the spleen, fix
tissue samples in 95% AR ethanol for 1 h at RT then overnight at 4°C.
3. For the immunostaining of DHBV antigens in liver and other tissues, fix samples in
ethanol–acetic acid (3:1) for 30 min at RT followed by a post-fixation in 70% AR ethanol
overnight at 4°C.
4. Embed tissues, post-fixation, in paraffin wax using a short cycle on an automatic tissue pro-
cessing machine (a representative short cycle is: 100% ethanol for 1 × 20 min, 1 × 10 min, 1
× 15 min, 1 × 30 min at 45°C with vacuum; 100% chloroform, 1 × 20 min, 1 × 10 min, 1 ×
20 min at 45°C without vacuum; paraffin wax, 1 × 30 min, 1 × 20 min at 65°C with vacuum).
5. Section the embedded tissue at a thickness of 6 m onto glass microscope slides previously
coated with 3-aminopropyltriethoxysilane.
6. Dry the tissue sections on slides overnight at 37°C prior to use to help with adherence of the
sections to the slides.
3.2.2. Identification of Duck T Lymphocytes in Tissue Sections
Using Anti-human CD3⑀ Polyclonal Antibodies
1. Dewax sections of formalin-fixed, paraffin-wax-embedded tissues from duck liver, spleen,
thymus, and bursa in AR xylene (2 × 5 min) and rehydrate through graded concentrations of
AR ethanol (2 min each in 100%, 95%, 70%) followed by 2 min in PBS.
2. Treat sections for 30 min with 0.5% H
2
O
2
in PBS to block endogenous peroxidase.
3. After air-drying, wash sections several times in deionized water and heat to just below boil-
ing point in a microwave oven for 10 min in 10 mM citrate buffer, pH 6.0. (See Note 10.)
4. Cool sections to RT (approx 25 min) and treat with trypsin (grade II, 0.25 mg/mL in PBS)
for 3 min.
5. “PAP” pen around the sections and place in PBS for 5 min
6. Block the sections with 3% NHS for 30 min at RT.
7. Drain excess NHS and add 100 L per section of either rabbit anti-human CD3⑀ antiserum
or rabbit control antiserum (each diluted in 3% NHS in PBS), and incubate under a coverslip
and in a humidified chamber overnight at 4°C. (See Note 11.)
18 Miller et al.
8. Wash sections 2 × 3 min in PBS and incubate with biotin-labeled anti-rabbit Ig for 30 min.
9. Wash sections 2 × 3 min in PBS and incubate with streptavidin-labeled HRP for 30 min.
10. Wash sections 2 × 3 min in PBS and develop with 0.5 mg/mL of DAB in PBS containing
0.03% H
2
O
2
.
11. Counterstain in Mayer’s hematoxylin for liver and spleen and methyl green for thymus and
bursa, then dehydrate through AR ethanol and AR xylene and mount with DePeX.
3.2.3. Identification of Kupffer Cells in the Liver
and Phagocytic Cells in the Spleen Using Colloidal Carbon
1. Intravenously inoculate the duck with 165 mg/kg body wt of colloidal carbon in 20 mg/mL
of gelatin saline.
2. Autopsy the duck 24 or 48 h after injection.
3. Sample liver and spleen tissues and fix in 10% formalin or 95% AR ethanol and embed and
section onto glass slides as described above.
4. Cells that have taken up colloidal carbon can be identified in formalin-fixed hematoxylin and
eosin stained sections as phagocytic Kupffer cells located in the sinusoids of the liver lobule
(Fig. 5A) and as phagocytic cells located in the periellipsoid sheath region of the spleen.
Phagocytic cells have been previously identified in chicken spleen as ellipsoid associated
cells (24,25).
3.2.4. Immunoperoxidase Staining of DHBV Antigens
and Kupffer Cells in Tissue Sections
1. Dewax tissue sections on slides with 2 × 5 min washes in AR xylene and then rehydrate with
2 × 2 min washes in AR ethanol (100%, 90%, 70%) followed by 2 × 5 min washes in PBS.
2. Inactivate endogenous peroxidase by incubation of the slides in 0.5% H
2
O
2
in PBS for 15
min at RT.
3. Wash slides for 2 × 5 min in PBS and block with a 1:30 dilution of NSS in PBS. Incubate for
30 min at RT.
4. Primary antibodies: Monoclonal anti-DHBV pre-S/S (1H.1; 28), monoclonal anti-Kupffer
cell, 2E.12 or polyclonal rabbit anti-rDHBcAg antibodies. Dilute each of the primary anti-
bodies to 1:100 in PBS containing 10% FCS. Incubate each tissue section under a coverslip
with 100 L of the diluted antibodies for 1 h at 37°C and then at 4°C overnight. (See Note
11.) Wash slides 2 × 5 min in PBS.
5. Add the sheep anti-mouse HRP-conjugated secondary antibodies or the goat anti-rabbit HRP
conjugated antibodies at a dilution of 1:40 in PBS containing 10% FCS. Incubate slides at
37°C for 1 h. Wash slides 2 × 5 min in PBS.
6. Develop the slides by the addition of DAB solution (1 mL or 0.5 mg/mL of DAB, 12.5 L of
30% H
2
O
2
, 10 mL of PBS) for 9 min at RT in the dark.
7. Wash with PBS and counterstain with Mayer’s hematoxylin for 1 min.
8. Remove excess hematoxylin from slides with 3 × 2 min washes in PBS.
9. Dehydrate slides with 2 × 2 min washes in AR ethanol (70%, 90%, 100%) and 2 × 5 min
washes in xylene.
10. Finally, mount sections under coverslips in DePeX.
11. Cells that react with the 2E.12 monoclonal antibodies can be identified in ethanol-fixed and
hematoxylin counterstained sections as Kupffer cells located in the hepatic sinusoids (Fig.
5B).
12. DHBV-infected hepatocytes can be identified in ethanol–acetic acid fixed sections of duck
liver using the 1H.1 monoclonal antibodies (Fig. 5C) or polyclonal anti-rDHBcAg antibod-
Host Immune Responses Against DHBV 19
ies. Infected cells are randomly scattered throughout the liver lobule and viral surface and
core antigens are detected in the cytoplasm but not in the nucleus of infected cells.
3.3. Methods for Detection of Antigens, Antibodies,
and Viral DNA in Duck Serum
3.3.1. Preparation of DHBsAg for Immunization of Rabbits
and as Capture Antigen for the Anti-DHBs ELISA
1. Load 5-mL samples of high-titer DHBV-positive duck sera onto 5 mL of a 20% (w/v)
sucrose in TN that has been underlaid with a 500-L cushion of 66% (w/v) sucrose in TN.
2. Place tubes in a SW-41 rotor and centrifuge at 190,000g for 4 h at 4°C.
3. Following centrifugation, collect 500-L fractions from the bottom of the tubes.
4. When used as a capture antigen for detection of anti-DHBS antibodies, DHBsAg is prepared
by pooling fractions 2–6 from the gradients and diluting to 5 mL with 0.1% BSA in PBS.
5. DHBsAg to be used as an immunogen for antibody production must be further purified; load
2 mL of fractions 2–6 containing DHBsAg onto a linear sucrose gradient consisting of
20–40% (w/v) sucrose in TN.
6. Centrifuge for 3 h at 190,000g at 4°C.
7. Following centrifugation, collect 500-L fractions from the bottom of the gradient.
8. Electrophorese 50 L from each fraction on a denaturing polyacrylamide gel to determine
which fraction contains the most DHBsAg with the least amount of contaminating protein.
9. Use the purified DHBsAg for the immunization of rabbits by following the protocol for pro-
duction of high-titer antibodies.
3.3.2. Preparation of Duck IgY from Duck Egg Yolk
1. Separate the yolks from 12 eggs and mix with 200 mL TBS and 30 mL of 1% (w/v) dextran
sulfate in TBS.
2. Incubate for 30 min at RT and then add 75 mL of 1 M CaCl
2
.
3. Centrifuge at 2000g for 30 min at 10°C.
4. Filter the supernatant through Whatman No.1 paper.
5. To this filtrate slowly add saturated ammonium sulfate, while constantly mixing, until a final
concentration of 50% saturation is achieved.
6. Mix for 30 min at RT and then centrifuge the precipitate at 2500g for 30 min at 10°C.
7. Redissolve the precipitate in 50 mL of TBS and recentrifuge at 2500g. Collect the supernatant.
8. Slowly add saturated sodium sulfate until 50% saturation has been achieved and centrifuge
at 2500g for 30 min at 10°C.
9. Redissolve the pellet in 50 mL of TBS and then add saturated sodium sulfate to a final con-
centration of 14%.
10. Mix for 2 h at RT. Centrifuge the precipitate at 5000g for 30 min at 10°C.
11. Repeat steps 9 and 10 two more times.
12. Dialyze the resuspended pellet overnight against TBS.
13. Determine the protein concentration of the antigen using the bicinchoninic acid protein assay.
14. Determine the purity of the IgY using polyacrylamide gel electrophoresis (PAGE) analysis.
3.3.3. Protocol for the Production of High-Titer Antibodies
Against DHBsAg and Duck IgY.
1. The purified protein (DHBsAg or IgY) should be diluted to 1 mg/mL in TBS.
2. Emulsify 100–200 g of the protein in Freund’s complete adjuvant.
20 Miller et al.
3. Inject rabbits subcutaneously at 5–10 sites with the antigen–adjuvant mix.
4. Repeat the immunization two times at 1-mo intervals using 100–200 g of protein in Fre-
und’s incomplete adjuvant.
5. Two weeks after each immunization a test bleed should be taken and tested for antibodies.
6. Euthanize and exsanguinate the animal when the antibody titer is sufficiently high.
7. Collect whole blood and incubate for 1 h at 37°C and then at 4°C overnight.
8. Centrifuge at 4000g, collect the serum, and add 0.05% sodium azide. Store at 4°C.
3.3.4. Ammonium Sulfate Precipitation of Rabbit Anti-DHBsAg Antibodies
1. Place 100 mL of rabbit serum into a beaker.
2. Add 200 mL of acetate buffer (0.06 M, pH 4.0).
3. Add 7.5 mL of octanoic acid and stir vigorously for 2 h.
4. Filter through Whatman No. 2.
5. To each 100 mL of filtrate add 4.0 mL of 1 M Tris-HCl, pH 9.0, and then 26 g of solid ammo-
nium sulfate. Stir at 4°C for 2 h.
6. Centrifuge at 12,000g for 30 min.
7. Redissolve the precipitate in approx 25% of the original serum volume.
8. Dialyze overnight against TBS.
9. Centrifuge at 12,000g for 30 min.
10. Measure the protein concentration of the supernatant.
11. Dilute to 1 mg/mL in TBS. Store at −20°C.
3.3.5. Detection of DHBsAg Using a Quantitative ELISA (See Notes 12–14)
1. Coat trays with ammonium sulfate-precipitated rabbit anti-DHBsAg antibodies at a dilution
of 1:500 in bicarbonate buffer, pH 9.6, and incubate at 37°C for 1 h and then at 4°C until use.
2. Block wells with 200 L of 5% SM-PBS/T.
3. Set up standard curves at this stage. Use pooled serum from congenitally DHBV-infected
ducks, diluted initially at a 1:1000 dilution in PBS and then twofold across the plate to a
final dilution of 1:128,000 in PBS. To standardize the amount of serum proteins present
in both test samples and in the standard curve, NDS is added to all dilutions at the same
concentration as the sample being tested. That is, either a 1:100 dilution of NDS in PBS
or 1:4000 dilution of NDS in PBS is also added to the appropriate standard curves. (See
Note 15.)
4. Add test samples to the plate at a dilution of 1:100 in PBS for low-titer samples, and 1:4000
in PBS for high-titer samples. All samples and standards should be added to the plates in
duplicate.
5. Add the 1H.1 monoclonal antibodies diluted to 1:1000. (See Note 16.)
6. Finally, add the sheep anti-mouse HRP conjugated antibodies. For serum samples tested at a
1:100 dilution, the conjugated antibodies are diluted 1:500 in 5% SM-PBS/T + 5% NSS +
5% NRS. For serum samples tested at a dilution of 1:4000, the conjugated antibodies are
added to the plate at a dilution of 1:4000 in 5% SM-PBS/T alone.
7. The cutoff for negative/positive results is set at three times the standard deviation from the
mean value obtained with NDS.
8. The levels of DHBsAg are then calculated by extrapolation from the standard curve from
each individual plate assuming that the original pooled serum contained a previously calcu-
lated amount of DHBsAg. (See Note 17.)
Host Immune Responses Against DHBV 21
3.3.6. Detection of Duck Anti-DHBs Antibodies
by Indirect ELISA (See Notes 12–14)
1. Coat the wells of a 96-well tray with 1:1000 dilution of the anti-DHBV pre-S/S 1H.1 mono-
clonal antibodies in bicarbonate buffer pH 9.6 for 1 h at 37°C and then at 4°C until use.
2. Block the wells of tray with 200 L/well of 5% SM-PBS/T and incubate for 1 h at 37°C.
3. Add sucrose gradient purified DHBsAg (see Subheading 3.3.1.4.) diluted in 0.1% BSA to
the wells of the plate.
4. The test duck serum is added at a dilution of 1:50 and titrated fivefold across the plate to a
final dilution of 1:6250. (See Note 16.)
5. Add the rabbit anti-duck IgY antibodies at a dilution of 1:15,000.
6. Finally, add the goat anti-rabbit HRP-conjugated antibodies at a dilution of 1:5000.
7. Antibody titers should be expressed as the reciprocal of the log serum dilution that gave an
OD of 0.4 at 490 nm. (See Note 17.)
3.3.7. Detection of Anti-DHBc Antibodies by Indirect ELISA (See Notes 12–14)
1. Coat trays with 1 g/mL rDHBcAg (1) diluted in PBS for 1 h at 37°C and then at 4°C until
use.
2. Block wells with 200 L of 5% SM-PBS/T.
3. Add the test duck serum to the plate at a dilution of 1:500 and serially dilute fivefold across
the plate to a final dilution of 1:62,500.
4. Add the rabbit anti-duck IgY antibodies diluted to 1:15,000.
5. Finally, add the goat anti-rabbit HRP conjugated antibodies at a dilution of 1:5000.
6. Antibody titers should be expressed as the reciprocal of the log serum dilution that gave an
OD of 0.5 at 490 nm. (See Note 17.)
3.3.8. PEG Precipitation of DHBV from Serum for PCR Analysis
1. Add 200 L of serum to a microfuge tube with 100 L of PEG diluted in 1 M NaCl.
2. Vortex the tube vigorously and then centrifuge at 14,000g in a microfuge for 10 min at RT.
3. Carefully remove the supernatant and discard.
4. Add 100 L of 0.7% NaOH to the pellet and again vigorously vortex prior to incubation for
1 h at 60°C.
5. Following incubation, add 100 L of 500 mM Tris-HCl, pH 6.8, and vortex the tube again.
6. Incubate for a further 15 min at 95°C.
7. Finally the sample should be centrifuged for 5 min, and the supernatant collected and used
immediately in PCR or stored at −20°C.
3.3.9. PCR of Duck Serum to Detect DHBV DNA
1. A standard 50-L PCR reaction mix is used containing 20 M of each oligonucleotide
primer specific for the DHBV sequence, 1X reaction buffer, 200 M dNTPs, 1.64 mM
MgCl
2
, and 1 U of Taq polymerase for each reaction.
2. The program for the PCR reaction is set at 30 cycles of 95°C for 30 s, 55°C for 45 s, and
72°C for 45 s.
3. Ten microliters of duck serum that has been extracted via the PEG precipitation method is
used as the template for each PCR reaction.
4. View products on agarose gels using ethidium bromide.
5. The lower limit of sensitivity of the assay is approx 150 DHBV genomes/mL of serum.
22 Miller et al.
4. Notes
1. A range of cDNA clones for duck CD3⑀; CD4; CD8␣; CD44; CD58; IL-18; TCR␣, , ␥, and
␦; and MHC I and MHC II (10–13,30–39) were recently cloned by Professor David Higgins
and colleagues in Hong Kong. The clones can be used in Northern blot hybridization and
reverse transcription (RT)-PCR to monitor the relative levels of mRNA expression at the
sites of DHBV infection and also provide the potential for development of antibody reagents
for the duck immune system. Hence, they are likely to provide important insights into the
different types of immune responses occurring in both acute and persistent DHBV infec-
tions, ultimately assisting in the development of vaccines for the treatment of persistent
infections.
2. 5% NDS is optimal for duck cell culture.
3. For optimal separation of duck PBMCs from DRBCs and granulocytes using Ficoll-Paque
solution, fast ducks for
Ͼ3 h before bleeding, as this reduces the fat content in blood sam-
ples.
4. Thrombocytes are present both at the plasma–Ficoll-Paque interface and in the Ficoll-Paque
layers between the interface and the red cell pellet. Collecting the clearly defined cell layer
at, but not below, the plasma–Ficoll-Paque interface can decrease the proportion of thrombo-
cytes in PBMC preparations.
5. The percentage of duck T lymphocytes in PBMCs recovered from Ficoll-Paque should be
22–26%, with enrichment of up to 50% after passing the cells through nylon wool columns.
6. Duck DRBCs are nucleated and they act as bystander or “filler” cells that enhance the level
of proliferation of duck T lymphocytes in cultures in which activation is suboptimal.
7. Ducks vary in their ability to respond to lectins such as PHA; therefore, a range of concen-
trations may be needed to find the optimal dose. We have found 5 g/mL of PHA to be opti-
mal with most duck lymphocyte preparations. Owing to the lack of reagents to identify
different duck cell types, it is not possible to determine why there is such variation.
8. Large syncytia form in some cultures of duck PBMCs and adherent cells, commonly occur-
ring after 3–7 d of in vitro culture. Cells with similar morphology, often called osteoclasts,
have been described in cultures of human (19), mouse (20), and chicken (21–23) PBMCs.
We have observed syncytia that range in size from 200 to 500 m in cultures of duck
PBMCs (Fig. 4A) and also duck adherent cells (monocytes) alone (Fig. 4B). The syncytia
are more commonly present in mitogen-stimulated cultures but are also observed in PBMC
cultures without the addition of PHA or ConA and are observed in cultures from both male
and female ducks. The presence of the syncytia often, but not always, heralds poor prolifer-
ation and low levels of thymidine incorporation in the cultures.
9. The effects of fixation on antigens within tissues can be drastic. Strict adherence to the sug-
gested fixation regimen for each antigen is strongly advised.
10. For detection of duck T lymphocytes using microwave-mediated antigen detection, the slides
are placed into two containers of citrate buffer solution (250 mL each) and then heated on
full power using a Toshiba 1000-W microwave oven until the buffer solution begins to boil.
The containers are then transferred to a NEC microwave oven (model 702) with the power
setting on level 2 (magnetron cycle: 6 s ON, 16 s OFF) for 10 min. This will allow the solu-
tion to reach almost the boiling point in a cyclic manner, thereby minimizing damage to tis-
sue sections during the heating process. Microwave-safe plastic jars and staining racks are
recommended for the microwave procedure.
11. Sections should not be allowed to dry out, as this leads to nonspecific staining.
Host Immune Responses Against DHBV 23
12. All serological assays should be performed in 96-well flat-bottom ELISA trays.
13. Incubations should be carried out for 1 h with 100 L of reagent per well unless stated oth-
erwise.
14. Following each step of the assay the ELISA plates should be washed three times with PBS
containing 0.05% Tween-20 (PBS/T) except when antibodies conjugated with HRP are pres-
ent. In this case the plates should be washed with PBS alone.
15. The actual concentration of DHBsAg is determined empirically for each pool of congenitally
infected serum to be used as a standard in the DHBsAg ELISA.
16. Antibodies should be diluted in 5% skim milk in PBS containing 0.05% Tween-20 (5% SM-
PBS/T).
17. Bound antibodies are visualized using 1 mg/mL of the substrate o-phenylenediamine (OPD)
(Sigma) for 15 min at RT in the dark. The reaction is then stopped by addition of 50 L of
2.5 M H
2
SO
4
to each well. Read optical densities (ODs) on a Dynatech MR 5000 plate reader
at a wavelength of 490 nm.
Acknowledgments
The techniques described in this chapter were developed in the Hepatitis Virus
Research Laboratory at the Institute of Medical and Veterinary Science and the Univer-
sity of Adelaide and were funded by project grants from the National Health and Med-
ical Research Council of Australia (NHMRC) and postgraduate research scholarship
(EMB) from the University of Adelaide. We are indebted to our colleague Professor
Chris Burrell and other staff and students from the laboratory who have contributed to
the work. We are also indebted to Dr. John Pugh for supply of the anti-duck Kupffer cell
(2E.12) and anti-DHBV pre-S/S (1H.1) monoclonal antibodies and to Professor David
Higgins and colleagues for the supply of the duck cell marker cDNA clones.
References
1. Jilbert, A. R., Wu, T-T., England, J.M., et al. (1992) Rapid resolution of duck hepatitis B
virus infections occurs after massive hepatocellular involvement. J. Virol. 66, 1377–1388.
2. Jilbert, A. R., Miller, D.S., Scougall, C. A., Turnbull, H. T., and Burrell, C. J. (1996) Kinetics
of duck hepatitis B virus infection following low dose virus inoculation: one virus DNA
genome is infectious in neonatal ducks. Virology 226, 338–345.
3. Jilbert, A. R., Botten, J. D., Miller, D.S., et al. (1998) Characterization of age- and dose-
related outcomes of duck hepatitis B virus infection. Virology 244, 273–282.
4. Jilbert, A. R. and Kotlarski, I. (2000) Immune responses to duck hepatitis B virus infection.
Dev. Comp. Immunol. 24, 285–302.
5. Triyatni, M., Jilbert, A. R., Qiao, M., Miller, D.S., and Burrell, C.J. (1998) Protective effi-
cacy of DNA vaccines against duck hepatitis B virus infection. J. Virol. 72, 84–94.
6. Bertram, E.M., Jilbert, A. R., and Kotlarski, I. (1998) Characterization of thrombocytes puri-
fied from peripheral blood mononuclear cells of the duck. Res. Vet. Sci. 64, 267–270.
7. Bertram, E.M., Jilbert, A. R., and Kotlarski, I. (1997) An homologous in vitro assay to detect
lymphokines released by PHA-activated duck peripheral blood leucocytes and spleen cells.
Vet. Immunol. Immunopathol. 56, 163–74.
8. Bertram, E.M., Jilbert, A. R., and Kotlarski, I. (1997) Optimization of an in vitro assay which
measures the proliferation of duck T lymphocytes from peripheral blood in response to stim-
ulation with PHA and ConA. Dev. Comp. Immunol. 21, 299–310.
24 Miller et al.
9. Bertram, E.M., Wilkinson, R.G., Lee, B. A., Jilbert, A. R., and Kotlarski, I. (1996) Identifi-
cation of duck T lymphocytes using an anti-human T cell (CD3) antiserum. Vet. Immunol.
Immunopathol. 51, 353–363.
10. Chan, S. W. S., Middleton, D. L., Lundqvist, M. L., Warr, G.W., and Higgins, D. A. (2001)
Anas platyrhynchos T-cell surface glycoprotein CD4 precursor mRNA complete cds. Gen-
Bank AF378701.
11. Chan, S. W. S., Middleton, D. L., Lundqvist, M. L., Warr, G.W., and Higgins, D. A. (2001)
Anas platyrhynchos T cell antigen CD8 alpha mRNA. GenBank AF378373.
12. Chan, S. W. S., Middleton, D. L., Lundqvist, M. L., Warr, G.W., and Higgins, D. A. (2001)
Anas platyrhynchos MHC class I antigen alpha chain mRNA, partial cds. GenBank
AF393511.
13. Chan, S. W. S., Middleton, D. L., Lundqvist, M. L., Warr, G.W., and Higgins, D. A. (2001)
Anas platyrhynchos MHC class II antigen beta chain mRNA, GenBank AF390589.
14. Avian hematology website: http://www
.vet.utk.edu/path1/lesson1/ques1/ques1.html
15. Avian hematology website: />16. Higgins, D. A. and Chung, S-K. (1986) Duck lymphocytes I. Purification and preliminary
observations on surface markers. J. Immunol. Methods 86, 231–238.
17. Higgins, D. A. and Teoh, C. S.H. (1988) Duck lymphocytes II. Culture conditions for opti-
mum transformation response to phytohaemagglutinin. J. Immunol. Methods 106, 135–145.
18. Bertram, E. .M (1997) Characterization of duck lymphoid cell populations and their role in
immunity to duck hepatitis B virus. Ph. D. thesis, University of Adelaide.
19. Most, J., Spotl, L., Mayr, G. Gasser, A., Sarti, A., and Dierich, M. P. (1997) Formation of
multinucleated giant cells in vitro is dependent on the stage of monocyte to macrophage mat-
uration. Blood 89, 662–671.
20. Battaglino, R., Kim, D., Fu, J., Vaage, B., Fu, X. Y., and Stashenko, P. (2002) c-myc is
required for osteoclast differentiation. J. Bone Miner. Res. 17, 763–73.
21. Alvarez, J. I., Ross, F. P., Athanasou, N. A., Blair, H. C., Greenfield, E. M., and Teitelbaum,
S. L. (1992) Osteoclast precursors circulate in avian blood. Calcif. Tissue Int. 51:48–53.
22. Machuca, I., Domenget, C., and Jurdic, P. (1999) Identification of avian sarcoplasmic reticu-
lum Ca(
2+
)-ATPase (SERCA3) as a novel 1,25(OH)(2)D(3) target gene in the monocytic lin-
eage. Exp. Cell. Res. 250, 364–75.
23. Woods, C., Domenget, C., Solari, F., Gandrillon, O., Lazarides, E. and Jurdic, P. (1995)
Antagonistic role of vitamin D3 and retinoic acid on the differentiation of chicken
hematopoietic macrophages into osteoclast precursor cells. Endocrinology 136, 85–95.
24. Olah, I. and Glick, B. (1982) Splenic white pulp and associated vascular channels in chicken
spleen. Am. J. Anat. 165, 445–480.
25. Del Cacho, E., Gallego, M., Arnal, C., and Bascuas, J. A. (1995) Localisation of splenic cells
with antigen-transporting capability in the chicken. Anat. Rec. 241, 105–112.
26. Mast, J., Goddeeris, B. M., Peeters, K., Vandesande, F., Berghman, L. R. (1998) Characteri-
zation of chicken monocytes, macrophages and interdigitating cells by the monoclonal anti-
body KUL01. Vet. Immunol. Immunopathol. 61, 343–357.
27. Janse, E. M., and Jeurissen, S. H. (1991) Ontogeny and function of two non-lymphoid cell
populations in the chicken embryo. Immunobiology 182, 472–481.
28. Pugh, J. C., Di, Q. Mason, W. S., and Simmons, H. (1995) Susceptibility to duck hepatitis B
virus infection is associated with the presence of cell surface receptor sites that efficiently
bind viral particles. J. Virol. 69, 4814–4822.
29. Magor, K.E., Higgins, D. A., Middleton, D. L., and Warr, G.W. (1994) One gene encodes the
heavy chains for three different forms of IgY in the duck. J. Immunol. 153, 5549–5555.
Host Immune Responses Against DHBV 25
30. Chan, S. W. S., Warr, G.W., Middleton, D. L., Lundquist, M. L., and Higgins, D. A. (2000)
Anas platyrhynchos T-cell receptor alpha mRNA, partial cds. GenBank AF323922.
31. Chan, S. W. S., and Higgins, D. A. (2001) Anas platyrhynchos T-cell receptor beta chain
mRNA, complete cds. GenBank AY039002.
32. Chan, S. W. S. and Higgins, D. A. (2001) Anas platyrhynchos T-cell receptor delta chain pre-
cursor, mRNA, complete cds. GenBank AF415216.
33. Chan, S. W. S., Ko, O. K. H., and Higgins, D. A. (2001) Anas platyrhynchos T-cell receptor
gamma mRNA, complete cds. GenBank AF378702.
34. Chan, S. W. S., Middleton, D. L., Lundqvist, M. L., Warr, G.W., and Higgins, D. A. (2001)
Anas platyrhynchos T-cell receptor CD3 epsilon chain mRNA, complete cds. Genbank
AF378704.
35. Chan, S. W. S., Middleton, D. L., Lundqvist, M., Warr, G.W., and Higgins, D.A. (2001) Anas
platyrhynchos CD58 antigen mRNA, complete cds. GenBank AY032731.
36. Chan, S. W. S., Middleton, D. L., Warr, G. W., and Higgins, D. A. (2001) Anas platyrhynchos
T cell antigen CD44 isoform a mRNA, complete cds. GenBank AY029553.
37. Chan, S. W. S., Middleton, D. L., Lundqvist, M., Warr, G.W., and Higgins, D.A. (2001) Anas
platyrhynchos T-cell antigen CD44 isoform c mRNA, complete cds. GenBank AY032667
38. Chan, S. W. S., Warr, G.W., Middleton, D. L., and Higgins, D. A. (2001) Anas platyrhynchos
T cell antigen CD44 isoform b mRNA, complete cds. GenBank AF332869.
39. Chan, S. W. S., Warr, G.W., Middleton, D. L., Lundquist, M. L., and Higgins, D. A. (2001)
Anas platyrhynchos interleukin-18 (IL-18) mRNA, partial cds. GenBank AF336122.