mass spectrometry of proteins and peptides
Bạn đang xem bản rút gọn của tài liệu. Xem và tải ngay bản đầy đủ của tài liệu tại đây (2.97 MB, 515 trang )
Methods in Molecular Biology
TM
HUMANA PRESS
Mass
Spectrometry
of Proteins
and Peptides
Edited by
John R. Chapman
HUMANA PRESS
Methods in Molecular Biology
TM
VOLUME 146
Mass
Spectrometry
of Proteins
and Peptides
Edited by
John R. Chapman
Peptide Sequencing by Tandem MS 1
1
1
From:
Methods in Molecular Biology, vol. 146:
Protein and Peptide Analysis: New Mass Spectrometric Applications
Edited by: J. R. Chapman © Humana Press Inc., Totowa, NJ
De Novo
Peptide Sequencing
by Nanoelectrospray Tandem Mass
Spectrometry Using Triple Quadrupole
and Quadrupole/Time-of-Flight Instruments
Andrej Shevchenko, Igor Chernushevich,
Matthias Wilm, and Matthias Mann
1. Introduction
Recent developments in technology and instrumentation have made mass
spectrometry the method of choice for the identification of gel-separated pro-
teins using rapidly growing sequence databases (1). Proteins with a full-length
sequence present in a database can be identified with high certainty and high
throughput using the accurate masses obtained by matrix-assisted laser desorp-
tion/ionization (MALDI) mass spectrometry peptide mapping (2). Simple pro-
tein mixtures can also be deciphered by MALDI peptide mapping (3) and the
entire identification process, starting from in-gel digestion (4) and finishing
with acquisition of mass spectra and database search, can be automated (5).
Only 1–3% of a total digest are consumed for MALDI analysis even if the
protein of interest is present on a gel in a subpicomole amount. If no conclusive
identification is achieved by MALDI peptide mapping, the remaining protein
digest can be analyzed by nanoelectrospray tandem mass spectrometry (Nano
ESI-MS/MS) (6). Nano ESI-MS/MS produces data that allow highly specific
database searches so that proteins that are only partially present in a database,
or relevant clones in an EST database, can be identified (7). It is important to
point out that there is no need to determine the complete sequence of peptides
in order to search a database—a short sequence stretch consisting of three to
four amino acid residues provides enough search specificity when combined
with the mass of the intact peptide and the masses of corresponding fragment
2 Shevchenko et al.
ions in a peptide sequence tag (8) (see Subheading 3.4.). Furthermore, pro-
teins not present in a database that are, however, strongly homologous to a
known protein can be identified by an error-tolerant search (9).
Despite the success of ongoing genomic sequencing projects, the demand
for de novo peptide sequencing has not been eliminated. Long and accurate
peptide sequences are required for protein identification by homology search
and for the cloning of new genes. Degenerate oligonucleotide probes are
designed on the basis of peptide sequences obtained in this way, and subse-
quently used in polymerase chain reaction-based cloning strategies.
The presence of a continuous series of mass spectrometric fragment ions
containing the C terminus (y′′ ions) (10) has been successfully used to deter-
mine de novo sequences using fragment ion spectra of peptides from a tryptic
digest (11). The peptide sequence can be deduced by considering precise mass
differences between adjacent y′′ ions. However, it is necessary to obtain addi-
tional evidence that the particular fragment ion does indeed belong to the y′′
series. To this end, a separate portion of the unseparated digest is esterified
using 2 M HCl in anhydrous methanol (Fig. 1A) (see Subheading 3.2.). Upon
esterification, a methyl group is attached to the C-terminal carboxyl group of
each peptide, as well as to the carboxyl group in the side chain of aspartic and
glutamic acid residues. Therefore the m/z value of each peptide ion is shifted
by 14(n + 1)/z, where n is the number of aspartic and glutamic acid residues in
the peptide, and z is the charge of the peptide ion. The derivatized digest is then
also analyzed by Nano ESI-MS/MS, and, for each peptide, fragment ion spec-
tra acquired from underivatized and derivatized forms are matched. An accu-
rate peptide sequence is determined by software-assisted comparison of these
two fragment spectra by considering precise mass differences between the
adjacent y′′ ions as well as characteristic mass shifts induced by esterification
(see Subheading 3.4.1.) (Fig. 2). Since esterification with methanol signifi-
cantly shifts the masses of y′′ ions (by 14, 28, 42, mass units), it is possible
to use low-resolution settings when sequencing is performed on a triple qua-
drupole mass spectrometer, thus attaining high sensitivity on the instrument.
This sequencing approach employing esterification is laborious and time con-
suming and requires much expertise in the interpretation of tandem mass spec-
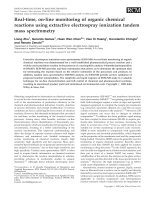
Fig. 1. Chemical derivatization for mass spectrometric de novo sequencing of pep-
tides recovered from digests of gel separated proteins. (A) A protein is digested in-gel
(see Subheading 3.1.) with trypsin and a portion of the unseparated digest is esterified
by 2 M HCl in anhydrous methanol (see Subheading 3.2.). (B) A protein is digested
in-gel with trypsin in a buffer containing 50% (v/v) H
2
18
O and 50% (v/v) H
2
16
O (see
Subheading 3.1.). (C) A protein is digested in-gel with trypsin, and the digest is
esterified and subsequently treated with trypsin in the buffer containing 50% (v/v)
Peptide Sequencing by Tandem MS 3
H
2
18
O and 50% (v/v) H
2
16
O (see Note 22). Here, R
1
repesents the side chain of argin-
ine or lysine amino acid residues (these are trypsin cleavage sites) whereas R
x
repre-
sents the side chain of any other amino acid residue except for proline.
4 Shevchenko et al.
tra. However, it allows the determination of accurate peptide sequences even
from protein spots that can only be visualized by staining with silver (12,13).
An alternative approach to de novo sequencing became feasible after a novel
type of mass spectrometer—a hybrid quadrupole/time-of-flight instrument (Q/TOF
[14] or QqTOF [15]) was introduced. QqTOF instruments allow the acquisi-
tion of tandem mass spectra with very high mass resolution (>8000 full-width
at half-maximum height [FWHM]) without compromising sensitivity. These
instruments also benefit from the use of a nonscanning TOF analyzer that
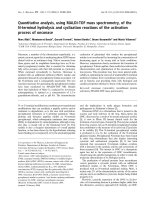
Fig. 2. Peptide de novo sequencing by comparison of tandem mass spectra acquired
from intact and esterified peptide. A 120-kDa protein from E. aediculatis was purified
by one-dimensional gel electrophoresis (24) and digested in-gel with trypsin; a part of
the digest was analyzed by Nano ESI-MS/MS on an API III triple quadrupole mass
spectrometer (PE Sciex, Ontario, Canada). A separate part of the digest was esterified
and then also analyzed by Nano ESI-MS/MS. (A) Tandem (fragment-ion) mass spec-
trum recorded from the doubly charged ion with m/z 666.0 observed in the conven-
tional (Q1) spectrum of the original digest. (B) Matching tandem spectrum acquired
from the ion with m/z 673.0 (∆ mass = [673–666] × 2 = 14) in the conventional (Q1)
spectrum of the esterified digest. The peptide sequence was determined by software-
assisted comparison of spectra A and B. The only methyl group was attached to the
C-terminal carboxyl of the peptide (designated by a filled circle) and therefore the
masses of the singly charged y′′ ions in spectrum B are shifted by 14 mass units com-
pared with the corresponding y′′ ions in spectrum A.
Peptide Sequencing by Tandem MS 5
records all ions simultaneously in both conventional and MS/MS modes and
therefore increases sensitivity. These features make it possible and practical to
apply selective isotopic labeling of the peptide C-terminal carboxyl group in
order to distinguish y′′ ions from other fragment ions in tandem mass spectra
(see Subheading 3.4.2.). Proteins are digested with trypsin in a buffer contain-
ing 50% H
2
16
O and 50% H
2
18
O (v/v) (see Subheading 3.1.) so that half of the
resulting tryptic peptide molecules incorporate
18
O atoms in their C-terminal
carboxyl group, whereas the other half incorporate
16
O atoms (Fig. 1B). During
subsequent sequencing by MS/MS, the entire isotopic cluster of each peptide
ion, in turn, is selected by the quadrupole mass filter (Q) and fragmented in the
collision cell (9). Since only the fragments containing the C-terminal carboxyl
group of the peptide appear to be partially (50%) isotopically labeled, y′′ ions
are distinguished by a characteristic isotopic pattern, viz. doublet peaks split
by 2 mass units (see Subheading 3.4.2.) (Fig. 3); other fragment ions have a
normal isotopic distribution. Thus, only a single analysis is required, peptide
sequence readout is much faster and the approach lends itself to automation (15).
2. Materials
For general instructions, see Note 1.
2.1. In-Gel Digestion
For contamination precautions, see Note 2.
1. 100 mM ammonium bicarbonate in water (high-performance liquid chromatog-
raphy [HPLC] grade [LabScan, Dublin, Ireland]).
2. Acetonitrile (HPLC grade [LabScan]).
3. 10 mM dithiothreitol in 100 mM ammonium bicarbonate.
4. 55 mM iodoacetamide in 100 mM ammonium bicarbonate.
5. 100 mM CaCl
2
in water.
6. 15 µL aliquots of trypsin, unmodified, sequencing grade (Boerhringer Mannheim,
Germany) in 1 mM HCl (see Note 3).
7. 5% (v/v) formic acid in water.
8. Heating blocks at 56°C and at 37°C.
9. Ice bucket.
10. Laminar flow hood (optional) (see Note 2).
2.2. Esterification with Methanol
1. Methanol (HPLC grade), distilled shortly before the derivatization process.
2. Acetyl chloride (reagent grade), distilled shortly before the derivatization (see Note 4).
2.3. Isotopic Labeling Using H
2
18
O
1. Reagents as in Subheading 2.1.
2. H
2
18
O (Cambridge Isotopic Laboratories, Cambridge, MA), distilled (see Note 5).
6 Shevchenko et al.
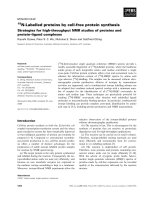
Fig. 3. Sequencing of
18
O C-terminally labeled tryptic peptides by Nano ESI-MS/MS.
A 35-kDa protein from Drosophila was purified by gel electrophoresis, digested
in-gel in a buffer containing 50% (v/v) H
2
18
O, and analyzed using a QqTOF mass
Peptide Sequencing by Tandem MS 7
2.4. Desalting and Concentrating In-Gel Tryptic Digests Prior
to Analysis by Nano ESI-MS/MS
1. 5% (v/v) formic acid in water.
2. 60% methanol in 5% aqueous formic acid (both v/v).
3. Perfusion sorbent POROS 50 R2 (PerSeptive Biosystems, Framingham MA) (see
Note 6).
4. Borosilicate glass capillaries GC120F-10 (1.2-mm OD × 0.69-mm ID) (Clark
Electromedical Instruments, Pangbourne, UK) (see Note 7).
5. Purification needle holder, made as described in ref. 16 or purchased from
Protana (Odense, Denmark).
6. Benchtop minicentrifuge (e.g., PicoFuge, Stratagene, Palo Alto, CA).
3. Methods
3.1. In-Gel Digestion (
see Notes 8
and
9
)
3.1.1. Excision of Protein Bands (spots) from Gels
1. Rinse the entire gel with water and excise bands of interest with a clean scalpel,
cutting as close to the edge of the band as possible.
2. Chop the excised bands into cubes (≈ 1 × 1 mm).
3. Transfer gel pieces into a microcentrifuge tube (0.5- or 1.5-mL Eppendorf test tube).
3.1.2. In-gel Reduction and Alkylation (
see
Note 10
)
1. Wash gel pieces with 100–150 µL of water for 5 min.
2. Spin down and remove all liquid.
3. Add acetonitrile (the volume of acetonitrile should be at least twice the volume
of the gel pieces) and wait for 10–15 min until the gel pieces have shrunk. (They
become white and stick together.)
4. Spin gel pieces down, removing all liquid, and dry in a vacuum centrifuge.
5. Swell gel pieces in 10 mM dithiothreitol in 100 mM NH
4
HCO
3
(adding enough
reducing buffer to cover the gel pieces completely) and incubate (30 min at 56°C)
to effect reduction of the protein.
6. Spin gel pieces down and remove excess liquid.
spectrometer (PE Sciex). (A) Part of the conventional spectrum of the unseparated
digest. Although the isotopic pattern of labeled peptides is relatively complex, the
high resolution of the QqTOF instrument allows a determination of the charge on the
ions. (B) The entire isotopic cluster, which contains the doubly charged ion with m/z
692.85, was isolated by the quadrupole mass analyzer and transmitted to the collision
cell, and its fragment ion spectrum was acquired. (C) Zoom of the region close to m/z
1200 of the fragment ion spectrum in B. Isotopically labeled y′′ ions are observed as
doublets split by 2 mass units. The peptide sequence was determined by considering
the mass differences between adjacent labeled y′′ ions.
8 Shevchenko et al.
7. Shrink gel pieces with acetonitrile, as in step 3. Replace acetonitrile with 55 mM
iodoacetamide in 100 mM NH
4
HCO
3
and incubate (20 min, room temperature, in
the dark).
8. Remove iodoacetamide solution and wash gel pieces with 150–200 µL of 100 mM
NH
4
HCO
3
for 15 min.
9. Spin gel pieces down and remove all liquid.
10. Shrink gel pieces with acetonitrile as before, remove all liquid, and dry gel pieces
in a vacuum centrifuge.
3.1.3. Additional Washing of Gel Pieces
(for Coomassie-Stained Gels Only ) (
see
Note 11
)
1. Rehydrate gel pieces in 100–150 µL of 100 mM NH
4
HCO
3
and after 10–15 min
add an equal volume of acetonitrile.
2. Vortex the tube contents for 15–20 min, spin gel pieces down, and remove all liquid.
3. Shrink gel pieces with acetonitrile (see Subsection 3.1.2.) and remove all liquid.
4. Dry gel pieces in a vacuum centrifuge .
3.1.4. Application of Trypsin (
see
Note 12
)
1. Rehydrate gel pieces in the digestion buffer containing 50 mM NH
4
HCO
3
, 5 mM
CaCl
2
, and 12.5 ng/µL of trypsin at 4°C (use ice bucket) for 30–45 min. After
15–20 min, check the samples and add more buffer if all the liquid has been
absorbed by the gel pieces. For
18
O isotopic labeling of C-terminal carboxyl
groups of tryptic peptides, prepare the buffer for this step and for step 2 in 50:50
(v/v) H
2
16
O + H
2
18
O (see Note 12).
2. Remove remaining buffer. Add 10–20 µL of the same buffer, but prepared with-
out trypsin, to cover gel pieces and keep them wet during enzymatic digestion.
Leave samples in a heating block at 37°C overnight.
3.1.5. Extraction of Peptides
1. Add 10–15 µL of water to the digest, spin gel pieces down, and incubate at 37°C
for 15 min on a shaking platform.
2. Spin gel pieces down, add acetonitrile (add a volume that is two times the volume
of the gel pieces), and incubate at 37°C for 15 min with shaking.
3. Spin gel pieces down and collect the supernatant into a separate Eppendorf test tube.
4. Add 40–50 µL of 5% formic acid to the gel pieces.
5. Vortex mix and incubate for 15 min at 37°C with shaking.
6. Spin gel pieces down, add an equal volume of acetonitrile, and incubate at 37°C
for 15 min with shaking.
7. Spin gel pieces down, collect the supernatant, and pool the extracts.
8. Dry down the pooled extracts using a vacuum centrifuge.
3.2. Esterification of In-Gel Digests with Methanol
1. Put 1 mL of methanol (for the preparation of reagents, see Subheading 2.2.) into a
1.5-mL Eppendorf test tube. Place the tube in a freezer at –20°C (or lower) for 15 min.
Peptide Sequencing by Tandem MS 9
2. Take the tube from the freezer and immediately add 150 µL of acetyl chloride
(Caution! Put on safety goggles and gloves. The mixture may boil up instantly!).
Leave the tube to warm up to room temperature and use this reagent 10 min later.
3. Add 10–15 µL of the reagent (see Note 13), prepared as in step 2, to a dried
portion of the peptide pool recovered after in-gel digestion of the protein (see
Subsection 3.1.5.).
4. Incubate for 45 min at room temperature.
5. Dry down the reaction mixture using a vacuum centrifuge.
3.3. Desalting and Concentration
of In-Gel Digest prior to Nano ESI-MS/MS Sequencing
1. Pipette ≈ 5 µL of POROS R2 slurry, prepared in methanol, into the pulled glass
capillary (here and in subsequent steps now referred to as a “column”). Spin the
beads down and then open the pulled end of the column by gently touching against
a bench top. Wash the beads with 5 µL of 5% formic acid and then make sure the
liquid can easily be spun out of the column by gentle centrifuging. Open the
column end wider if necessary. Mount the column into the micropurification
holder (see Subheading 2.4.).
2. Dissolve the dried digest (see Subheading 3.1.5.) or the esterified portion of the
digest (see Subheading 3.2.) in 10 µL of 5% formic acid and load onto the col-
umn. Pass the sample through the bead layer by centrifuging.
3. Wash the adsorbed peptides with another 5 µL of 5% formic acid.
4. Align the column and the nanoelectrospray needle in the micropurification holder
and elute peptides directly into the needle with 1 µL of 60% of methanol in 5%
formic acid by gentle centrifuging.
5. Mount the spraying needle together with the sample into the nanoelectrospray
ion source and acquire mass spectra (see Note 14 and Subheading 3.4.).
3.4. Acquisition of Mass Spectra and Data Interpretation
Before the analysis, the tandem mass spectrometer—triple quadrupole or
quadrupole/time-of-flight—should be tuned as discussed in Notes 15 and 16,
respectively. Since in-gel digestion using unmodified trypsin is accompanied
by trypsin autolysis, it is necessary to acquire the spectrum of a control sample
(blank gel pieces processed as described in Subheading 3.1.) in advance. Spectra
should be acquired in both conventional scanning (Q1) and precursor-ion detec-
tion modes (as in Subheading 3.4.1., step 1).
3.4.1. Sequencing on a Triple Quadrupole Mass Spectrometer
1. After desalting and concentration (see Subheading 3.3.), initiate spraying and
acquire a conventional (Q1 scan) spectrum of the peptide mixture from digestion.
Introduce collision gas into the instrument and acquire a spectrum in the precur-
sor-scan mode (e.g., scanning to record only ions that are precursors to m/z 86
fragment ions on collisional fragmentation) (17) (see Note 17).
10 Shevchenko et al.
2. Stop spraying by dropping the spraying voltage to zero. Drop the air pressure
applied to the spraying capillary. Move the spraying capillary away from the
inlet of the mass spectrometer.
3. Examine the acquired spectra and compare them with the spectra acquired from
the control sample. Select precursor ions for subsequent tandem mass spectro-
metric sequencing.
4. Add 0.3–0.5 µL of 60% of methanol in 5% formic acid directly to the spraying
capillary if the remaining sample volume is less than ≈ 0.5 µL. Reestablish spray-
ing and acquire tandem (fragment-ion) mass spectra from selected precursor ions.
5. Interpret the acquired spectra. An m/z region above the multiply charged precur-
sor ion is usually free from chemical noise in tandem mass spectra of tryptic
peptides and is dominated by y′′ ions. Therefore in this region it is relatively easy
to retrieve short amino acid sequences by considering the masses of fragment
ions. Assemble peptide sequence tags and perform a database search using
PeptideSearch software installed on a Macintosh computer or via the Internet
(see Note 18).
6. If the protein proves to be unknown (i.e., not present in a sequence database)
take the remaining portion of the digest, esterify with methanol (see Subhead-
ing 3.2.), redissolve in 10 µL of 5% formic acid, perform desalting and concen-
tration (see Subheading 3.3.), and acquire spectra by nanoelectrospray as
described above.
7. Correlate peptide molecular ions in the unmodified and derivatized digests (see
Note 19). Deduce peptide sequences by comparison of the tandem (fragment-
ion) spectra from each pair of derivatized and unmodified peptides (Fig. 2).
3.4.2. Sequencing of
18
O-Labeled Peptides
on a Quadrupole/Time-of-Flight Mass Spectrometer
1. Perform nanoelectrospray analysis of in-gel digests, including acquisition of tan-
dem (fragment-ion) spectra, just as described for a triple quadrupole instrument
in Subheading 3.4.1., steps 1–4, but using a quadrupole/time-of-flight instru-
ment (see also Note 20).
2. Interpret the fragment spectra and deduce the corresponding peptide sequences
(see Note 21) (Fig. 3).
3. Note that in principle only one set of acquired data is required to deduce the
peptide sequence. However, if necessary, the remaining portion of a digest could
be esterified (see Subheading 3.2.) and analyzed separately to generate an inde-
pendent set of peptide sequence data (see also Note 22)
4. Notes
1. All chemicals should be of the highest degree of purity available. Solutions of
dithiothreitol and iodoacetamide should be freshly prepared. It is recommended
to use 50–100 mL stocks of water, ammonium bicarbonate buffer, and acetoni-
trile and to discard old solvents before starting the preparation of a new series of
samples. In our experience, stock solutions rapidly accumulate dust, pieces of
Peptide Sequencing by Tandem MS 11
hair, threads, etc. from the laboratory environment. Plastic ware (pipette tips,
gloves, dishes, and so on) may acquire a static charge and attract dust. Accumu-
lation of even a minute amount of dust in solutions and reagents results in mas-
sive contamination of samples with human and sheep keratins and makes
sequencing exceedingly difficult if not impossible. Polymeric detergents (Tween,
Triton, etc.) should not be used for cleaning the laboratory dishes and tools.
2. All possible precautions should be taken to avoid the contamination of samples
with keratins and polymeric detergents (see Note 1). Gloves should be worn at all
times during operations with gels (staining, documenting, excision of bands or
spots of interest) and sample preparation. It is necessary to rinse new gloves with
water to wash away talcum powder and it is recommended to rinse them again
with water occasionally during sample preparation since gloves with a static
charge attract dust. In our experience, it is advisable to perform all operations in
a laminar flow hood, which helps to preserve a dust-free environment.
3. Add 250 µL of 1 mM HCl to the commercially available vial containing 25 µg of
trypsin. Vortex the vial and aliquot the trypsin stock solution in 0.5-mL
Eppendorf test tubes (15 µL per tube). Freeze the aliquots and store at –20°C
before use. Unfreeze the aliquot shortly before preparation of the digestion buffer.
Discard the rest of the aliquot if it is not totally used. Surplus digestion buffer
containing trypsin (see Subheading 3.1.4. and also Note 12) should also be
discarded.
4. A glass tube filled with calcium chloride or molecular sieve should be used to
protect acetyl chloride during distillation.
5. Commercially available H
2
18
O has a chemical purity of ≈ 95% and is unsuitable
for protein sequencing by mass spectrometry. Therefore, a 0.5-mL portion of
water is purified by microdistillation in a sealed glass apparatus and stored at –20°C
in 15-µL aliquots until use. Each aliquot is used only once.
6. Methanol (1 mL) is added to ≈ 30 µL of POROS R2 resin to prepare a slurry. A
fraction of the resin beads of submicrometer size, whose presence increases the
resistance to liquid flow, can be efficiently removed by repetitive sedimentation.
Vortex the test tube containing the slurry and then let it stay in a rack until the
major part of the resin reaches the bottom of the tube. Aspirate the supernatant
with a pipette and discard it. Repeat the procedure 3–5 times if necessary.
7. Capillaries for micropurification are manufactured in the same way as capillaries
for nanoelectrospray (18) but are not coated with a metal film.
8. The procedure described in Subheading 3.1. (19) is applicable, with no modifi-
cations, to spots (bands) excised from one- or two-dimensional polyacrylamide
gels stained with Coomassie brilliant blue R 250 or G 250, as well as to silver-
stained (see Note 9) or negatively stained gels (20).
9. Any convenient protocol for silver staining can be employed to visualize proteins
present on a gel in a subpicomole amount. However, the reagents used to improve
the sensitivity and the contrast of staining must not modify proteins covalently.
Thus, treatment of gels with the crosslinking reagent glutaraldehyde or with strong
oxidizing agents, such as chromates and permanganates, should be avoided.
12 Shevchenko et al.
10. In-gel reduction and subsequent alkylation of free SH groups in cysteine residues
is recommended even if the proteins have been reduced prior to electrophoresis.
Note that alkylation of free cysteine residues by acrylamide sometimes occurs
during electrophoretic separation. Treatment with dithiothreitol does not cleave
these acrylamide residues. Thus, possible acrylamidation of cysteines should
be taken into consideration when interpreting the spectra or searching a database
with peptide sequence tags.
11. This step of the protocol is applied only when Coomassie-stained gel pieces still
look blue after reduction and alkylation of the protein are complete. This usually
occurs when intense bands (spots) containing picomoles of protein material are
being analyzed. If a single washing cycle does not remove the residual staining,
the procedure is repeated.
12. To prepare the digestion buffer, add 50 µL of 100 mM NH
4
HCO
3
, 50 µL of water,
and 5 µL of 100 mM CaCl
2
to a 15-µL aliquot of trypsin stock solution (see Note 3).
Keep the test tube containing digestion buffer on ice before use. To prepare the
buffer for
18
O labeling use H
2
18
O water instead of H
2
16
O water with the same
stock solution of 100 mM NH
4
HCO
3
.
13. The added volume of reagent should just cover the solid residue at the bottom of
the tube. Avoid an excessive volume since this increases chemical background in
the mass spectra.
14. For detailed instructions on the manufacture of the nanoelectrospray needles and
on the operation of the nanoelectrospray ion source, see ref. 18. The theoretical
background of the nanoelectrospray is discussed in ref. 21.
15. The calibration of a triple quadrupole mass spectrometer is performed in accor-
dance with the manufacturer’s instructions. However, for sequencing of proteins
present at the low picomole level, several settings should be specially tuned. Make
sure that the settings controlling resolution of the first quadrupole (Q1) allow
good transmission of precursor ions. On the other hand, unnecessarily low reso-
lution of Q1 results in the transmission of too many background ions, which may
densely populate the low m/z region of the fragment-ion spectra. The third
quadrupole (Q3) should likewise be operated at a low resolution setting in order
to improve its transmission and to achieve acceptable ion statistics in the
fragment-ion spectra. In our experience, a resolution in Q3 as low as 250
(FWHM) still allows accurate readout of peptide sequences. The Q1 and Q3
resolution settings can be tuned in a tandem mass spectrometric experiment
using synthetic peptides.
16. Calibration of a QqTOF instrument is performed by acquiring the spectrum of a
mixture of synthetic peptides. External calibration with two peptide masses
allows 10-ppm mass accuracy for both conventional and tandem mass spectra, if
calibration and sequencing experiments are performed within approximately 2 h.
A calibration acquired in the mode that records conventional mass spectra does
not change when the instrument is switched to tandem mode. The resolution of
the first quadrupole (Q1) should be set in a similar way to that described for a
triple quadrupole mass spectrometer (see Note 15).
Peptide Sequencing by Tandem MS 13
17. The conventional (Q1) spectrum ideally contains only peptide molecular ions.
However, impurity ions may be present or the peptide ions may be weak and
therefore difficult to distinguish from noise. The use of a specific scan for precur-
sor ions that produce m/z 86 fragment ions (immonium ion of leucine or isoleu-
cine) helps to distinguish genuine peptide ions from chemical noise and is
therefore indispensable for sequencing at low levels. It is also helpful to acquire
precursor-ion spectra even if a somewhat larger (picomole) amount of protein is
present on the gel. For example, precursor-ion scanning facilitates the rejection
of polyethyleneglycol-like contamination, which is often seen in the low m/z region
of conventional (Q1) spectra as series of intense peaks at 44-mass unit intervals.
18. PeptideSearch ver. 3.0 software can be downloaded from the EMBL Peptide &
Protein Group WWW-page ( For detailed
information on PeptideSearch software see ref. 22. Searching a nonredundant
protein database can also be performed at the same server via the Internet.
19. The number of residues of aspartic and glutamic acids present in any particular
peptide is not known. Therefore, to identify the matching peptide ion in the spec-
trum of the esterified digest, it is necessary to consider all ions shifted from the
mass of the ion in the unmodified peptide by 14(n + 1)/z (where n = 0, 1, 2, 3 );
see Subheading 1.) and to fragment all of them.
20. Because of limited efficiency of ion transmission from the collision cell to the
time-of-flight analyzer in QqTOF instruments, the precursor-ion scan mode is far
less sensitive than with triple quadrupole machines. In this mode of operation,
the second mass analyzer (TOF or Q3, respectively) is used in a nonscanning
mode (e.g., recording ions with m/z = 86 only) on both instruments. For this
reason, the advantage of the TOF analyser, i.e., that it can record all fragment
ions without scanning, is not of value and the precursor ion scan mode on the
QqTOF instrument is therefore not useful for sequencing at low levels.
It is, however, relatively easy to distinguish precursor ions from chemical
background by taking advantage of the high resolution of the QqTOF instrument.
Isotopically labeled peptide ions are detected as sharp, characteristic isotopic
patterns superimposed on a broad, irregularly shaped, background (23). Isotopic
peaks of multiply charged ions are very well resolved, and the charge of the
precursor ion can be instantly calculated from the mass difference between the
isotopic peaks. If a conventional mass spectrum of the digest is noisy, it is not
always straightforward to recognize the peak of the first isotope in the complex
isotopic pattern of a multiply charged
18
O-labeled peptide ion. In this case, the
isotopic pattern of singly charged fragment ions produced by collisional frag-
mentation has to be rapidly examined. If the isotopic pattern of fragment ions is
disturbed (for example, there is only one isotopic peak for unlabeled ions, or the
second isotopic peaks of the
18
O-labeled fragments are missing) then the selec-
tion of the precursor ion has to be corrected.
21. y′′ ions are distinguished from other fragment ions by their characteristic isoto-
pic profile (see Subheading 1.). It is easier to start the interpretation in the m/z
region above the precursor ion, where fragment spectra usually contain less back-
14 Shevchenko et al.
ground ions and isotopic profiles of labeled ions are clearly visible. The series of
y′′ ions is followed downward in mass and should terminate at the labeled y′′ ion
of arginine or lysine. Upward in mass, the y′′ series can be extended to the mass
of the singly protonated ion of an intact peptide.
The high resolution of a QqTOF instrument greatly assists in spectrum inter-
pretation and allows one to obtain additional pieces of information that are not
available in low-resolution tandem mass spectra acquired on triple quadrupole
instruments. Thus, fragmentation of doubly charged precursor ions mainly results
in a series of singly charged fragments whereas the series of doubly charged
fragments usually has a much lower intensity. However, the high resolution of
the QqTOF instrument enables them to be identified and used as independent
verification of the sequence determined from the series of singly charged frag-
ment ions. Since only the C-terminal carboxyl group of peptides is labeled during
tryptic digestion, the N-terminal series of fragment ions (b-series) appear to be
unlabeled. Although these ions often have low intensity, they can be recognized
in the fragment spectrum and are useful for data interpretation. Again, the high
resolution of QqTOF instruments makes it possible to determine the masses of
fragment ions very accurately. Thus it is possible to distinguish phenylalanine
from methionine-sulfoxide (their masses differ by 0.033 Daltons) as well as
glutamine from lysine (mass difference 0.037 Daltons).
22. If the protein was in-gel digested with trypsin in a buffer that did not contain
H
2
18
O, selective C-terminal isotopic labeling can still be performed. The digest
should be esterified with methanol (see Subheading 3.2.), dissolved in a buffer
containing 50% (v/v) H
2
18
O, treated with trypsin for 30 min, and dried in a
vacuum centrifuge. Treatment with trypsin efficiently removes the ester group
from the C-terminal carboxyl group of tryptic peptides. At the same time, the
C-terminal carboxyl group of peptides incorporates
18
O or
16
O atoms from the
buffer (Fig. 1C). Carboxyl groups in the side chains of aspartic and glutamic acid
residues remain esterified. However, the procedure results in a much higher
chemical noise and in an increased level of keratin peptides. Therefore it can be
used only for sequencing of peptides from chromatographically isolated frac-
tions that contain only a small number of peptides.
References
1. Shevchenko, A., Jensen, O. N., Podtelejnikov, A. V., Sagliocco, F., Wilm, M.,
Vorm, O., et al. (1996) Linking genome and proteome by mass spectrometry:
large scale identification of yeast proteins from two dimensional gels. Proc. Natl.
Acad. Sci. USA 98, 14,440–14,445.
2. Jensen, O. N., Podtelejnikov, P., and Mann, M. (1996) Delayed extraction
improves specificity in database searches by MALDI peptide maps. Rapid
Commun. Mass Spectrom. 10, 1371–1378.
3. Jensen, O. N., Podtelejnikov, A. V., and Mann, M. (1997) Identification of the
components of simple protein mixtures by high-accuracy peptide mass mapping
and database searching. Anal. Chem. 69, 4741–4750.
Peptide Sequencing by Tandem MS 15
4. Houthaeve, T., Gausepohl, H., Mann, M., and Ashman, K. (1995) Automation of
micro-preparation and enzymatic cleavage of gel electrophoretically separated
proteins. FEBS Lett. 376, 91–94.
5. Jensen, O. N., Mortensen, P., Vorm, O., and Mann, M. (1997) Automatic acquisi-
tion of MALDI spectra using fuzzy logic control. Anal. Chem. 69, 1706–1714.
6. Wilm, M., Shevchenko, A., Houthaeve, T., Breit, S., Schweigerer, L., Fotsis T., et
al. (1996) Femtomole sequencing of proteins from polyacrylamide gels by
nanoelectrospray mass spectrometry. Nature 379, 466–469.
7. Lamond, A. and Mann M. (1997) Cell biology and the genome projects—a con-
certed strategy for characterizing multiprotein complexes by using mass spec-
trometry. Trends Cell Biol. 7, 139–142.
8. Mann, M. and Wilm, M. (1994) Error tolerant identification of peptides in
sequence databases by peptide sequence tags. Anal. Chem. 86, 4390–4399.
9. Shevchenko, A., Keller, P., Scheiffele P., Mann M., and Simons, K. (1997) Iden-
tification of components of trans-Golgi network-derived transport vesicles and
detergent-insoluble complexes by nanoelectrospray tandem mass spectrometry.
Electrophoresis 18, 2591–2600.
10. Roepstorff, P. and Fohlman, J. (1984) Proposed nomenclature for sequence ions.
Biomed. Mass Spectrom. 11, 601.
11. Shevchenko, A., Wilm, M., and Mann, M. (1997) Peptide sequencing by mass
spectrometry for homology searches and cloning of genes. J. Protein Chem. 16,
481–490.
12. Muzio, M., Chinnaiyan, A. M., Kischkel, F. C., Rourke, K. O., Shevchenko, A., Ni, J.,
et al. (1996) FLICE, a novel FADD-homologous ICE/CED-3-like protease, is recruited
to the CD95 (Fas/APO-1) death-inducing signaling complex. Cell 85, 817–827.
13. McNagny, K. M., Petterson, I., Rossi, F., Flamme, I., Shevchenko, A., Mann, M.,
et al. (1997) Thrombomucin, a novel cell surface protein that defines thromb-
ocytes and multipotent hematopoetic progenitors. J. Cell Biol. 138, 1395–1407.
14. Morris, H. R., Paxton, T., Dell, A., Langhorn, J., Berg, M., Bordoli,R. S., et al.
(1996) High sensitivity collisionally-activated decomposition tandem mass spec-
trometry on a novel quadrupole/orthogonal-acceleration time-of-flight mass spec-
trometer. Rapid Commun. Mass Spectrom. 10, 889–896.
15. Shevchenko, A., Chernushevich, I., Ens, W, Standing, K. G, Thomson, B., Wilm,
M., et al. (1997) Rapid ‘de novo’ peptide sequencing by a combination of
nanoelectrospray, isotopic labeling and a quadrupole/time-of-flight mass spec-
trometer. Rapid Commun. Mass Spectrom. 11, 1015–1024.
16. Shevchenko, A., Jensen, O. N., Wilm, M., and Mann, M. (1996) Sample prepara-
tion techniques for femtomole sequencing of proteins from polyarylamide gels, in
Proceedings of the 44th ASMS Conference on Mass Spectrometry and Allied Top-
ics, Portland, OR, p. 331.
17. Wilm, M., Neubauer, G., and Mann, M. (1996) Parent ion scans of unseparated
peptide mixtures. Anal. Chem. 68, 527–533.
18. Wilm, M. and Mann, M. (1996) Analytical properties of the nano electrospray ion
source. Anal. Chem. 66, 1–8.
16 Shevchenko et al.
19. Shevchenko, A., Wilm, M., Vorm O., and Mann, M. (1996) Mass spectrometric
sequencing of proteins from silver stained polyacrylamide gels. Anal. Chem. 68,
850–858.
20. Fernandez-Patron, C., Calero, M., Collazo, P. R., Garcia, J. R., Madrazo, J.,
Musacchio, A., et al. (1995) Protein reverse staining: high efficiency microanaly-
sis of unmodified proteins detected on electrophoresis gels. Anal. Biochem. 224,
203–211.
21. Wilm, M. and Mann, M.(1994) Electrospray and Taylor-cone theory, Dole’s beam
of macromolecules at last? Int. J. Mass Spectrom. Ion Processes 136, 167–180.
22. Mann, M. (1994) Sequence database searching by mass spectrometric data, in
Microcharacterization of Proteins (Kellner, R., Lottspeich, F., and Meyer, H. E.,
eds.), VCH, Weinheim, pp. 223–245.
23. Shevchenko, A., Chernushevich, I., and Mann, M. (1998). High sensitivity analy-
sis of gel separated proteins by a quadrupole-TOF tandem mass spectrometer, in
Proceedings 46th ASMS conference on Mass Spectrometry and Allied Topics,
Orlando, FL, p. 237.
24. Lingner, J., Hughes, T. R., Shevchenko, A., Mann, M., Lundblad, V., and Cech,
T. R. (1997) Reverse transcriptase motifs in the catalytic subunits of telomerase.
Science 276, 561–567.
Direct Analysis of Proteins in Mixtures 17
2
17
From:
Methods in Molecular Biology, vol. 146:
Protein and Peptide Analysis: New Mass Spectrometric Applications
Edited by: J. R. Chapman © Humana Press Inc., Totowa, NJ
Direct Analysis of Proteins in Mixtures
Application to Protein Complexes
John R. Yates, III, Andrew J. Link, and David Schieltz
1. Introduction
Tandem mass spectrometry is a powerful mixture analysis technique suit-
able for sequence analysis of peptides (1). A tandem mass spectrometer uses
two stages of analysis to generate structurally informative fragmentation. The
first stage involves separation of an ion from all the other ions that may be
entering the mass spectrometer analyser. Ion isolation can be accomplished by
separating an ion in time or in space; these processes are used by ion trap
instruments or by triple quadrupole instruments, respectively (2–4). The iso-
lated ion is then subjected to ion activation using energetic gas-phase colli-
sions. In the second analysis stage, the mass-to-charge ratio (m/z) values of the
fragmentation products are determined. This method is used for protein
sequence analysis by first creating a collection of peptides using site-specific
enzymatic or chemical proteolysis (1). The collection of peptides is introduced
into the mass spectrometer through a separation technique (liquid chromatog-
raphy [LC] or capillary electrophoresis [CE]) or by batch infusion and finally
ionized using electrospray ionization (5–7). Computer control of the data
acquisition process allows highly efficient acquisition of these tandem mass
spectra as well as unassisted operation of the mass spectrometer (8,9). The
resulting tandem mass spectra can reveal the amino acid sequence of peptides
by interpretation, or, with the recent expansion of sequence databases, the tan-
dem mass spectra can be used to search protein and nucleotide sequence data-
bases directly to identify the amino acid sequence represented by the spectrum
(1,8,10,11). Because tandem mass spectra can be acquired quickly and selec-
18 Yates, Link, and Schieltz
tively on individual peptides present, the identities of proteins in a mixture can
be determined (10,12,13).
The process of protein mixture analysis is similar to that used for analysis of
homogenous proteins. The protein mixture is digested with a site-specific
enzyme to create a complex mixture of peptides. This complex mixture is then
separated on a reversed-phase high-performance liquid chromatography
(HPLC) column or by two-dimensional HPLC (2D LC) prior to entering the
tandem mass spectrometer (14–20). By increasing the resolution of the separa-
tion through use of a longer gradient separation, or by 2D LC, more tandem mass
spectra are acquired so that acquisition of peptide tandem mass spectra from
each protein present is ensured. After the acquisition of tandem mass spectra,
these are searched through sequence databases to match individual peptide
spectra to the sequences of proteins, thus identifying the proteins present.
One application of protein mixture analysis is the identification of compo-
nents of protein complexes. In most physiological functions, collections of pro-
teins come together to perform a reaction or a series of reactions. For example,
protein translation involves a large complex of proteins collectively called the
ribosome. The complex provides the scaffold to bring mRNA and translation
enzymes together to synthesize proteins. To understand fully processes per-
formed by complexes, quantitative and posttranslational details of the compo-
nents need to be determined as a function of cellular state. In other words, how
does the composition of the complex change as a function of time? On a prac-
tical level, these experiments require analytical technology that is capable of
high throughput.
This chapter describes the steps taken to identify proteins in mixtures: proteolytic
digestion, tandem mass spectrometry data acquisition, and database searching.
2. Materials
2.1. Instruments
1. An LCQ tandem mass spectrometer (Finnigan MAT, San Jose, CA) is used in our
laboratory. Other tandem mass spectrometers capable of automated acquisition
of tandem mass spectra should also be suitable for this purpose.
2. A standard system for reversed-phase HPLC is needed. We currently use several
different types: Hewlett Packard 1100 (Palo Alto, CA), Thermo Separation Prod-
ucts SpectraSystem P4000 (San Jose, CA), and Applied Biosystems ABI140B
(Foster City, CA).
3. A multidimensional HPLC system (Integral Microanalytical System, Perseptive
Biosystems, Framingham, MA) is currently used in our laboratory. Other sys-
tems capable of multidimensional chromatography should be suitable.
4. Laser puller (P250, Sutter Instruments, Novato, CA) is used to create a 2-µm tip
for microcolumns (see Note 1).
Direct Analysis of Proteins in Mixtures 19
2.2. Reduction and Carboxyamidation
1. Nitrogen 99.99%.
2. Dithiothreitol (Pierce, Rockville, IL).
3. Iodoacetamide (Pierce).
2.3. Endoproteinase Lys-C Digestion
1. 100 mM Tris-HCl (pH 8.6) 8 M urea.
2. Endoproteinase Lys-C (sequencing grade, Boehringer Mannheim, Indianapolis, IN).
2.4. Trypsin Digestion
1. 100 mM Tris-HCl (pH 8.6).
2. Trypsin (sequencing grade, Boehringer Mannheim).
2.5. Single-Dimension Reversed-Phase HPLC
1. Buffer A: 0.5% aqueous acetic acid.
2. Buffer B: acetonitrile (HPLC grade) + 0.5% aqueous acetic acid 4:1 (v/v).
2.6. Strong Cation-Exchange/Reversed-Phase
Two-Dimensional HPLC
1. Buffer A: 0.5% aqueous acetic acid + acetonitrile (HPLC grade) 95:5 (v/v).
2. Buffer B: acetonitrile (HPLC grade) + 0.5% aqueous acetic acid 4:1 (v/v).
3. Buffer C: 0.5% aqueous acetic acid + acetonitrile (HPLC grade) 95:5 (v/v) con-
taining 250 mM KCl.
4. Buffer D: 0.5% aqueous acetic acid + acetonitrile (HPLC grade) 95:5 (v/v) con-
taining 500 mM KCl.
2.7. HPLC Columns
1. C18 reversed-phase HPLC column 1.0 mm × 25 cm (Vydac, Hesperia, CA).
2. Strong cation-exchange column 1.0 mm × 25 cm (PolyLC, Columbia, MD).
2.8. Micro-HPLC Columns
1. 100-µm ID × 360-µm OD fused-silica capillary (J+W Scientific, Folsom, CA).
2. 50-µm ID × 360-µm OD fused-silica capillary, ≈30 cm length (J+W Scientific).
3. Reversed-phase packing material (POROS R2, Perseptive Biosystems). Other
C18 materials are also suitable.
4. PEEK micro cross (Upchurch, Oak Harbor, WA).
5. 0.025-in. diameter gold wire (Scientific Instruments Service, Ringoe, NY).
3. Methods
After isolation of a protein complex, the proteins must be denatured and
digested with a protease to create a mixture of peptides for analysis. To denature
the complex, it is dissolved in 8 M urea in ammonium bicarbonate. To dissoci-
ate the complex, proteins are reduced and alkylated. The complex is incubated
20 Yates, Link, and Schieltz
with endoproteinase Lys-C followed by dilution of the solution to 2 M urea. The
complex is then digested overnight with trypsin.
3.1. Reduction and Carboxyamidation
1. Add 1 µg dithiothreitol (DTT) for every 50 µg of protein.
2. Incubate at 37°C for 1 h under nitrogen.
3. Add 5 µg iodoacetamide for every 50 µg of protein.
4. Incubate at room temperature in the dark for 30 min.
3.2. Endoproteinase Lys-C Digestion
1. Add 1 µg endoproteinase Lys-C for every 50 µg of protein.
2. Incubate at 37°C for 8 h.
3. Dilute the solution to 2 M urea, 50 mM ammonium bicarbonate, pH 8.6.
3.3. Trypsin Digestion
1. Add 1 µg trypsin for every 50 µg of protein.
2. Incubate at 37°C for 4–8 h.
3. Terminate the reaction by the addition of a few microliters of glacial acetic acid.
3.4. Single Dimension HPLC Separation
of Complex Peptide Mixtures
The resulting complex mixture of peptides is separated using single-dimension
HPLC, typically using microcolumns with diameters of 100 µm or less for high sen-
sitivity analysis. The HPLC flow is thus reduced to 300 nL/min and ions for mass
spectrometric analysis are created using a microelectrospray ion source (Fig. 1).
1. Load a sample on the column by disconnecting it from the ion source and placing
it in a pneumatic “bomb.”
2. Dip the entrance to the column into the sample solution and pressurize the “bomb”
to force liquid onto the column.
3. Collect the liquid displaced from the column to determine the amount loaded
onto the column.
4. Replace the column in the microelectrospray source.
5. Wash salts and other small molecules from the column at 0% B buffer.
6. Use a long gradient (90 min) for the separation (Fig. 2) because of the complex-
ity of the peptide mixture (See Notes 2–4).
3.5. Two-Dimensional HPLC Separation
of Complex Peptide Mixtures
To increase separation resolution for complex peptide mixtures, two-dimen-
sional separations can be used. A convenient form of two-dimensional separation,
combining two orthogonal methods, is to couple together strong cation-exchange
(SCE) and reversed-phase chromatography (Fig. 3). To ensure that all peptide
Direct Analysis of Proteins in Mixtures 21
material enters the mass spectrometer, a step gradient is employed on the ion
exchange separation where each salt step transfers material from the SCE col-
umn to the reversed-phase column. The separation effects fractionation ini-
tially by charge and then by hydrophobicity (see Notes 5 and 6).
1. Initially wash the SCE column with 100% buffer A and then apply a linear aceto-
nitrile gradient to separate peptides by hydrophobicity on the reverced-phase col-
umn. Peptides initially transferred from the ion exchange column are separated
and detected in the mass spectrometer.
2. Use an initial salt step-gradient of 0–5% 250 mM KCl to elute a new fraction of
peptides onto the reversed-phase column (Fig. 4).
3. Repeat the process of using step gradients to elute peptides sequentially from the
ion exchange column onto the reversed-phase column, followed by a reversed-
phase gradient, in 5% increments of salt concentration.
3.6. Tandem Mass Spectrometry (LC/MS/MS or LC/LC/MS/MS)
As peptides elute into the mass spectrometer, data-dependent data acquisition is
performed. In this experiment, the mass spectrometer is set to acquire a conven-
tional scan over the m/z range 400–1600. Ions detected by the data system, above a
preset ion-current threshold, are then automatically selected and a tandem mass
Fig. 1. Configuration for micro-HPLC/microelectrospray ionization. The tip of the
column is directed approx 1–2 mm from the opening of the heated capillary.
22 Yates, Link, and Schieltz
spectrometry (MS/MS) experiment performed each at corresponding m/z value
(see Notes 7 and 8). In the analysis of complex peptide mixtures, the three most
intense peaks are selected for MS/MS experiments and, once a specific ion has
been selected in this way, it is not reselected until after a specified time interval.
3.7. Data Analysis using Database Searching
An enormous amount of data can be generated in both one- and two-dimen-
sional analyses of proteolytically digested protein mixtures. A fast method to
analyze mass spectral data is to use a database of protein sequences (12).
MS/MS data can be readily and automatically matched to amino acid sequences
in the database. By matching to a nonconserved amino acid sequence, at
least 7 residues in length, the protein from which the amino acid sequence was
obtained can be identified. The data obtained from the one- or two-dimen-
sional chromatographic analysis are analyzed using the appropriate database.
If the proteins were derived from an organism whose genome has been com-
Fig. 2. Single-dimension HPLC analysis of the digested products of the human
ribosomal complex. A linear gradient of 90 min from 0–60% buffer B was used to
perform the separation. The oscillations of the ion current are generated by the instru-
ment rapidly switching between MS and MS/MS modes.
Direct Analysis of Proteins in Mixtures 23
pleted, then it is appropriate to search only that database. The ability to search
a database of sequences from an organism whose genome is completed is a
strength of the method for the analysis of protein complexes (see Note 9).
4. Notes
1. Small-diameter tips can also be created by attaching a weight to the fused-silica and
heating the capillary with a hot flame. As the fused-silica melts, the pull of gravity on
the weight stretches the fused-silica to a fine point. A drawback is that the glass needs
to be trimmed. Glass tips produced by this method are frequently not reproducible.
2. The folding and association of proteins in a multimeric protein complex can
inhibit complete proteolysis. To achieve complete proteolysis the complex is
denatured in 8 M urea, reduced, and alkylated. The complex is digested with
endoproteinase Lys-C, which is active in 8 M urea, and then the solution is diluted
to 2 M urea. An overnight digestion with trypsin is performed to create peptides
suitable for tandem mass spectrometry.
3. An integrated microcolumn/microelectrospray ionization system described by
Gatlin et al. (21), is used to separate peptides in a single dimension of reversed-
phase chromatography. The column is fabricated from 100-µm capillary tubing
that has been pulled to a 2–5-µm tip. A 12-cm length of tubing is filled with
10-µm POROS beads. The column is connected to a PEEK micro-cross contain-
Fig. 3. Configuration for 2D LC. A single set of pumps is used to generate the gradi-
ents from a selection of four solvents. The solvent flow is passed through a valve, which
directs the flow to the ion-exchange column. The flow exiting the column can be
directed onto the reversed-phase column or to waste. When a salt step is performed, the
effluent exiting the IEX column is sent to the reversed-phase column. Peptides are bound
to the hydrophobic stationary phase, desalted, and then separated with a linear gradient.
Solvent flow to the reversed-phase column bypasses the IEX column during this step.
24 Yates, Link, and Schieltz
ing a gold electrode through another side arm and is split through a restriction
capillary to send a flow of 200–300 nL/min through the column. A single dimen-
sion separation is typically suitable for the analysis of moderately complex pep-
tide mixtures. A preponderance of single tandem mass spectral matches to
proteins indicates that the mixture needs a higher resolution separation.
4. Typically, protein mixtures containing up to 30 components can be identified in a
single-dimension separation. Two factors must be taken into account to judge the
comprehensiveness of the analysis: the relative quantity of the proteins present and
the molecular weights of the proteins. In general, proteins can be readily identified
when they are within a 30-fold molar ratio of the most abundant component.
5. The pH of the solution is adjusted to 2 using concentrated glacial acetic acid prior
to loading on the 2D-LC system.
Fig. 4. Ion chromatograms for three different step gradients used in the analysis of
the digested products of the S. cerevisiae ribosomal complex. (A) Ion chromatogram
showing the peptides that passed through the ion-exchange column during sample load-
ing and bound to the reversed-phase column. (B) Ion chromatogram showing the pep-
tides removed from the ion-exchange column during a 10–15% 250 mM KCl step
gradient. Peptides were then desalted on the reversed-phase column and separated by
a 60-min linear gradient. (C) Ion chromatogram showing the peptides removed from
the ion-exchange column during a 20–25% 250 mM KCl step gradient. In all three
steps, the ion current for peptides eluting into the mass spectrometer is approximately
the same, indicating good fractionation of peptides across the ion-exchange separation.