molecular diagnosis of infectious diseases, 2nd
Bạn đang xem bản rút gọn của tài liệu. Xem và tải ngay bản đầy đủ của tài liệu tại đây (6.77 MB, 443 trang )
Molecular
Diagnosis of
Infectious
Diseases
Second Edition
Edited by
Jochen Decker
Udo Reischl
M E T H O D S I N M O L E C U L A R M E D I C I N E
TM
Molecular
Diagnosis of
Infectious
Diseases
Second Edition
Edited by
Jochen Decker
Udo Reischl
Proteomic Approaches to Antigen Discovery 3
1
Proteomic Approaches to Antigen Discovery
Karen M. Dobos, John S. Spencer, Ian M. Orme, and John T. Belisle
Abstract
Proteomics has been widely applied to develop two-dimensional polyacrylamide
gel electrophoresis maps and databases, evaluate gene expression profiles under dif-
ferent environmental conditions, assess global changes associated with specific muta-
tions, and define drug targets of bacterial pathogens. When coupled to immunological
assays, proteomics may also be used to identify B-cell and T-cell antigens within com-
plex protein mixtures. This chapter describes the proteomic approaches developed by
our laboratories to accelerate the antigen discovery program for Mycobacterium
tuberculosis. As presented or with minor modifications, these techniques may be uni-
versally applied to other bacterial pathogens or used to identify bacterial proteins pos-
sessing other immunological properties.
Key Words: Proteomics; antigen; B-cell; T-cell; Mycobacterium; bacteria; pathogens.
1. Introduction
The ability to identify antigens produced by bacterial pathogens that are effective
diagnostic or vaccine candidates of disease depends on multiple variables. Two of the
most important variables are the source of clinical specimens (immune T-cells or sera)
used to identify potential antigens and the source or nature of the crude materials
containing the putative antigens. Factors that influence the usefulness of clinical speci-
mens include whether samples were obtained from diseased individuals or experimen-
tally infected animals and the state of disease at the time of specimen collection.
Likewise, the choice between native bacterial products and recombinant products as
the starting material for antigen discovery efforts may significantly influence whether
a useful antigen will be identified. An equally important factor is the number of poten-
tial antigens that can be screened in a single experiment. The use of recombinant
molecular biology methods and the screening of large recombinant libraries is one
approach toward maximizing the number of potential antigen targets (1–4). Although
recombinant expression systems have been widely used for antigen identification, there
3
From:
Methods in Molecular Medicine, vol. 94: Molecular Diagnosis of Infectious Diseases, 2/e
Edited by: J. Decker and U. Reischl © Humana Press Inc., Totowa, NJ
01/Dobos/1-18/F 09/26/2003, 1:59 PM3
4 Dobos et al.
are several potential drawbacks. Specifically, variability between the folding of a
recombinant and native protein can complicate B-cell antigen discovery efforts
(5), and the contamination of recombinant proteins with other bacterial products
such as endotoxin is a major obstacle for cellular assays used to identify T-cell
antigens (6).
The ability to sequence whole genomes rapidly and the availability of several
fully annotated bacterial genomes have profoundly altered the basic experimental
approach to the study of bacterial physiology and pathogenesis (7,8). Previous to the
sequencing of whole bacterial genomes, investigators would typically focus on a
relatively small number of genes or gene products and develop specific assays to
assess the activities or relevance of these gene products. In contrast, the availability
of whole genome sequences has now allowed for the development of methodologies
such as DNA microarrays and proteomics to identify all the genes that are poten-
tially involved in a specific cellular process (9–11). Unlike DNA microarrays, the
technologies commonly used for proteomics studies [two-dimensional polyacryla-
mide gel electrophoresis (2D-PAGE) and mass spectrometry (MS) of peptides] have
been around for decades (12,13). The power of these two technologies was brought
together by the need to assess rapidly all the proteins produced in a particular bacte-
rial species, as well as the development of innovative software that allows for the
interrogation of MS data against genome sequences to identify proteins of interest
(14). These technologies and the philosophy that we no longer need to focus on
select sets of proteins, but should be evaluating the complete proteome in a single
experiment can now be applied to antigen discovery efforts. Moreover, proteomics
technologies allow antigen discovery programs to focus on large sets of native pro-
teins and eliminate a reliance on recombinant technologies to expand the pool of
proteins to be screened.
In our laboratory, 2D-PAGE, Western blot analysis, and liquid chromatography-
mass spectrometry (LC-MS) were used to define 26 proteins of Mycobacterium tuber-
culosis that reacted with patient sera; three of these subsequently were determined to
have significant potential as serodiagnostic reagents (15,16). This approach is a
relatively facile method to screen for B-cell antigens. The use of proteins resolved by
2D-PAGE and transferred to nitrocellulose was also applied to T-cell antigen identifi-
cation (17). Although this work revealed several potential T-cell antigens, there are
restrictions to its use. In particular, the concentration of protein tested is unknown and
the amount of protein obtained is most likely insufficient for multiple assays. Thus, to
increase the protein yield, we recently applied 2D liquid-phase electrophoresis (LPE)
coupled with an in vitro interferon-γ (IFN-γ) assay and LC-tandem MS to identify
30 proteins from the culture filtrate and cytosol of M. tuberculosis that possess a potent
capacity to induce antigen-specific IFN-γ secretion from the splenocytes of M. tuber-
culosis-infected mice (18). In this chapter, we detail the proteomics approach used in
the identification of candidate B- and T-cell antigens from M. tuberculosis. However,
these methods can be universally applied to the discovery of antigens from other
bacterial pathogens as well as parasites.
01/Dobos/1-18/F 09/26/2003, 1:59 PM4
Proteomic Approaches to Antigen Discovery 5
2. Materials
2.1. Preparation of Subcellular Fractions
1. Bacterial cell cultures (400 mL or greater) (see Note 1).
2. Breaking buffer: phosphate-buffered saline (PBS; pH 7.4), 1 mM EDTA, 0.7 µg/mL
pepstatin, 0.5 µg/mL leupeptin, 0.2 mM phenylmethylsulfonyl fluoride (PMSF), 0.6 µg/mL
DNase, µg/mL RNase (see Note 2).
3. NaN
3
.
4. Dialysis buffer: 10 mM ammonium bicarbonate, 1 mM dithiothreitol (DTT), 0.02% NaN
3
.
5. 10 mM ammonium bicarbonate.
6. Vacuum pump.
7. Amicon ultrafiltration unit with a 10,000 Da MWCO membrane (Millipore, Bedford,
MA; cat. no. PLGC07610).
8. 0.2 µm Zap Cap S Plus bottle filtration units (Nalgene, Rochester, NY).
9. Dialysis tubing (3500 Da MWCO).
10. French Press and French Press cell.
11. Sterile 250-mL high-speed centrifuge tubes.
12. Sterile 30-mL ultracentrifuge tubes.
2.2. Identification of B-Cell Antigens
via 2D Western Blot Analysis with Protein/Antigen Double Staining
2.2.1. Optimization of Serum Titers for Detection of Antigens by Western Blot
1. Human or experimental animal sera samples (see Notes 3 and 4).
2. 15% sodium dodecyl sulfate (SDS)-PAGE gels (7 × 10 cm).
3. Protein molecular weight standards.
4. Laemmli sample buffer (5X): 0.36 g Tris-base, 5.0 mL glycerol, 1.0 g SDS, 5.0 mg bro-
mophenol blue, 1.0 mL β-mercaptoethanol; QS to 10 mL with Milli-Q water, vortex, and
store at 4°C or less (19).
5. SDS-PAGE running buffer: 3.02 g Tris-base (pH 8.3), 14.42 g glycine, 1 g SDS per 1 L.
6. Nitrocellulose membrane, 0.22 µm.
7. Transfer buffer: 3.03 g Tris-base (pH 8.3), 14.4 g glycine (pH 8,3), 800 mL H
2
O, 200 mL
CH
3
OH. Dissolve reagents in water before adding CH
3
OH (20).
8. Tris-buffered saline (TBS): 50 mM Tris-HCl (pH 7.4), 150 mM NaCl.
9. Wash buffer: TBS containing 0.5% vol/vol Tween 80.
10. Blocking buffer: wash buffer containing 3% w/v bovine serum albumin (BSA).
11. Anti-human IgG conjugated to horseradish peroxidase (HRP).
12. BM Blue POD substrate, precipitating (Roche Molecular Biochemicals, Indianapolis, IN;
cat. no. 1442066).
13. Mini incubation trays for 2–4 mm nitrocellulose membrane strips (Bio-Rad, Hercules,
CA; cat. no. 170-3902).
2.2.2. 2D Western Blot Analysis for Identification of B-Cell Antigens
1. Isoelectric focusing (IEF) rehydration buffer: 8 M urea, 1% 3[(3-cholamidopropyl)
dimethylammonio]-1-propanesulfonate (CHAPS), 20 mM DTT, 0.5% ampholytes,
0.001% bromphenol blue (see Notes 5–7).
2. Immobilized pH gradient (IPG) strips (21) (see Note 8).
3. SDS-PAGE equilibration buffer: 150 mM Tris-HCl (pH 8.5), 0.2% SDS, 10% glycerol,
20 mM DTT, and 0.001% bromphenol blue.
01/Dobos/1-18/F 09/26/2003, 1:59 PM5
6 Dobos et al.
4. 1% agarose dissolved in Milli-Q water.
5. Preparative SDS-PAGE gels (16 × 20 cm).
6. Protein molecular weight standards.
7. SDS-PAGE running buffer (see Subheading 2.2.1., item 5).
8. Coomassie stain: 1% coomassie brilliant blue R-250 in 40% methanol, 10% acetic acid
(see Note 9).
9. Coomassie destain 1: 40% methanol, 10% acetic acid.
10. Coomassie destain 2: 5% methanol.
11. Transfer buffer (see Subheading 2.2.1., item 7).
12. Nitrocellulose, 0.22 µm.
13. Digoxigenin-3-O-methylcarbonyl-ε-aminocaproic acid-N-hydroxysuccinimide ester
(DIG-NHS) (Roche Molecular Biochemicals; cat. no. 1333054); 0.5 mg/mL in N,N-
dimethylformamide (DMF).
14. 50 mM potassium phosphate buffer (pH 8.5).
15. TBS: 50 mM Tris-HCl (pH 7.4), 150 mM NaCl.
16. Nonidet P-40, 10% solution.
17. H
2
O
2
, 30% solution.
18. Anti-digoxigenin-alkaline phosphatase, Fab fragments (Roche Molecular Biochemicals;
cat. no. 1093274).
19. INT/BCIP stock solution (Roche Molecular Biochemicals; cat. no. 1681460).
20. INT/BCIP buffer: 100 mM Tris-HCl (pH 9.5), 50 mM MgCl
2
, 10 mM NaCl.
21. Anti-human IgG conjugated to HRP.
22. IPGphor IEF unit (Amersham Biosciences, Piscataway, NJ) or similar system.
23. SDS-PAGE electrophoresis unit.
24. Gel documentation system.
25. PDQuest 2D-gel analysis software (Bio-Rad) or similar software.
2.2.3. Molecular Identification of Serum Reactive Proteins
1. 0.2 M ammonium bicarbonate.
2. Trifluoroacetic acid (TFA; 10% solution).
3. Destain solution: 60% acetonitrile, in 0.2 M ammonium bicarbonate.
4. Extraction solution: 60% acetonitrile, 0.1% TFA.
5. Modified trypsin, sequencing grade (Roche Molecular Biochemicals; cat. no. 1418025).
6. Washed microcentrifuge tubes (0.65 mL) (see Note 10).
7. Electrospray tandem mass spectrometer (such as LCQ classic, Thermo-Finnigan) coupled
to a capillary high-performance liquid chromatography (HPLC) device.
8. Capillary C
18
-reverse phase (RP)-HPLC column.
9. Sequest software (14) for interrogating MS and MS/MS data against genomic or protein
databases, or similar software.
2.3. Identification of T-Cell Antigens
2.3.1. 2D-LPE of Subcellular Fractions
1. IEF protein solubilization buffer: 8 M urea, 1 mM DTT, 5% glycerol, 2% Nonidet P-40,
and 2% ampholytes (pH 3.0–10.0 and pH 4.0–6.5 in a ratio of 1:4; see Note 7).
2. Preparative SDS-PAGE gels (16 × 20 cm).
3. SDS-PAGE running buffer (see Subheading 2.2.1., item 5).
4. Laemmli sample buffer (see Subheading 2.2.1., item 4).
5. 10 mM ammonium bicarbonate.
01/Dobos/1-18/F 09/26/2003, 1:59 PM6
Proteomic Approaches to Antigen Discovery 7
6. Rotofor preparative IEF unit (Bio-Rad).
7. Whole Gel Eluter (Bio-Rad).
2.3.2. Assay of IFN-
γ
Induction for Identification of T-Cell Antigens
1. Spleens from infected and naive mice (see Note 11).
2. Complete RPMI medium (RPMI-1640 medium with
L-glutamine, supplemented with
10% bovine fetal calf serum and 50 µM β-mercaptoethanol) (see Note 12).
3. Hanks’ balanced salt solution (HBSS).
4. Gey’s hypotonic red blood cell lysis solution: 155 mM NH
4
Cl, 10 mM KHCO
3
; use pyro-
gen-free water and filter-sterilize.
5. IFN-γ enzyme-linked immunosorbent assay (ELISA) assay kit (Genzyme Diagnostics,
Cambridge, MA) (see Note 13).
6. Concanavalin A (Con A) (see Note 14).
7. 70-µm nylon screen (Becton/Dickinson, Franklin Lakes, NJ; cat. no. 35-2350).
8. 96-well sterile tissue culture plates with lids.
9. 96-well microtiter ELISA plates, Dynex Immunlon 4 (Dynex, Chantilly, VA).
10. Conical polypropylene centrifuge tubes (15 and 50 mL).
11. Sterile tissue culture grade Petri dishes (60 mm).
12. Syringes (3 mL) with 1-inch 22-gage needles.
13. Hemocytometer.
14. Tissue culture incubator (5% CO
2
, 37°C).
15. ELISA plate reader.
3. Methods
3.1. Preparation of Bacterial Subcellular Fractions (
see
Note 15)
1. Grow bacterial cells to mid log phase. The medium used should be devoid of exogenous
proteins, such as BSA, that may interfere with 2D-PAGE analyses (see Note 1).
2. Harvest cells by centrifugation at 3500g. Decant the culture supernatant and save.
Wash the cell pellet with PBS (pH 7.4) and freeze until preparation of subcellular frac-
tions (see Note 16).
3. Add NaN
3
to the culture supernatant at a final concentration of 0.04% (w/v).
4. Filter the supernatant using a 0.2-µm filtration unit.
5. Concentrate the culture filtrate to 0.5% of its original volume using an Amicon ultrafiltra-
tion unit fitted with a 10-kDa MWCO membrane.
6. Dialyze the concentrated culture filtrate proteins (CFP) against dialysis buffer with at
least two changes of this buffer, followed by a final dialysis step against 10 mM ammo-
nium bicarbonate.
7. Filter-sterilize the dialyzed CFP using a 0.2-µm syringe filter or filtration unit.
8. Determine the protein concentration.
9. Store the final culture filtrate preparation at –80°C (see Note 17).
10. Place the frozen cell pellet at 4°C and thaw.
11. Suspend the cells in ice-cold breaking buffer to a final concentration of 2 g of cells
(wet weight) per mL of buffer.
12. Place the cell suspension in a French press cell and lyse via mechanical shearing by
applying 20,000 psi of pressure with a French press. Collect the lysate from the French
press cell and place on ice (see Note 18).
13. To the lysate add an equal volume of breaking buffer and mix.
01/Dobos/1-18/F 09/26/2003, 1:59 PM7
8 Dobos et al.
14. Remove unbroken cells by centrifugation of the lysate at 3500g, 4°C in the tabletop cen-
trifuge for 15 min.
15. Collect the supernatant; this is the whole cell lysate.
16. Further separation of the whole cell lysate into cell wall, cell membrane, and cytosol is
achieved by differential centrifugation (22). First, centrifuge the lysate at 27,000g, 4°C
for 30 min. Collect the supernatant and again centrifuge under the same conditions.
Collect the supernatant and store at 4°C.
17. Suspend the 27,000g pellets in breaking buffer, combine them, and centrifuge at 27,000g,
4°C for 30 min. Discard the supernatant, and wash the pellet twice in breaking buffer.
The final 27,000g pellet represents the purified cell wall. Suspend this pellet in 10 mM
ammonium bicarbonate and extensively dialyze against 10 mM ammonium bicarbonate.
18. Store the dialyzed cell wall suspension at –80°C, after estimating the protein concentra-
tion (see Note 17).
19. Add the supernatant collected in step 16 to ultracentrifuge tubes and centrifuge at
100,000g, 4°C for 4 h.
20. Collect the supernatant and centrifuge again under the same conditions.
21. The final supernatant solution represents the cytosol fraction. Dialyze the cytosol exten-
sively against 10 mM ammonium bicarbonate, determine the protein concentration, and
store at –80°C (see Note 17).
22. Suspend the 100,000g pellets obtained in steps 19 and 20 in breaking buffer, combine,
and again centrifuge at 100,000g, 4°C for 4 h. This should be repeated twice.
23. The final 100,000g pellet represents the total membrane. Suspend the membranes in
10 mM ammonium bicarbonate, dialyze extensively against 10 mM ammonium bicar-
bonate, determine the protein concentration, and store at –80°C (see Note 17).
3.2. Identification of B-Cell Antigens
via 2D Western Blot Analysis with Protein/Antigen Double Staining
3.2.1. Optimization of Serum Titers for Detection of Antigens by Western Blot
1. Obtain and thaw a 100-µg aliquot (based on protein concentration) of the subcellular
fraction to be analyzed. One 100-µg aliquot will provide enough protein to optimize one
patient’s serum or one sera pool and one matched control.
2. Dry the samples using a lyophilizer or speed vac.
3. Suspend the subcellular fraction in 80 µL PBS (pH 7.4).
4. Add 20 µL of 5X Laemmli sample buffer to the sample and heat at 100°C for 5 min.
5. Apply 100 µL of sample to one preparative 15% SDS-polyacrylamide gel.
6. Resolve the proteins by 1D SDS-PAGE (19).
7. After the electrophoresis is completed, assemble the gel into a Western blot apparatus and
electrotransfer the proteins to a nitrocellulose membrane (20).
8. Remove the nitrocellulose membrane and cut 2-mm vertical strips.
9. Place individual nitrocellulose strips in the wells of a mini incubation tray. Add 500 µL of
blocking buffer to each well and rock for 1 h at room temperature (RT) or overnight at 4°C.
10. Thaw the serum samples and generate dilutions (200 µL for each dilution) of the sera
from 1:10 to 1:10,000 (see Note 19).
11. Incubate each strip with a single dilution of serum for 1 h at RT with gentle agitation.
12. Wash the strips repeatedly with 500 µL of wash buffer (minimally, five times).
13. Incubate the strips with 200 µL of the appropriate dilution of the anti-human IgG HRP for
1 h at RT with gentle agitation.
01/Dobos/1-18/F 09/26/2003, 1:59 PM8
Proteomic Approaches to Antigen Discovery 9
14. Wash the strips repeatedly with 500 µL of TBS (minimally, five times).
15. Develop the strips by addition of BM Blue POD substrate (200 µL, final volume per
strip).
16. Stop the reaction by decanting the substrate and rinsing the strips with Milli-Q water.
17. Determine optimum titer based on band intensity and background staining (see Note 20).
3.2.2. 2D Western Blot Analysis for Identification of B-Cell Antigens
1. Obtain and thaw 400-µg aliquots (see Note 17) of the subcellular fractions to be ana-
lyzed. For each subcellular fraction or analysis, at least two aliquots of the selected
subcellular fraction will be required, one for the 2D Western blot and one for a Coomassie-
stained 2D gel. More aliquots will be required if replicate Western blots are to be per-
formed or if comparisons between serum samples/pools are to be performed, such as a
comparison between infected and healthy control serum.
2. Dry each aliquot of the subcellular fraction by lyophilization (see Note 21).
3. Add 200 µL of rehydration buffer to each dried subcellular fraction and allow to stand at
RT for 4 h or at 4°C overnight. Gentle vortexing can be applied if required.
4. Centrifuge the samples at 10,000g for 30 min, and remove the supernatant without dis-
turbing the pellet (see Note 22).
5. Transfer samples to IPG strips and allow the strips to rehydrate per manufacturer’s rec-
ommendations.
6. Resolve proteins by IEF (12).
7. Remove strips from the IEF apparatus, and place in 16 × 150-mm glass test tubes with the
acidic end of the strip near the mouth of the tube. Apply 10 mL of SDS-PAGE equilibra-
tion buffer, and incubate at RT for 15 min.
8. Warm 1% agarose solution while IPG strips are equilibrating.
9. Assemble 16 × 20-cm preparative SDS-PAGE gels into an electrophoresis apparatus.
Add running buffer to cover the lower half of the gels and inner core of the electrophore-
sis apparatus.
10. Remove IPG strips, clip ends of IPG strips (where no gel is present), and guide each strip
into the well of the preparative SDS-PAGE gels using a flat spatula or small pipet tip.
The acidic end of the IPG strip should be next to the reference well for the molecular
weight standards.
11. Overlay each strip with 1% agarose. When adding agarose, move from one end of the
strip to the other. This helps prevent the trapping of air bubbles between the strip and
interface of the SDS-PAGE gel. Use enough agarose to cover the strip fully.
12. Add molecular weight standards to the reference well of each gel.
13. Resolve proteins in the second dimension by electrophoresis (19).
14. Remove the preparative SDS-PAGE gels. Stain one gel with Coomassie (see Note 9).
15. After staining, use a gel documentation system to scan a tif image of the gel. Ensure that
the gel is scanned under parameters compatible with the 2D gel analysis software that
will be used.
16. Place the gel in a storage tray, cover with Milli-Q water, seal, and store at 4°C.
17. Assemble the second gel into a Western blot apparatus and electrotransfer the proteins to
a nitrocellulose membrane (20).
18. Wash nitrocellulose membrane five times with 20 mL of 50 mM potassium phosphate
(pH 8.5).
19. Prepare total protein labeling solution by adding 10 µL of DIG-NHS and 20 µL of
10% Nonidet P-40 to 20 mL of 50 mM potassium phosphate buffer (pH 8.5).
01/Dobos/1-18/F 09/26/2003, 1:59 PM9
10 Dobos et al.
20. Incubate membrane in labeling solution for 1 h at RT with gentle agitation.
21. Wash the membrane five times in 20 mL of TBS.
22. Incubate the labeled membrane in blocking buffer for 1 h at RT with gentle agitation.
23. Wash the membrane briefly with TBS.
24. Add serum at the titer optimized in Subheading 3.2.1. and incubate at RT for 1 h with
gentle agitation.
25. Wash the membrane five times with 20 mL TBS.
26. Add 20 µL of anti-digoxigenin-alkaline phosphatase to 20 mL of TBS and incubate the
membrane in this solution for 1 h with gentle agitation.
27. Wash the membrane five times with 20 mL of TBS.
28. Add anti-human IgG HRP diluted per manufacturer’s instructions into TBS, and incubate
the membrane in this solution for 1 h at RT with gentle agitation.
29. Wash the membrane five times with 20 mL of TBS.
30. Rinse the membrane briefly in Milli-Q water.
31. To visualize the serum-specific antigens, incubate the membrane in 10 mL of BM Blue
POD substrate without agitation. Watch the membranes for blue/purple color development.
32. Aspirate the substrate as soon as color develops, and rinse briefly with Milli-Q water.
33. Using a gel documentation system, capture a tif image of the Western blot showing the
serum reactive proteins.
34. To visualize the total protein profile on the Western blot, generate the alkaline phos-
phatase substrate by adding 75 µL of INT/BCIP stock solution to 10 mL of INT/BCIP
buffer. Add to the membrane, incubate without agitation, and watch for color development.
35. Aspirate the substrate solution when reddish brown spots are well defined, and rinse the
membrane briefly with Milli-Q water.
36. Using a gel documentation system, capture a tif image of the Western blot showing the
total protein profile.
37. Transfer the images of the Coomassie-stained gel, the serum reactive proteins, and the
total protein profile of the 2D Western blot to a 2D analysis program. Using this program,
match the spots of the three images to allow for identification of the protein spots within
the Coomassie-stained 2D gel that correspond to the serum reactive proteins.
3.2.3. Molecular Identification of Serum Reactive Proteins
1. From the Coomassie-stained 2D-gel, excise the protein spots corresponding to those
reactive to serum on the 2D Western blot.
2. Cut each gel slice into small pieces (1 × 1 mm), and place the gel pieces from each spot in
separate washed microcentrifuge tubes.
3. Destain by covering the gel pieces with destain solution, and incubate at 37°C for 30 min.
4. Discard the acetonitrile solution and repeat step 3 until the gel slices are completely
destained.
5. Dry the gel pieces under vacuum.
6. Dissolve 25 µg of modified trypsin in 300 µL of 0.2 M ammonium bicarbonate.
7. Add 3–5 µL of the trypsin solution to the gel slices.
8. Incubate at room temperature until the trypsin solution is completely absorbed by the gel,
approx 15 min.
9. Add 0.2 M ammonium bicarbonate in 10–15 µL increments to rehydrate the gel pieces
completely. Allow about 10 min for each aliquot of ammonium bicarbonate to be absorbed
by the gel. Also avoid adding an excess of ammonium bicarbonate solution.
10. Incubate the gel slices for 4–12 h at 37°C.
01/Dobos/1-18/F 09/26/2003, 1:59 PM10
Proteomic Approaches to Antigen Discovery 11
11. Terminate the reaction by adding 0.1 vol of 10% TFA.
12. Collect the supernatant, and place it in a new washed microcentrifuge tube.
13. Add 100-µL of the extract solution to the gel slices and vortex.
14. Incubate the extract solution and gel slices at 37°C for 40 min.
15. Centrifuge the extract, collect the supernatant, and add it to the supernatant collected in
step 12.
16. Repeat steps 13–15.
17. Dry the extract under vacuum.
18. Store the dried peptide extracts at –20°C until analysis by LC-MS/MS (14).
3.3. Identification of T-Cell Antigens (
see
Note 23)
3.3.1. 2D-LPE of Subcellular Fractions
1. Obtain and thaw 250-mg aliquots of the subcellular fraction(s) to be analyzed.
2. Dry the subcellular fraction by lyophilization (see Note 21)
3. Solubilize the proteins by adding 60 mL IEF rehydration buffer, and incubate at RT for
4 h or at 4°C overnight.
4. Centrifuge the suspended material at 27,000g to remove particulates (see Note 22).
5. Collect the supernatant and apply this material to the Rotofor (Bio-Rad) apparatus per the
manufacturer’s instructions. Preparative IEF of the sample should be performed at a con-
stant power of 12 W until the voltage stops increasing and stabilizes (see Note 24).
6. Harvest the samples from the Rotofor per manufacturer’s instructions.
7. Evaluate 8–10 µL of each preparative IEF fraction by SDS-PAGE and Coomassie staining.
8. Pool those fractions that have a high degree of overlap in their protein profile as observed
by SDS-PAGE (see Note 25).
9. Dialyze the IEF fractions extensively against ammonium bicarbonate. After dialysis
determine the protein concentration.
10. Split the IEF fractions into 5-mg aliquots and dry by lyophilization or speed vac.
11. To separate each IEF fraction in the second dimension, solubilize 5 mg of each fraction in
1.6 mL of PBS and add 0.4 mL of 5X Laemmli sample buffer.
12. Apply each fraction to the preparative well of a 16 × 20-cm SDS-PAGE gel (see Note 26).
13. Resolve proteins in the second dimension by electrophoresis.
14. Remove polyacrylamide gels from glass plates and soak in 100 mL of 10 mM ammonium
bicarbonate for 30 min with one change of the 10 mM ammonium bicarbonate.
15. While the gel is equilibrating in 10 mM ammonium bicarbonate, assemble the Whole Gel
Eluter (Bio-Rad) per manufacturer’s instructions and fill the Whole Gel Eluter wells with
10 mM ammonium bicarbonate (see Note 27).
16. Cut SDS-PAGE gel to the dimension of the Whole Gel Eluter.
17. Lay the SDS-PAGE gel on top of Whole Gel Eluter wells. Orientate the gel so that protein
bands run parallel to the wells.
18. Complete the setup of the Whole Gel Eluter per manufacturer’s instructions, and elute the
proteins at 250 mA for 90 min.
19. At the end of the elution, reverse the current on the Whole Gel Eluter for 20 s.
20. Harvest the samples from the Whole Gel Eluter per manufacturer’s instructions, This will
yield 30 fractions of approximately 2.5 mL each.
21. Filter sterilize each fraction with a 0.2-µm PTFE syringe filter. (Use aseptic techniques
for subsequent manipulation of the 2D-LPE fractions.)
22. Determine the protein concentration of each fraction.
23. Split each fraction into 10-µg aliquots, lyophilize, and store at –80°C.
01/Dobos/1-18/F 09/26/2003, 1:59 PM11
12 Dobos et al.
3.3.2. Assay of IFN-
γ
Induction for Identification of T-Cell Antigens
1. Euthanize infected and naive mice, harvest spleens, and place into separate sterile petri
dishes containing a minimal volume of HBSS.
2. Fill a syringe (3 mL) with 3 mL HBSS, and attach a 22-gage needle. Insert the needle into
the spleen while holding it with sterile forceps. Flush the cells from the spleen, and col-
lect the cells in the sterile Petri dish, Repeat this procedure multiple times using different
injection sites. Transfer the flushed cells to a 50-mL conical tube (see Note 28).
3. Press the spleen remnant against a 70-µm nylon mesh screen. Use the black rubber end of
a 1-mL syringe plunger to press the spleen remnant and to force the remaining cells
through the nylon screen. Filter the cells through the screen by holding it above the Petri
dish and flushing with 3 mL of HBSS.
4. Pool collected splenocytes and centrifuge at 1000g, 4°C for 10 min.
5. Suspend the cell pellet in a minimal volume of HBSS (3 mL) using a sterile pipet. Add
Gey’s hypotonic solution (5 mL per spleen), and incubate for 10 min at RT to lyse RBCs.
Centrifuge the cells at 1000g, 4°C for 10 min.
6. Decant the supernatant and gently suspend cells with HBSS.
7. Centrifuge the cells at 1000g, 4°C for 10 min.
8. Repeat steps 6 and 7.
9. Suspend the cell pellet in complete RPMI medium (5 mL per spleen).
10. Determine the cell concentration by counting in a hemocytometer.
11. Dilute the cell suspension to 2 × 10
6
cells/mL in complete RPMI medium.
12. Plate the cells into 96-well tissue culture plates at 2 × 10
5
cells/well (100 µL).
13. Suspend protein antigens produced by 2D-LPE in complete RPMI medium at 20 µg/mL.
14. Add protein antigens/fractions (2 µg/well) to each of the tissue culture wells. Each indi-
vidual protein fraction should be added to triplicate wells of the tissue culture plates con-
taining the splenocytes from infected or uninfected animals. (Include Con A and a known
protein antigen as positive controls and complete RPMI medium alone as the negative
control.)
15. Incubate in a tissue culture incubator at 37°C for 4 d.
16. Remove 150 µL of cell culture supernatant from each well and assay for IFN-γ levels
using an IFN-γ ELISA kit per manufacturer’s instructions.
17. Evaluate the IFN-γ production to splenocytes from naive mice. Any protein fraction that
induces an IFN-γ response threefold or greater than the positive control antigen with the
naive splenocytes would be considered to be producing a nonspecific response. Deter-
mine the average IFN-γ response induced by all the 2D-LPE fractions added to
splenocytes of infected mice. Compare the IFN-γ response of individual 2D-LPE frac-
tions with the above average to identify the immunodominant 2D-LPE fractions. In gen-
eral, those fractions that induce an IFN-γ response threefold or greater than the average
IFN-γ response are considered immunodominant fractions.
18. Resolve the protein(s) of the immunodominant 2D-LPE fractions by SDS-PAGE. Excise
the protein band(s) and identify the protein(s) via proteolytic digestion and LC-MS/MS
as described in Subheading 3.2.3.
4. Notes
1. A 400-mL culture will generate adequate quantities of material for proteomic analyses of
B-cell antigens. Larger cultures (5–20 L), however, should be grown to obtain adequate
amounts of starting material for the preparation of subcellular fractions to be used in the
identification of T-cell antigens.
01/Dobos/1-18/F 09/26/2003, 1:59 PM12
Proteomic Approaches to Antigen Discovery 13
2. Fresh breaking buffer should be prepared for each use. The protease inhibitors and
nucleases can be prepared as stock solutions and stored at –20°C (pepstatin, 3 mg/mL in
ethanol; leupeptin, 1 mg/mL in ethanol; PMSF 100 mM in isopropanol; DNase 1 mg/mL
in PBS; and RNase 1 mg/mL in PBS).
3. In this chapter, the method described for the identification of B-cell antigens utilizes
human sera. However, this same methodology can be applied with sera for experimen-
tally or naturally infected animals. Optimally, when defining B-cell antigens, the sera
should be grouped according to disease state, and matched control sera should also be
included.
4. In some cases of sera from naturally infected hosts, preabsorption with lysate of a heter-
ologous pathogen may be required to remove antibodies to highly crossreactive antigens.
For example, we have utilized a lysate of E. coli to preabsorb sera from tuberculosis
patients and healthy controls (15).
5. Deionize urea by stirring 5 g of washed AG 501-X8 resin per 100 mL of 8 M urea for 1 h.
6. The pH range of the ampholytes should be equal to the pH range of the IPG strips. Addi-
tionally, the final concentration of ampholytes recommended may differ between the
manufacturers of IPG strips.
7. Different detergents and concentrations may be required to solubilize membrane or cell
wall proteins. For instance, the IEF rehydration or protein solubilization buffers we use to
solubilize cell wall proteins of M. tuberculosis contain 1% Nonidet P-40 and 1% ASB-14.
Others have recommended using 2 M thiourea along with 7 M urea or 1% Zwittergent
3-10 for solubilization of cell wall and membrane proteins (23,24).
8. The IPG strips selected should reflect the general pI range of the proteins to be separated.
The IPG strips selected must be able to fit in the prep well of the SDS-PAGE gels avail-
able to the laboratory.
9. The procedures described use Coomassie R-250 for the staining of gels. However,
MS-compatible silver stains or fluorescence stains such as Sypro-Ruby may be substi-
tuted (25).
10. Wash microcentrifuge tubes by filling with 60% acetonitrile/0.1% TFA, followed by
incubation at RT for 1 h. This process is repeated two times for each tube.
11. The procedures described in this chapter utilize spleens from mice experimentally
infected with M. tuberculosis to obtain immune T-cells. The method for experimental
infection will vary based on the pathogen. Other organs or tissues, such as the lungs or
lymph nodes, may be used to obtain immune T-cells. Additionally, the T-cell assays
can be performed using whole blood or peripheral blood mononuclear cells from human
donors (26).
12. The quality of fetal bovine serum may vary depending on the source. Individual lots
should be tested in tissue culture to ensure that they support optimal growth and are free
of endotoxin.
13. The kit described is for use in T-cell assays involving mouse blood or tissue homogenates.
Kits compatible for use with other experimentally or naturally infected hosts are also
available (27).
14. Con A is a lectin with T-cell mitogenic properties and is included for use as a positive
control (28). The dose of Con A that induces maximum levels of IFN-γ should be tested
empirically but is usually around 1–10 µg/mL.
15. The methods described in this chapter are those commonly used to prepare subcellular
fractions in our laboratory. Nevertheless, other methods are available for the preparation
of subcellular fractions (29,30).
01/Dobos/1-18/F 09/26/2003, 1:59 PM13
14 Dobos et al.
16. For biosafety level 3 pathogens such as M. tuberculosis, the cells should be inactivated
with methods that do not destroy protein structure. We commonly use γ-irradiation; how-
ever, other methods, including supercritical carbon dioxide (31), hydrostatic pressure (32),
and ultrasound treatment (33), are available.
17. Subcellular fractions should be aliquoted prior to storage. The aliquots generated depend
on the downstream use of the proteins. For B-cell antigen identification, aliquots of 100
and 400 µg should be generated. For T-cell antigen identification, 250-mg aliquots should
be generated.
18. One pass through the French press cell may not be sufficient for complete lysis. If required,
the cell suspension may be passed through the French press multiple times. Gram staining
and light microscopy should be used to check the efficiency of bacterial cell lysis.
19. Serum is generally pooled according to disease state and the Western blot optimization,
and antigen detection procedures are conducted with the pooled sera. This is done to
conserve sera samples and to define the immunodominant B-cell antigens representative
for an entire population (34). Dilutions used are 1:10, 1:50, 1:100, 1:500; 1:1000, 1:5000,
and 1:10,000.
20. The optimum serum titer is defined as the dilution of serum that provides a strong signal
intensity with the largest number of protein bands after 2–3 min of color development.
The individual reactive protein bands at the optimal titer should be clearly defined and
not appear as one large undefined area of serum reactivity.
21. Lyophilization should be used for drying of protein samples that are targeted for
2D-PAGE or 2D-LPE. This method of drying is relatively gentle and allows for more
efficient resolubilization of the proteins. Ammonium bicarbonate should be completely
volatilized in the drying process. Incomplete removal of ammonium bicarbonate may
interfere with the IEF separation of the proteins. If the odor of ammonia can be detected
in the sample after lyophilization, add a small volume of Milli-Q water (200 µL) and
repeat lyophilization.
22. The presence of insoluble material in the protein solution added to the IPG strip will
cause horizontal streaking in the 2D gel.
23. The cellular assays used for the detection of T-cell activation can be significantly influenced
by contamination of protein samples with endotoxin (6). Thus, great care must be taken to
avoid the introduction of endotoxin during the separation of proteins by 2D-LPE. Buffers
should be made with high-quality endotoxin-free water and in endotoxin-free glassware.
24. During the preparative IEF of proteins with the Rotofor unit, the voltage will gradually
increase during the course of the run and then plateau (generally around 1200–1400 volts).
The voltage of the Rotofor unit should be taken every 15–30 min and graphically dis-
played. The IEF is complete once the voltage has stabilized. Allow the run to continue for
30 min after the voltage has stabilized and then harvest the proteins. A typical IEF run
with the buffer described in this chapter will take 3–4.5 h to complete.
25. Separation of large protein pools by preparative IEF under the conditions described gener-
ally results in excellent resolution of proteins contained in the pH 4–10 fractions.
However, considerable protein overlap can be observed between fractions at the extreme
ends of the pH gradient (3.0–4.0 and 10–12). As a general rule, the two to three fractions
at each end of the gradient should be pooled based on their protein profile by SDS-PAGE.
26. The separation of proteins by preparative SDS-PAGE can cause a bottleneck in the
2D-LPE procedure. A single SDS-PAGE run at 35 mA will take approx 5 h. Addition-
ally, it is not recommended to run more gels than can be immediately electroeluted.
The storage of unfixed gels will result in diffusion of proteins within the gel.
01/Dobos/1-18/F 09/26/2003, 1:59 PM14
Proteomic Approaches to Antigen Discovery 15
27. In setting up the Whole Gel Eluter, it is essential to remove any air bubbles trapped
between the cellulose filter paper and the cellophane that are placed on the cathode of
the apparatus, and air bubbles between the gel and the wells of the Whole Gel Eluter.
The presence of bubbles will interfere with efficient recovery of sample and may distort
the flow of current, resulting in the uneven movement of proteins from the gel to the
eluter wells.
28. Other methods of harvesting splenocytes include mincing the spleen into small fragments,
followed by passage through a nylon cell strainer (35) or crushing the spleen in a glass
tissue homogenizer (36). We have found that gentle flushing of spleen cells using a
syringe, followed by passage of the remnant through a nylon strainer, produces highly
viable cells that are less likely to undergo the autolysis and cell death associated with
other techniques of cell isolation.
References
1. Weldon, S. K., Mosier, D. A., Simons, K. R., Craven, R. C., and Confer, A. W. (1994)
Identification of a potentially important antigen of Pasteurella haemolytica. Vet.
Microbiol. 40, 283–291.
2. Skeiky, Y. A., Ovendale, P. J., Jen, S., et al. (2000) T cell expression cloning of a Myco-
bacterium tuberculosis gene encoding a protective antigen associated with the early con-
trol of infection. J. Immunol. 165, 7140–7149.
3. Cortese, R., Felici, F., Galfre, G., Luzzago, A., Monaci, P., and Nicosia, A. (1994) Epitope
discovery using peptide libraries displayed on phage. Trends Biotechnol. 12, 262–267.
4. Amara, R. R. and Satchidanandam, V. (1996) Analysis of a genomic DNA expression
library of Mycobacterium tuberculosis using tuberculosis patient sera: evidence for modu-
lation of host immune response. Infect. Immun. 64, 3765–3771.
5. Chen, X. G., Gong, Y., Hua, L., Lun, Z. R., and Fung, M. C. (2001) High-level expression
and purification of immunogenic recombinant SAG1 (P30) of Toxoplasma gondii in
Escherichia coli. Protein Expr. Purif. 23, 33–37.
6. Gao, B. and Tsan, M. F. (2003) Endotoxin contamination in recombinant human heat shock
protein 70 (Hsp70) preparation is responsible for the induction of tumor necrosis factor
alpha release by murine macrophages. J. Biol. Chem. 278, 174–179.
7. Laub, M. T., McAdams, H. H., Feldblyum, T., Fraser, C. M., and Shapiro, L. (2000) Glo-
bal analysis of the genetic network controlling a bacterial cell cycle. Science 290, 2144–
2148.
8. Schoolnik, G. K. (2002) Microarray analysis of bacterial pathogenicity. Adv. Microb.
Physiol. 46, 1–45.
9. Banerjee, N. and Zhang, M. Q. (2002) Functional genomics as applied to mapping tran-
scription regulatory networks. Curr. Opin. Microbiol. 5, 313–317.
10. Conway, T. and Schoolnik, G. K. (2003) Microarray expression profiling: capturing a
genome-wide portrait of the transcriptome. Mol. Microbiol. 47, 879–889.
11. Yue, H., Eastman, P. S., Wang, B. B., et al. (2001) An evaluation of the performance of
cDNA microarrays for detecting changes in global mRNA expression. Nucleic Acids Res.
29, E41–51.
12. O’Farrell, P. H. (1975) High resolution two-dimensional electrophoresis of proteins.
J. Biol. Chem. 250, 4007–4021.
13. Johnson, R. S. and Biemann, K. (1987) The primary structure of thioredoxin from
Chromatium vinosum determined by high-performance tandem mass spectrometry.
Biochemistry 26, 1209–1214.
01/Dobos/1-18/F 09/26/2003, 1:59 PM15
16 Dobos et al.
14. Eng, J. K., McCormack, A. L., and Yates, J. R. (1994) An approach to correlate tandem
mass-spectral data of peptides with amino-acid-sequences in a protein database. J. Am.
Soc. Mass Spectrom. 5, 976–989.
15. Laal, S., Samanich, K. M., Sonnenberg, M. G., Zolla-Pazner, S., Phadtare, J. M., and
Belisle, J. T. (1997) Human humoral responses to antigens of Mycobacterium tuberculo-
sis: immunodominance of high-molecular-mass antigens. Clin. Diagn. Lab. Immunol. 4,
49–56.
16. Samanich, K. M., Belisle, J. T., Sonnenberg, M. G., Keen, M. A., Zolla-Pazner, S., and
Laal, S. (1998) Delineation of human antibody responses to culture filtrate antigens of
Mycobacterium tuberculosis. J. Infect. Dis. 178, 1534–1538.
17. Gulle, H., Fray, L. M., Gormley, E. P., Murray, A., and Moriarty, K. M. (1995) Responses
of bovine T cells to fractionated lysate and culture filtrate proteins of Mycobacterium
bovis BCG. Vet. Immunol. Immunopathol. 48, 183–190.
18. Covert, B. A., Spencer, J. S., Orme, I. M., and Belisle, J. T. (2001) The application of
proteomics in defining the T cell antigens of Mycobacterium tuberculosis. Proteomics 1,
574–586.
19. Laemmli, U. K. (1970) Cleavage of structural proteins during the assembly of the head of
bacteriophage T4. Nature 227, 680–685.
20. Towbin, H., Staehelin, T., and Gordon, J. (1979) Electrophoretic transfer of proteins from
polyacrylamide gels to nitrocellulose sheets: procedure and some applications. Proc. Natl.
Acad. Sci. USA 76, 4350–4354.
21. Gorg, A., Obermaier, C., Boguth, G., and Weiss, W. (1999) Recent developments in
two-dimensional gel electrophoresis with immobilized pH gradients: wide pH gradients
up to pH 12, longer separation distances and simplified procedures. Electrophoresis 20,
712–717.
22. Hirschfield, G. R., McNeil, M., and Brennan, P. J. (1990) Peptidoglycan-associated
polypeptides of Mycobacterium tuberculosis. J. Bacteriol. 172, 1005–1013.
23. Lanne, B., Potthast, F., Hoglund, A., et al. (2001) Thiourea enhances mapping of the
proteome from murine white adipose tissue. Proteomics 1, 819–828.
24. Henningsen, R., Gale, B. L., Straub, K. M., and DeNagel, D. C. (2002) Application of
zwitterionic detergents to the solubilization of integral membrane proteins for two-dimen-
sional gel electrophoresis and mass spectrometry. Proteomics 2, 1479–1488.
25. Lauber, W. M., Carroll, J. A., Dufield, D. R., Kiesel, J. R., Radabaugh, M. R., and Malone,
J. P. (2001) Mass spectrometry compatibility of two-dimensional gel protein stains.
Electrophoresis 22, 906–918.
26. Katial, R. K., Hershey, J., Purohit-Seth, T., et al. (2001) Cell-mediated immune response
to tuberculosis antigens: comparison of skin testing and measurement of in vitro gamma
interferon production in whole-blood culture. Clin. Diagn. Lab. Immunol. 8, 339–345.
27. Mazurek, G. H., LoBue, P. A., Daley, C. L., et al. (2001) Comparison of a whole-blood
interferon gamma assay with tuberculin skin testing for detecting latent Mycobacterium
tuberculosis infection. JAMA 286, 1740–1747.
28. Passwell, J. H., Shor, R., Gazit, E., and Shoham, J. (1986) The effects of Con A-induced
lymphokines from the T-lymphocyte subpopulations on human monocyte leishmanicidal
capacity and H
2
O
2
production. Immunology 59, 245–250.
29. Osborn, M. J. and Munson, R. (1974) Separation of the inner (cytoplasmic) and outer
membranes of Gram-negative bacteria. Methods Enzymol. 31, 642–653.
30. Schnaitman, C. A. (1981) Cell fractionation, in Manual of Methods for General Bacteriol-
ogy, vol. 1 (Gerhardt, P., ed.), ASM Press, Washington, D.C., pp. 52–61.
01/Dobos/1-18/F 09/26/2003, 1:59 PM16
Proteomic Approaches to Antigen Discovery 17
31. Dillow, A. K., Dehghani, F., Hrkach, J. S., Foster, N. R., and Langer, R. (1999) Bacterial
inactivation by using near- and supercritical carbon dioxide. Proc. Natl. Acad. Sci. USA
96, 10,344–10,348.
32. Wuytack, E. Y., Diels, A. M., and Michiels, C. W. (2002) Bacterial inactivation by
high-pressure homogenisation and high hydrostatic pressure. Int. J. Food Microbiol. 77,
205–212.
33. Raso, J., Palop, A., Pagan, R., and Condon, S. (1998) Inactivation of Bacillus subtilis
spores by combining ultrasonic waves under pressure and mild heat treatment. J. Appl.
Microbiol. 85, 849–854.
34. Samanich, K., Belisle, J. T., and Laal, S. (2001) Homogeneity of antibody responses in
tuberculosis patients. Infect. Immun. 69, 4600–4609.
35. Lee, N. A., McGarry, M. P., Larson, K. A., Horton, M. A., Kristensen, A. B., and Lee, J. J.
(1997) Expression of IL-5 in thymocytes/T cells leads to the development of a massive
eosinophilia, extramedullary eosinophilopoiesis, and unique histopathologies. J. Immunol.
158, 1332–1344.
36. Campisi, J. and Fleshner, M. (2003) Role of extracellular HSP72 in acute stress-induced
potentiation of innate immunity in active rats. J. Appl. Physiol. 94, 43–52.
01/Dobos/1-18/F 09/26/2003, 2:00 PM17
18 Dobos et al.
01/Dobos/1-18/F 09/26/2003, 2:00 PM18
Immunoproteomics 19
2
Immunoproteomics
Alexander Krah and Peter R. Jungblut
Abstract
Two-dimensional electrophoresis results in an adequate resolution of the proteome
of microorganisms to allow the detection and identification of specific antigens
after blotting on membranes and overlaying the protein pattern with patient’s sera.
The complement of all identified antigens presents the immunoproteome of a micro-
organism. All the antigens specific for a microorganism or even for a disease are iden-
tified by mass spectrometry. For identification, peptide mass fingerprinting is used,
and post-translational modifications are detected by mass spectrometry MS/MS tech-
niques. High-resolution two-dimensional electrophoresis and unambiguous identifi-
cation are prerequisites for reliable results. After statistical analysis, the resulting
antigens are candidates for diagnosis or vaccination and targets for therapy.
Key Words: Two-dimensional electrophoresis; immunoproteome; diagnostics;
therapy; vaccination; mass spectrometry; peptide mass fingerprinting; proteome database.
1. Introduction
For about 50 yr scientists have tried to elucidate the protein composition of biological
compartments. The first two-dimensional electrophoretic separation resolved 15 pro-
teins from human serum (1). Ribosomes with about 60 protein components were the first
completely resolved organelles (2). For more complex compartments, the resolution
power had to be improved. This goal was reached by the combination of isoelectric
focusing (IEF) and sodium dodecyl sulfate polyacrylamide gel electrophoresis (SDS-
PAGE) for two-dimensional electrophoresis (2-DE) (3,4). With this improvement, sev-
eral hundred proteins were separated within one 2-DE gel. The method was further
optimized for high resolution, and at present more than 10,000 protein species may be
separated within large (30 × 40 cm) gels (5). In 1995 the term proteome was defined:
the proteome refers to the total protein complement of a genome (6).
The identification of antigens within gels was not possible for a long time. There-
fore, blotting of proteins to nitrocellulose membranes was an important milestone for
19
From:
Methods in Molecular Medicine, vol. 94: Molecular Diagnosis of Infectious Diseases, 2/e
Edited by: J. Decker and U. Reischl © Humana Press Inc., Totowa, NJ
02/Krah/19-32/F 09/26/2003, 2:04 PM19
20 Krah and Jungblut
the detection of antigens (7,8). After transfer of proteins from gels to membranes,
antibodies can interact and bind to the antigens for which they are specific. To detect
the antigen–antibody complex, a second antibody is overlaid with specificity against
the class of the first antibody (e.g., IgG). The secondary antibody is coupled with a
detection system. This principle was used early for identification of proteins in 2-DE
gels (9). Overlaying blots of gels from microorganisms with sera from patients infected
with these microorganisms reveals the immunoproteome of the microorganism under
investigation. For many years one-dimensional (1D) gels were used to detect antigens
for diagnostics. Because of the high complexity of the proteome, the assignment of a
1D band to a distinct protein is very difficult, and 2D separation is required for unam-
biguous identification of antigens. Borrelia garinii and Helicobacter pylori are two of
the first immunoproteomes analyzed by 2-DE and mass spectrometry (MS) (10,11).
Direct immunodetection within the gels avoiding blotting has been reported recently
(UnBlot In-Gel Chemiluminescent Detection Kit, Pierce, Rockford, IL). The future
will show whether this procedure can substitute for immunoblotting.
A view of the immunoproteome may also be obtained by enzyme-linked immuno-
sorbent assay (ELISA) tests and immunoprecipitation. ELISA tests do not differenti-
ate between the different proteins, and immunoprecipitation requires larger amounts
of antibodies and suffers from problems with removal of antibodies before identifica-
tion of the antigens. Therefore, at present the 2-DE/MS approach reveals the most
complete view of the immunoproteome.
The major steps of immunoproteomics are as follows:
1. Two-dimensional electrophoresis.
2. Semidry blotting.
3. Immunodetection.
4. Data analysis.
5. Antigen identification.
1.1. Two-Dimensional Electrophoresis
The smallest unit of a proteome is the protein species (12), which is defined by its
chemical structure. Therefore, a myosin phosphorylated at position x and a myosin
phosphorylated at position y are two different protein species of one protein.
A proteome of a microorganism with 3000 genes may comprise 9000 or more pro-
tein species. Even if not all of the genes are represented by proteins in a certain bio-
logical situation, several thousands of protein species may be expected to be present.
Indeed, about 1800 protein species were detected for H. pylori, which contains a
genome of about 1600 genes (13). Therefore, high-resolution 2-DE techniques are a
prerequisite to resolve this complexity. Resolution may be improved by increasing the
gel size or by the production of several gels with different separation ranges. The pI
range of a gel may be modified by the use of different ampholyte or immobiline gradi-
ents. The molecular weight (M
r
) range depends on the porosity of the gel matrix, which
itself may be modified by different acrylamide and crosslinker concentrations.
The strategy of using large gels has the advantage that the complete information is
contained in one gel. High quality of 2-DE gels, as shown in Fig. 1, is a necessary
prerequisite for successful immunoproteomics.
02/Krah/19-32/F 09/26/2003, 2:04 PM20
Immunoproteomics 21
21
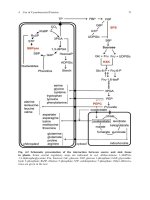
Fig. 1. Comparison of a 2-DE gel and a 2-DE gel immunoblot. (A) Silver-stained large 2-DE gel (23 × 30 cm) of H. pylori lysate containing
about 1800 spots. This gel is the standard gel in the 2D-PAGE database ( />tml).
(B) Large 2-DE immunoblot (23 × 30 cm) of H. pylori lysate probed with a human serum. About 400 spots are recognized. Twelve of the spots are
numbered in A and B. These spots contain the following proteins: 1, elongation factor G; 2, heat shock protein 70; 3, urease β-subunit;
4, elongation factor TU; 5, GroEL; 6, glutamine synthetase; 7, cag26; 8, not yet identified; 9, N-methylhydantoinase; 10, hydan
toin utilization
protein A; 11 and 12, GroES.
02/Krah/19-32/F 09/26/2003, 2:04 PM21
22 Krah and Jungblut
1.2. Semidry Blotting
Towbin et al. (7) blotted the proteins within a tank, where the blot sandwich was
surrounded by large volumes of buffer. Potential impurities from the buffer are avoided
by the use of semidry blotting, which is also easier to perform (14). The critical point
of the blotting mechanism is the time point at which the SDS is stripped off from the
protein (15). If SDS is removed from the protein still in the gel, the protein cannot be
transferred to the membrane. If SDS is not stripped off from the protein at the moment
the SDS–protein complex reaches the membrane, the protein cannot bind to the mem-
brane and moves through the membrane to the anode. High-M
r
proteins tend to lose
SDS early and remain in the gel. Low-M
r
proteins tend to lose SDS too late and do not
bind to the membrane. Improving the SDS–protein binding by addition of SDS to the
cathode buffer improves the blotting efficiency for large proteins. A better blotting
efficiency for low-M
r
proteins is obtained by improving the hydrophobic interaction
between membrane and protein by increasing the ionic strength of the blotting buffer.
1.3. Immunodetection
After blotting, the proteins are immobilized in the membrane. Sera of patients are
overlaid to detect the antigens against which the patients have produced antibodies.
Here one has to be aware of two causes of variability. First, the genetic variability of
the microorganism and second, the variability of the immunological response of the
host. This response depends on the strain of the microorganism the host is infected
with and its own genome and environment. Because individual medicine is only a
vision at the moment, for the development of diagnostics, therapeutics, and vaccines
at present we have to search for proteomic signatures independent of the strain and
individual host. Therefore large series of patient sera with one or several common
strains of the microorganisms have to be searched for antigens; only those antigens
common for a majority of them are potential candidates for diagnosis, therapy, and
vaccination. Attempts were also made to correlate antigen composition with certain
disease manifestations (10,11,16). For each microorganism, its own rules for accep-
tance of immunologically relevant candidates have to be delineated from the immuno-
proteomes obtained.
With the standard procedure, primary antibody/secondary antibody coupled with
peroxidase or alkaline phosphatase, a better sensitivity than with silver staining is
already mostly obtained. When chemiluminescence is applied, a further enhancement
of sensitivity may be reached. For optimal sensitivity, the blocking reagents and wash-
ing procedures play an important role to avoid background staining.
1.4. Data Analysis
After blotting and immunostaining, a pattern of spots arises, which normally is
completely different compared with the silver-stained 2-DE pattern. The assignment
of spots between these two patterns is easy if highly intense characteristically formed
spots are found in both patterns. However, assignment becomes more and more com-
plicated the lower the number of spots in the immunostained pattern and the higher the
number of antigens not stained in the silver-stained pattern. Several strategies are used
02/Krah/19-32/F 09/26/2003, 2:04 PM22
Immunoproteomics 23
for unambiguous assignment. One is replica blotting. Here, during the blotting proce-
dure, the proteins are blotted to both sides of the gel by changing the direction of the
electric field strength during the blotting procedure (17). One blot is immunostained,
and the other is stained by Coomassie Brilliant Blue (CBB) or by more sensitive stains
like Aurodye. Another strategy is to counterstain the membrane with CBB after
immunostaining (18). This is possible because the surface-bound blocking proteins
are removed from the membrane during the washing procedures, and the blotted pro-
teins, which are bound within the membrane, remain in the membrane during washing.
Because of the potentially high variance, each immunostaining experiment has to
be repeated at least three times. The resulting spot patterns are spot detected and
matched by commercial image processing software. Within a virtual master gel, the
spot intensity differences of all the tested sera can be visualized (Fig. 2), and nonspe-
cific reactions may be eliminated by comparison with control sera.
1.5. Antigen Identification
If highly specific antibodies are available, antigens may be identified by them after
stripping of the antibodies from the serum directly from the same membrane used for
the serum tests. Protein chemical identification is more reliable and may also lead to
identification at the protein species level. Here MS is the method of choice. Peptide
mass fingerprinting (19) after tryptic digestion from spots out of preparative gels
stained with CBB G-250, results in secure identification, if the genome of the micro-
organism is already completely sequenced (Fig. 3). Sequence information by MS/MS
techniques gives information about post-translational modifications and also of genes
not described before (20). For identification of an antigen, it is important to show by
MS that the immunostained spot contains only one protein. Because of the high sensi-
tivity of the immunostaining, minor components of a spot may also be detected.
2. Materials
2.1. Two-Dimensional Electrophoresis
The 2-DE procedure is beyond the scope of this chapter; see Subheading 3.1.
2.2. Semidry Blotting
1. Polyvinylidene difluoride (PVDF) blotting membrane (Immobilon-P Transfer Membrane,
Millipore, Bedford, MA).
2. Filter paper (GB003 Gel-Blotting-Papier, Schleicher & Schuell, Dassel, Germany).
3. Blotting buffers: methanol is toxic by inhalation—prepare and use solutions under a hood!
a. For the high-M
r
part of the gel (30–150 kDa):
Cathode buffer: 50 mM boric acid, 10% methanol, 5% SDS; add NaOH to adjust to
pH 9.0.
Anode buffer: 50 mM boric acid, 20% methanol; add NaOH to adjust to pH 9.0.
b. For the low-M
r
part of the gel (4–30 kDa):
Cathode and anode buffers: 100 mM boric acid, 20% methanol; add NaOH to adjust
to pH 9.0.
4. Blotting chambers (Hoefer Large SemiPhor, semidry transfer unit, Amersham Pharmacia
Biotech, San Francisco, CA).
02/Krah/19-32/F 09/26/2003, 2:04 PM23
24 Krah and Jungblut
24
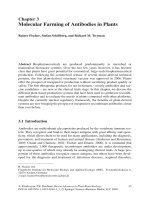
Fig. 2. Result of a data analysis of 2-DE immunoblots using PDQuest software (see Subheading 2.4.). Upper left section of the master blot,
which contains the gaussian fitted spots of all immunoblots in the analysis set. Marked are spots 1–6 from Fig. 1. For each spot the columns in the
small boxes correspond to the intensity in each immunoblot of the analysis set. The numbers in the upper right corners of
the small boxes show the maximum intensity of each spot. SSP numbers are unique spot numbers that are automatically generated b
y the
software.
02/Krah/19-32/F 09/26/2003, 2:04 PM24
Immunoproteomics 25
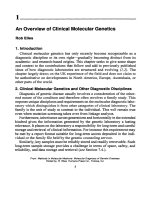
Fig. 3. Search result of a protein identification by a peptide mass fingerprint using the search
machine Mascot (see Subheading 2.5.). The search result of spot 2 (see Fig. 1). The columns
show the number of protein hits with a certain score value. Scores above 73 are considered to
be significant (outside the hatched area). Hits that have no significant score must be considered
random events. In this case, two significant hits are found. The first is the heat shock protein 70
of H. pylori 26695, the strain used in this experiment. The second hit is the corresponding
protein in strain J99. This protein has a highly similar, but not identical, sequence in both
strains. Links are given in the search result to gain more information about the proteins.
2.3. Immunodetection
Prepare stackable boxes a little larger in size than the membranes.
1. PBST buffer: add Tween-20 to phosphate-buffered saline (PBS) at pH 7.6 to obtain a
concentration of 0.05%.
2. Dry milk (Blotting Grade Blocker, Non-Fat Dry Milk, Bio-Rad, Hercules, CA).
3. Primary antibodies or patient sera.
4. Secondary antibody directed against the primary antibody used (e.g., goat anti-human
polyvalent IgG-Peroxidase Conjugate, Sigma; cat. no. A-8400): store at –20°C and avoid
thawing–freezing cycles by freezing in aliquots.
02/Krah/19-32/F 09/26/2003, 2:04 PM25
26 Krah and Jungblut
5. Chemiluminescence reagents (Western Lightning Chemiluminescence Reagent NEL-101,
NEN, Perkin Elmer, Boston, MA): store at 4°C.
6. Film (Biomax MR, Kodak, Rochester, NY).
7. Film cassette (Hypercassette, Amersham Pharmacia Biotech UK, Buckinghamshire, UK).
8. Photo machine in a dark room.
9. CBB R-250 staining solution: 50% methanol, 10% acetic acid, 0.1% CBB R-250 (Bio-
Rad, Hercules, CA). Methanol is toxic by inhalation!
10. CBB destaining solution: 50% methanol, 10% acetic acid.
2.4. Data Analysis
1. Scanner (Umax Mirage IIse, Taiwan).
2. 2-DE analysis software (PDQuest, Version 7.1, Bio-Rad).
2.5. Antigen Identification
Avoid contamination of the buffers by dust and keratin!
1. 2-DE public database for the organism examined (in-house if available or via Internet:
World 2D PAGE: />2. Fixing solution for preparative gels: 50% methanol, 2% phosphoric acid.
3. CBB G-250 staining solution for preparative gels: 34% methanol, 17% (w/v) ammonium
sulfate, 2% phosphoric acid; 0.66 g/L CBB G-250 is added later (Bio-Rad).
4. Spot destaining solution: 200 mM NH
4
HCO
3
, 50% acetonitrile.
5. Digest buffer: 50 mM NH
4
HCO
3
, 5% acetonitrile.
6. Sequencing grade modified trypsin (Promega, Madison, WI) is dissolved to 0.2 µg/µL in
resuspension buffer provided by the manufacturer. Freeze in aliquots for storage.
7. Shrink buffer: 60% acetonitrile, 0.1% trifluoroacetic acid.
8. Sample buffer: 33% acetonitrile, 0.1% trifluoroacetic acid.
9. Matrix solution: 50 mg/mL 2,5-dehydroxybenzoic acid dissolved in 33% acetonitrile,
0.33% trifluoroacetic acid.
10. Matrix-assisted laser desorption/ionization-time of flight (MALDI-TOF) mass spectrom-
eter (Voyager Elite DE, Perseptive Biosystems or others; see Note 19).
11. Search machines for peptide mass fingerprints, e.g., Mascot (),
ProFound (http://129.85.19.192/profound_bin/WebPro Found.exe), or MS-Fit (http://
prospector.ucsf.edu/ucsfhtml4.0/msfit.htm).
3. Methods
3.1. Two-Dimensional Electrophoresis
It would go beyond the scope of this chapter to explain sample preparation and 2-DE
in detail. The procedure we are using (as shown in Fig. 1) is comprehensively
described in refs. 5 and 21. Briefly, for the first dimension, 150 µg of protein sample
was applied to the anodic side of the IEF gel. In the second dimension, after equilibra-
tion in SDS-containing buffer, the IEF gel was placed onto a 23 × 30-cm gel and
proteins were separated according to their M
r
.
It is important to consider that the quality of the immunoblots strongly depends on
the quality of the gels that are used (such as resolution power; see Note 1). Depending
on the scientific goal, one should only use the gel system (size, sample buffer, deter-
gents, pH gradient) that is able to resolve the proteins of interest. Because experiments
02/Krah/19-32/F 09/26/2003, 2:04 PM26