Characterizing the genetic differences between two distinct migrant groups from Indo-European and Dravidian speaking populations in India
Bạn đang xem bản rút gọn của tài liệu. Xem và tải ngay bản đầy đủ của tài liệu tại đây (1.27 MB, 11 trang )
Ali et al. BMC Genetics 2014, 15:86
/>
RESEARCH ARTICLE
Open Access
Characterizing the genetic differences between
two distinct migrant groups from Indo-European
and Dravidian speaking populations in India
Mohammad Ali1, Xuanyao Liu2,3, Esakimuthu Nisha Pillai2, Peng Chen2, Chiea-Chuen Khor4, Rick Twee-Hee Ong2
and Yik-Ying Teo1,2,3,4,5,6*
Abstract
Background: India is home to many ethnically and linguistically diverse populations. It is hypothesized that history
of invasions by people from Persia and Central Asia, who are referred as Aryans in Hindu Holy Scriptures, had a
defining role in shaping the Indian population canvas. A shift in spoken languages from Dravidian languages to
Indo-European languages around 1500 B.C. is central to the Aryan Invasion Theory. Here we investigate the genetic
differences between two sub-populations of India consisting of: (1) The Indo-European language speaking Gujarati
Indians with genome-wide data from the International HapMap Project; and (2) the Dravidian language speaking
Tamil Indians with genome-wide data from the Singapore Genome Variation Project.
Results: We implemented three population genetics measures to identify genomic regions that are significantly
differentiated between the two Indian populations originating from the north and south of India. These measures
singled out genomic regions with: (i) SNPs exhibiting significant variation in allele frequencies in the two Indian
populations; and (ii) differential signals of positive natural selection as quantified by the integrated haplotype score
(iHS) and cross-population extended haplotype homozygosity (XP-EHH). One of the regions that emerged spans the
SLC24A5 gene that has been functionally shown to affect skin pigmentation, with a higher degree of genetic
sharing between Gujarati Indians and Europeans.
Conclusions: Our finding points to a gene-flow from Europe to north India that provides an explanation for the
lighter skin tones present in North Indians in comparison to South Indians.
Keywords: Positive selection, Long haplotype, Population diversity
Background
India is one of the most populous countries and spans a
significant amount of land area in south Asia. As a
country, India is ethnically and linguistically diverse,
and several studies have studied the genetic aspect of
this diversity in Indian populations [1-10]. A strict caste
system has existed in Indian societies for centuries, and
this has limited inter-caste gene flow. The country also
possesses two major ethno-linguistic groups: (i) the
Indo-Aryan language speaking groups that are primarily
* Correspondence:
1
Life Sciences Institute, National University of Singapore, Singapore,
Singapore
2
Saw Swee Hock School of Public Health, National University of Singapore,
Singapore, Singapore
Full list of author information is available at the end of the article
present in north India; and (ii) the Dravidian language
speaking groups that are predominantly in south India.
Historical evidence suggests that prior to 1500BC, Dravidian
languages were present throughout India, but there
was a documented shift in the prevalence of the spoken
languages towards Indo-Aryan languages after 1500BC
[11]. This change in the dominant spoken languages in
India is central to the theory where the Aryans, who
traced their origins from Iran and Central Asia, invaded
India and settled in the sub-continent. Strong archaeological evidence suggests the presence of an ancient
civilization along the banks of the Indus river valley, an
area located in the north-western region of the Indian
subcontinent, and the subsequent disappearance of this
© 2014 Ali et al.; licensee BioMed Central Ltd. This is an Open Access article distributed under the terms of the Creative
Commons Attribution License ( which permits unrestricted use, distribution, and
reproduction in any medium, provided the original work is properly credited. The Creative Commons Public Domain
Dedication waiver ( applies to the data made available in this article,
unless otherwise stated.
Ali et al. BMC Genetics 2014, 15:86
/>
civilization has been postulated by historians and anthropologists to be attributed to the Aryan invasion [3].
The presence of the caste system along with two major
distinct language families has altered the mating pattern
in Indian societies, and this has magnified the diversity
of the gene pools that are present in the Indian subcontinent. One of the most apparent differences between
north Indians and south Indians is in skin complexion,
where north Indians are much fairer compared to the
darker south Indians [12]. In this paper, we investigate
genome-wide single nucleotide polymorphism (SNP) data
from two Indian subpopulations: (i) the Gujaratis from
Houston in Phase 3 of the International HapMap Project
[13]; and (ii) the south Asian Indians from Singapore in
the Singapore Genome Variation Project [14] (Figure 1).
The Gujarati samples trace their roots to the Western
State of Gujarat where the native language of the ethnic
subgroup is classified as Indo-Aryan. The Indian population
in Singapore predominantly descended from immigrants
Page 2 of 11
from Dravidian-speaking states of Kerala, Karnataka
and Tamil Nadu, and thus most Singapore Indians can
be regarded as representatives of the broader category
of Dravidian-speaking south Indians [15].
Reich and colleagues [1] were amongst the first to investigate in detail the complex genetic canvas of India.
They surveyed 132 Indians from 25 ethno-linguistically
and socially distinctive groups across 560,123 SNPs, and
reported the genetic substructures that are present across
the Indian populations. However, the sample size of less
than 10 for each sub-group does not provide sufficient
resolution to confidently investigate genomic variability
such as allele frequency differences and natural selection
among different Indian subpopulations. For our analysis,
we had 83 samples that trace their ancestry from the
aforementioned states in south India, and 85 samples
from individuals with lineage from the state of Gujarat.
Furthermore, for our samples we had data from around
1.4 million (1,389,511) and 1.6 million (1,583,455) SNPs
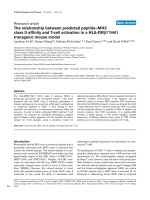
Figure 1 Geography and language distribution of India. In this map of India, all the states have been shaded according to the languages
predominantly spoken in those states. The two broad language families are: (i) Dravidian (darker shade); and (ii) Indo-Aryan (lighter shade). There
is a clear north–south divide, with northern states predominantly speaking Indo-Aryan languages such as Hindi, Marathi, Oriya, Punjabi and Gujarati;
while southern states predominantly speak Dravidian languages such as Tamil, Malayalam, Kannada and Telugu. The two groups of samples used in
this report trace their ancestries to different ethno-linguistic groups found at different geographical locations. The Houston Gujaratis (GIH) trace their
ancestry to the Gujarati-speaking state of Gujarat (red star), while the Singapore Indians (INS) trace their ancestry predominantly to Tamil Nadu, a
Dravidian-language speaking state in the south (grey star).
Ali et al. BMC Genetics 2014, 15:86
/>
from the Indo-European language speakers and Dravidian
language speaker groups respectively. The larger number
of samples coupled with higher SNP densities across the
genome presents the opportunity to interrogate the genome for regions that are substantially different between
the northern Indians and the southern Indians.
Here, we use three population genetics metrics for
quantifying genomic diversity between the north Indians
and south Indians: (i) the Wright’s FST provides a measure
of the variation in allele frequencies between populations
[16]; (ii) the integrated haplotype score (iHS) provides a
measure of the evidence for positive selection [17], which
we subsequently search for genomic regions where there
are significant differences in the iHS evidence in north
Indians and south Indians; and (iii) the cross-population
extended haplotype homozygosity (XP-EHH) score that
investigates differential evidence of long haplotypes between two populations [18]. These metrics have previously
been used successfully to identify genomic regions that
differ between north and south Han Chinese [19], and we
now extend the use of these metrics to explore the genetic
architecture of Indian subpopulations, as well as to investigate whether positive selection is able to explain the
emergence of genetic differences between the two groups.
Results
To evaluate the extent of genetic differences that exists
between a north Indian population that predominantly
speaks the Indo-Aryan language, and a south Indian
Dravidian-language speaking population, we considered
the 85 Gujarati samples residing in Houston, Texas, from
Phase 3 of HapMap (GIH) and the 83 samples from
Singapore that are predominantly Tamil Indians (INS)
from the SGVP (INS). A total of 1,362,474 autosomal
SNPs that are present in both databases and phased
haplotypes from the two public resources were used.
Our interrogation for genetic evidence of north–south
differences focused on three aspects of population genetics: (i) searching for genomic stretches that contained
an excess of SNPs where the allele frequencies are
markedly different between GIH and INS as quantified
by the FST metric; (ii) regions under pressure of positive
selection in only one of the two populations as quantified by the iHS metric; (iii) regions where XP-EHH
exhibited significant evidence of differential selection
between GIH and INS. To minimize the chance of false
positive findings, we require any regions that have been
identified by any one of the three criteria to be validated
in at least one of the remaining two criteria, although
the validation criteria were less stringent (see Table 1).
We investigated the extent of population structure
between the GIH and INS samples with three approaches:
(i) principal components analysis (PCA); (ii) Wright’s
fixation index (FST); and (iii) the program structure that
Page 3 of 11
aims to assign population membership of each individual
to a pre-specified number of populations.
Performing the PCA at a global scale where we compared GIH and INS with the remaining 10 populations in
HapMap Phase 3, the GIH and INS samples were clustered together and were not immediately distinguishable
with the first two principal components (Figure 2A), although a marginal separation between the two Indian
populations was evident with the second and third
principal components (Figure 2B). Comparing the two
populations against the 132 samples from a survey of the
population diversity of India by Reich and colleagues [1],
we observed that GIH samples clustered closer to north
Indian samples while INS samples were appropriately located with most of the south Indian samples (Figure 2C).
An interesting pattern emerged from the PCA of only the
GIH and INS samples (Figure 2D), where there were a
group of 51 GIH samples that were more homogeneous
among themselves and were clearly distinct from the INS
samples; while the remaining 34 GIH samples were considerably more homogeneous to the INS samples.
We quantified the genetic distance between populations
with the average FST calculated across 1,362,474 SNPs that
are present in all the HapMap3 and INS populations. We
observed that the genetic differentiation between the two
Indian populations (average FST = 0.38%) were found to be
larger than the distances between northern and southern
Han Chinese populations in HapMap and SGVP respectively (CHB and CHS, average FST = 0.20% [14]), but was
comparable to that observed between north-Western
Europeans and the Toscans in Italy (CEU and TSI,
average FST = 0.38%), and was less than the distances
between any two African populations (LWK, MKK, YRI,
average FST ≥ 0.62%).
The structure analyses were performed with the two
Indian populations and four populations from another
three ancestry groups (Europeans: CEU, TSI; East Asians:
CHB; Africans: YRI) at three settings where the number of populations K was set to 4, 5 and 6. At K = 4, the
Europeans, East Asian and African samples were assigned
almost homogeneously to unique populations whereas the
Indian samples, while clearly distinguishable from the
other three ancestry groups, showed evidence of admixture with the Europeans (Figure 3A). The analysis at K = 5
further differentiated the two Indian populations, although
it was evident there was a significant degree of admixture between the two Indian populations, and a small
fraction of the Indian genomes mapped to the Europeans
(Figure 3B). The findings about the two Indian populations were similar at K = 6, which essentially differentiated
the north-Western Europeans (CEU) from the Italian
Toscans (TSI) (Figure 3C).
The population structure analyses with PCA, FST
and structure indicated the two Indian populations are
Ali et al. BMC Genetics 2014, 15:86
/>
Page 4 of 11
Table 1 Discovery and validation criterion for differentiated genomic regions
Criteria
Discovery criterion
Validation criterion
FST Region with an over-representation of
SNPs possessing high FST values relative to
the genome-wide distribution of FST scores
Regional evidence in the top 0.1% of the
genome-wide distribution, in which:
Discovered region should contain evidence
found in the top 1% of the genome-wide
distribution
- Regions are defined by window sizes of
100 kb and 500 kb;
- Evidence is defined by the P-value of the
exact Binomial test for the proportion of SNPs
with FST in the top 1st percentile (100 kb) or
0.1st percentile (500 kb) respectively of the
genome-wide distribution score
Differential iHS signals for GIH and INS
At least one SNP with normalized iHS score in
the top 0.19% of the genome-wide distribution
in one population, but not present in the top
1% of the genome-wide distribution in the
other population
At least one SNP in the discovered region
should have an iHS score in the top 1% of
the genome-wide distribution, but absent in
the top 1% of genome-wide distribution of
iHS scores in the second population
XP-EHH between GIH and INS
Normalized XP-EHH scores should lie in the
top 0.01% of the genome-wide distribution
At least one SNP in the discovered region
should lie in the top 0.5% of the genome-wide
distribution of the normalized XP-EHH scores
A description of the population genetics metrics used to discover and validate genomic regions that are differentiated between the north Indian Gujarati
population (GIH) and the south Indian Tamil population from Singapore (INS).
Abbreviations: iHS integrated haplotype score, XP-EHH cross-population extended haplotype homozygosity.
Figure 2 Population structure of the Indians. Principal components analyses of the two Indian populations (HapMap Gujarati: GIH, SGVP Tamil
Indians: INS) with other global populations across 112,925 SNPs. (A) The first two principal components (PCs) of GIH and INS with the remaining
ten populations from Phase 3 of the International HapMap Project. (B) Second and third PCs of the PCA of GIH and INS with the ten HapMap3
populations. (C) First two PCs from the analysis of GIH, INS and the 45 Indo-European speaking samples and 46 Dravidian-language speaking
samples from the paper by Reich and colleagues. (D) First two PCs from the analysis with only GIH and INS samples.
Ali et al. BMC Genetics 2014, 15:86
/>
Page 5 of 11
Figure 3 Population structure analysis with STRUCTURE. Analysis output from one of the five STRUCTURE runs with 10,000 randomly chosen
autosomal SNPs for 85 Gujaratis (GIH), 83 Tamil Indians (INS) and another 399 individuals of north and western European ancestry (CEU), Toscans
in Italy, Han Chinese in Beijing and Yoruba from the Ibadan region of Nigeria. Three separate analyses are performed for each set of 10,000 SNPs,
where the number of subpopulations was set to four (panel A), five (panel B) and six (panel C). The analysis was performed with a burn-in of
10,000 iterations and for 20,000 samplings, where the posterior mean estimates across the 20,000 samplings were used to calculate the admixture
proportion from the K populations for each individual.
genetically distinguishable, and this motivated further
analyses to locate where the genetic differences are in
the human genome. The availability of larger sample
sizes in HapMap and SGVP allows for better inference
of allele frequency differences, as well as for interrogating
the genome for differential signatures of positive natural
selection. We can thus search for genomic regions where
there are substantial differences in the allele frequencies of
the SNPs in these regions, and to investigate whether such
differences are the consequence of different evolutionary
pressure where positive selection is present in one population but not the other. Formally, a region is only identified
if at least two of the following conditions are met: (i) the
region corrected for nominal SNP density contains an
excess of SNPs with significant differences in allele frequencies between GIH and INS; (ii) there are differential
evidence from iHS such that one population exhibits
evidence from iHS of positive selection while the other
population does not; and (iii) there is evidence from
XP-EHH of differential haplotype lengths between GIH
and INS. The details of the discovery and validation criteria with these three metrics can be found in Table 1.
A total of eight regions were identified from our analyses, of which six regions encompassed at least one
gene (see Table 2). One of these six regions is the region
on chromosome 15 between 45.7 Mb and 46.2 Mb,
which encapsulated four genes including the solute carrier family 24 member 5 (SLC24A5) gene that has been
associated with skin pigmentation [20] (Figure 4). This
region was found to exhibit regional differences in allele
frequencies at the top 0.1% of the genome-wide distribution, along with XP-EHH signals found at the extreme
0.1th percentile, where the direction of the XP-EHH
region corresponded with evidence of positive selection in
GIH relative to INS. A genome-wide association study of
skin pigmentation in a South Asian population identified
the guanine allele for the index SNP rs1834640 in
SLC24A5 to be associated with lighter skin pigmentation,
and this allele was present at a frequency of 4.7% in INS
compared to 40.2% in GIH (FST = 18.1%), indicating that
the differential evidence in this region concurs with the
significant difference in the frequency of an allele that has
been linked to skin pigmentation.
Another region that emerged with consistent evidence
from regional FST and XP-EHH was found on chromosome 17 between 41.3 Mb and 41.5 Mb (Additional file 1:
Figure S1) and encompassed three genes, two of which
(STH and KANSL1) have previously been implicated
with variation in intracranial volume [21] and the
microtubule-associated protein tau (MAPT) gene has been
consistently reported to be associated with Parkinson’s
disease in Europeans [22-24]. The evidence from XP-EHH
suggests the presence of positive selection at this locus in
INS and not in GIH.
The remaining four regions encompassed genes that
have not been reported for any phenotypic associations,
but met our criteria where at least two of the three metrics
were found at the extreme end of the respective genomewide distributions. For example, the region on chromosome 4 between 17.0 Mb and 17.5 Mb was identified by
the FST criterion and was further corroborated by evidence
from iHS in the top 1% in GIH but not in INS (Additional
file 1: Figure S2). This is similarly the case for the region
identified on chromosome 8 between 85.0 Mb and 86.0 Mb
Ali et al. BMC Genetics 2014, 15:86
/>
Page 6 of 11
Table 2 Significantly differentiated regions
Discovery mechanism
FST
iHS
Chr
Start (Mb)
End (Mb)
FST (window size)
XP-EHH (directiona)
iHS (INS)
iHS (GIH)
4
17.0
17.5
Top 0.1% (500 kb)
No evidence
No evidence
Top 1%
5
105.4
105.7
Top 0.1% (100 kb)
Top 0.5% (negative)
No evidence
No evidence
-
Genes
QDPR, FAM184B,
CLRN2, DCAF16,
LAP3, MED28
8
85.0
85.6
Top 0.1% (500 kb)
Top 0.5% (negative)
No evidence
No evidence
RALYL
15
45.7
46.2
Top 0.1% (500 kb)
Top 0.5% (negative)
No evidence
No evidence
SLC24A5, MYEF2,
CTXN2, SLC12A1
17
41.3
41.5
Top 0.1% (100 kb)
Top 0.5% (positive)
No evidence
No evidence
MAPT, STH,
KIAA1267
12
23.0
23.3
Top 1% (100 kb)
No evidence
No evidence
Top 0.1%
-
12
58.3
58.6
No evidence
Top 0.5% (negative)
No evidence
Top 0.1%
SLC16A7
12
80.3
80.6
Top 1% (100 kb)
No evidence
Top 0.1%
No evidence
ACSS3, PPFIA2
Regions identified and validated across the genome by different discovery mechanisms using three population genetics metrics calculated from the data for GIH
and INS.
a
Positive direction indicates evidence of positive selection in INS while negative direction indicates evidence of positive selection in GIH.
by FST, and where the region exhibited evidence of positive selection in GIH with XP-EHH (Additional file 1:
Figure S3). Two regions on chromosome 12 at 58.3 Mb58.6 Mb and 80.3 Mb-80.6 Mb exhibited differential evidence of positive selection according to iHS. In the former
region that encompassed SLC16A7, an iHS signal at the
top 0.1% of the distribution was present in GIH but there
was no corresponding signal in INS even at a lower
genome-wide significant threshold of 1% (Additional
file 1: Figure S4). In the latter region which encompassed
Figure 4 Genetic differentiation between GIH and INS on chromosome 15. Evidence of genetic differentiation between GIH and INS on
chromosome 15 between 45.5 Mb and 47.0 Mb from three discovery mechanisms that look for considerable regional differences in SNP allele
frequencies (as quantified by the FST metric) relative to the genome (top panel); differential evidence of positive selection from iHS in GIH and
INS (middle panel); XP-EHH signals contrasting GIH and INS that are found in either tails of the genome-wide distribution (bottom panel). In all
three panels, SNPs exhibiting extreme evidence relative to the genome are displayed in differently in yellow, orange and red according to the
respective percentiles as illustrated in the three figure legends. Genes located within this region are identified according to NCBI hg18 (build
36) coordinates.
Ali et al. BMC Genetics 2014, 15:86
/>
the ACSS3 and PPFIA2 genes, the iHS signals were
present at the top 0.1% in INS but not at the top 1% in
GIH (Additional file 1: Figure S5).
An extension to searching for differential evidence of
positive selection in north and south Indians is to measure the relative degree of haplotype sharing between
north Indians with Europeans, and with south Indians.
We calculated the haplotype similarity score [25], a numerical metric bounded between 0 and 1 where a larger
value indicates a greater degree of haplotype sharing,
between GIH and TSI, and between GIH and INS. The
primary interest here is to search for genomic regions
where the haplotype similarity score is greater than 0.5
between one pair of populations while lower than 0.5 in
the other pair, and this is meant to indicate which population the GIH haplotypes is more similar to. In our analysis
where we divided each chromosome into non-overlapping
windows of 100 kb each, there were 1,455 windows each
of size 100 kb where GIH haplotypes were more similar to
INS haplotypes, as compared to 679 windows where GIH
haplotypes were more similar to TSI haplotypes. This
indicated that there was still a greater degree of sharing
between GIH and INS than with TSI, a finding that concurred with the results of the PCA and STRUCTURE
analyses.
Discussion
In this paper, we attempted a systematic, genome-wide
search for regions showing significant evidence of differentiation between north and south Indians. To this end,
we compared the genome-wide data from the two public
databases of the International HapMap Project and the
Singapore Genome Variation Project. The HapMap project surveyed 88 Gujarati Indians from Houston while
the SGVP included 83 Indians with ancestry primarily
from the south of India. We observed that the genetic
distance between the two Indian groups was comparable
to that between north-western Europeans and southern
Europeans, but was further apart than northern and
southern Han Chinese. The genetic dissimilarity between
north and south Indians were discernible in the PCA
and structure analyses, and eight genomic regions were
identified in our analyses to exhibit significant evidence of
genetic differentiation between the two groups of Indians.
In one of the eight regions lies the SLC24A5 gene that
has been functionally established to affect skin pigmentation in both humans and zebrafish [26]. The functional
variant in this gene has also been proposed as an ancestry
informative marker, as the variant allele is almost fixed in
European populations and correlates with lighter skin pigmentation in admixed populations [27]. A genome-wide
association study of skin pigmentation in south Asian
populations similarly identified markers in this gene to differentiate between fairer and darker skin pigmentation
Page 7 of 11
[12]. Our discovery of this region is thus both exciting and
reassuring, since this provides a well-established positive
control in our analyses into the molecular genetics of the
differences between north and south Indians.
The discovery that the region carrying SLC24A5 is
positively selected in north Gujarati Indians but not in
south Tamil Indians may actually provide the first molecular evidence to support the belief of sexual selection,
where members of most Indian societies have the tendency to prefer partners with fairer skin complexion
[28]. Traditional upper castes from north India tend to
be Indo-Aryan language speakers and are associated
with fairer skin complexion, and there tended to be little
vertical inter-caste marriages [28]. This would agree with
previous reports of north-western Indians and those
from upper castes across India having a greater degree
of genetic similarity to that present in central and west
Asia, as well as parts of Europe [1,3,29,30], despite
these reports having relied on far lesser amount of data
from chromosome Y or mitochondrial DNA. A particular
chromosome Y haplogroup (U7) was previously reported
to be present at higher frequencies in Gujarat and west
Eurasia, but were almost non-existent in other parts of
India [31]. Indeed in a recent report describing a novel
methodology to locate and trace the origins of genomic
signatures of positive selection, the selection signal present
across SLC24A5 in the Gujarati samples in the HapMap
was reported to share the same origins as the selection
signals present in north-western and southern Europeans
[32]. Our analysis of haplotype similarity at the SLC24A5
region between the Gujarati Indians also indicated greater
degree of sharing with the southern Europeans than with
the south Tamil Indians (Figure 5). A recent paper by
Mallick and colleagues similarly reported evidence of
positive selection at this gene with the use of sequence
and genotyping data in separate cohorts from the
North India, Pakistan, Central Asia and Middle East,
although they observed concurring evidence as ours
that selection was conspicuously absent in South India
[33]. With the greater amount of data from a diverse
panel of South Asian and West Eurasian populations,
Mallick and colleagues similarly reported the monophyletic nature of the functional allele prescribing lighter skin
pigmentation to exist on a distinct haplotype form that
is common to both the South Asian and West Eurasian
populations [33].
One striking omission in the differentiated regions is
the Major Histocompatibility Complex (MHC) that has
often been reported to be differentiated even between
closely related populations. In all three metrics, we did not
observe any significant evidence of genomic dissimilarity
between the two populations at this region on chromosome
6. Although the three metrics are not strictly independent,
they survey different features of the genomic architecture,
Ali et al. BMC Genetics 2014, 15:86
/>
Page 8 of 11
Figure 5 Genomic similarity between north Indians to south Indians or south Europeans. Chromosomal representation of the 22
autosomal chromosomes by whether the Gujarati Indian (GIH) haplotypes are more similar to the Italian Toscan (TSI) haplotypes, or whether the GIH
haplotypes are more similar to the Singapore Tamil Indian (INS) haplotypes. Regions in grey indicate the assayed portions of each chromosome; a region
is coloured in blue when the haplotype similarity between GIH and TSI is above 0.5 while the haplotype similarity between GIH and INS is less than 0.5;
and a regions is coloured in red when the haplotype similarity between GIH and INS is greater than 0.5 while the haplotype similarity between GIH and
TSI is less than 0.5. To obtain the haplotype similarity score for each non-overlapping window of 100 kb, the set of unique haplotypes window that are
present with frequencies of at least 2% in each population is first collated. Then the haplotype similarity score is defined as the proportion of
the haplotypes from the two populations that have been represented by these haplotypes. The metric is bounded between 0 and 1, with larger
values indicating greater degree of haplotype sharing between the two populations. The black triangles indicate the positions of the eight
regions identified by our three population genetics metrics.
from measuring differences at the allelic level (FST) to
comparing haplotype structures and the decay of haplotypes (XP-EHH and iHS). A priori, we expected the MHC
to emerge as one of the differentiated regions, but there
were no evidence even at the SNP-level to indicate that
the allelic spectrum was significantly different between the
two populations. This differed from the observations
made in the Han Chinese, where segments of the MHC
emerged as one of the differentiated regions between
north and south Chinese [25].
A prominent feature of the PCA analysis was the grouping of 34 Gujarati Indians with the Singapore Tamil Indians.
Our subsequent analyses did not exclude or partition these
34 GIH samples from the remaining 51 samples as we have
sought to explore the genetic differences between two
different ethno-linguistic groups that traced their ancestries from two different geographical regions of India.
The Gujarati samples in our analyses have been defined
by HapMap to be individuals of Gujarati descent, and
we believed it will not be appropriate to redefine the ancestry or population labels of these samples, particularly
since the PCA alone does not provide adequate evidence
to ascertain that these 34 samples do not have a Gujarati
ancestry. Instead, we believe this is exactly the form of
genetic evidence to support and strengthen the belief that
India is an ethnically and linguistically diverse country,
where social customs have traditionally been governed by
strict caste and religious systems, and where broad definitions of population groupings in India are likely to mask
the complex sociological and genetic structures that are
present in Indian societies. We thus advocate the collection of more detailed information with respect to caste
and religion in future population genetics survey in India.
Conclusion
To the best of our knowledge, this is the first report on
population differences between Indians from two geographical regions in north and south India which additionally investigated whether differential positive selection in
the two populations can explain the origins of the differences. This required population-level genome-wide SNP
data to be available, as compared to previous reports of
historical migration that relied primarily on chromosome
Y and mitochondrial DNA data. Our discovery that the
region around the SLC24A5 skin pigmentation gene
was positively selected in north Indians but not in
south Indians may provide molecular evidence of sexual
selection in the Indian society with its historical preference for fairer skin complexion. We envisage that further
illuminating insights may be obtained with additional
genome-wide SNP data across similar number of samples
from other Indian populations or caste groups.
Methods
Datasets
Our analyses utilized the genome-wide genotype data
from two sources. Phase 3 of the International HapMap
Project surveyed 88 Gujarati Indians residing in Huston
Ali et al. BMC Genetics 2014, 15:86
/>
Texas (abbreviated GIH) across 1,389,511 autosomal SNPs
[13], where three samples were subsequently excluded
due to relatedness yielding a final sample size of 85
Gujarati Indians for analysis (release 3 of HapMap 3).
The Singapore Genome Variation Project surveyed 83
unrelated Singapore Indians (abbreviated INS), where
ethnic membership were ascertained by confirming that
all four grandparents of each INS sample belonged to the
Indian ethnic group. While it was not possible to ascertain
precisely the origins of these 83 Singapore Indians, the
south Asian Indian population in Singapore predominantly consists of descendants from immigrants from
Dravidian-speaking states of Kerala, Karnataka and Tamil
Nadu in south India [15]. The INS data consists of
1,583,455 autosomal SNPs.
Quantifying allele frequency differences with FST
To identify SNPs where the frequencies of the alleles differ
significantly between GIH and INS, we calculated Wright’s
FST [16] for each of the 1,362,474 autosomal SNPs that
are present in both the GIH and INS resources. We used
the formula for two populations, given as
2
F ST ẳ
P1 P2 ị
P1 ỵ P 2 Þð2−P 1 −P 2 Þ
where p1 and p2 denote the allele frequencies of a
specific allele at a SNP in GIH and INS respectively. In
addition, we calculated the empirical p-value for each
FST value by counting the proportion of SNPs out of
1,362,474 SNPs that displayed FST values that are at
least as large as that observed. This empirical p-value
is meant to indicate whether the observed FST value is
significantly different from bulk of the SNPs in the rest
of the genome. As we chose to discount individual
SNPs that possess large FST values due to the possibility
that such one-off differences are artefacts attributed to
genotyping errors, we adopted a region-based approach
and searched for contiguous stretches of the genome that
carried an excess of SNPs with extreme FST values. Each
chromosome was divided into non-overlapping segments
of 100 kb, and a binomial test was performed for each segment to calculate whether the number of SNPs that were
present with empirical p-values < 0.01 were higher than
expected by chance. For assessing the robustness of the
findings, a similar analysis was performed with a window
size of 500 kb at an empirical p-value threshold of 0.001.
The regions across all 22 autosomal chromosomes were
subsequently pooled together and ranked, and regions
found in the top 0.1% of the respective genome-wide distributions for the 100 kb and 500 kb analyses were considered to be significantly different between GIH and INS.
Page 9 of 11
Principal components analysis
We used the pca option that is available as part of the
eigenstrat software [34] to perform principal components
analyses (PCA). Three different PCAs were carried out: (i)
with 1068 samples from INS and the 11 HapMap 3 populations across 1,362,474SNPs; (ii) with 85 GIH, 83 INS
and 132 Indian samples from a population genetics survey
of the Indian subcontinent by Reich and colleagues [1]
across a total of 451,699 SNPs; and (iii) with only the 85
GIH and 83 INS samples across 1,362,474 SNPs. To avoid
confounding the comparison due to the different number
of SNPs and to reduce the impact of correlated SNPs,
we thinned the set of 451,699 SNPs (from the second
comparison) to 112,925 SNPs by selecting the first SNP
out of every four consecutive SNPs as the placement of
SNPs in the microarrays were predominantly chosen on
their ability to tag surrounding SNPs. This set of SNPs
is subsequently used in the three PCAs. The proportion
of the variance explained by each principal component is
calculated by the ratio of the corresponding eigenvalue to
the sum of all eigenvalues.
STRUCTURE analyses
We used the STRUCTURE program (version 2.3.4) to
determine the level of admixture present in the GIH and
INS samples. We used the following four populations
from HapMap 3 as a baseline for calibration: (i) 112 Utah
residents with northern and western European ancestry
(CEU); (ii) 89 Toscans in Italy (TSI); (iii) 85 Han Chinese
in Beijing, China (CHB); and (iv) 113 Yoruba from the
Ibadan region of Nigeria (YRI). The analysis was performed with five different sets of 10,000 randomly selected SNPs across the genome. The admixture model
was selected as the ancestral model that assumed the
genome of each individual is a mosaic of the content
from K populations, where the K parameter was set to 4, 5
and 6. No prior population information was provided in
the analysis, and we run the analysis with a burn-in of
10,000 iterations and for 20,000 samplings, where the posterior mean estimates across the 20,000 samplings were
used to calculate the admixture proportion from the K
populations for each individual.
Positive selection with iHS and XP-EHH
The iHS [17] and XP-EHH [18] metrics were used to locate differential genomic signatures of positive selection in
GIH and INS. We used the C++ programs available at
for iHS and XP-EHH
to perform the analyses [35] on the phased haplotypes that
are publicly available from the HapMap and SGVP resources. The population-averaged recombination rates
from Phase 2 of HapMap were used in the calculations.
All iHS and XP-EHH analyses are performed on the set
of 1,362,474 autosomal SNPs that are present in both
Ali et al. BMC Genetics 2014, 15:86
/>
GIH and INS to avoid any artifacts that may be caused
by the difference in SNP densities between the two databases. For iHS, the raw statistics were normalized
within each of the 20 derived allele frequency bins that
spanned 5%. We identify genomic regions where the
normalized iHS scores were present in the top 0.1% of
the genome-wide distribution in one population but
was not present in the top 1% of the genome-wide distribution in the other population. In order for a region
to qualify as a differential selection signal, at least one
SNP should be present in the top 0.1% of genome-wide
distribution in one population, while there are no SNPs
that are at the top 1% of the genome-wide distribution
of the other population in that region. For XP-EHH,
the analysis was performed with GIH and INS and the
raw scores were normalized to have a zero mean and
unit variance. We searched for clusters of SNPs with
large absolute values for the normalized XP-EHH scores,
which will indicate that a selection event is likely to have
happened in one population but not in the other. The direction of each signal indicated whether the selection event
happened in GIH (negative) or INS (positive). Regions
with signals in the top 0.01% of either extreme of the
genome-wide distribution of the XP-EHH scores were
considered to exhibit differential evidence of positive
selection.
Calculating haplotype similarity
To evaluate the extent of similarity between GIH haplotypes and those from southern Europe (TSI) and
south India (INS), we divided each chromosome into
non-overlapping windows of 100 kb and calculate a
haplotype similarity score between GIH and TSI, and
between GIH and INS [25]. In each 100 kb window for a
population pair, we identified the set of unique haplotypes
that are present with frequencies of at least 2% in each
population. The haplotype similarity score is defined as the
proportion of the haplotypes across the two populations
that have been represented by these unique haplotypes, and
this is a metric bounded between 0 and 1 where larger
values indicate there are greater haplotype sharing between
the two populations.
Additional file
Additional file 1: Figures for rest of the significantly differentiated
regions between INS and GIH.
Competing interests
The authors declare that they have no competing interests.
Authors’ contributions
YYT conceived, designed and directed the experiment; MA, XL. ENP and PC
analzyed the data; YYT, CCK and RTHO wrote the paper. All authors read and
approved the final manuscript.
Page 10 of 11
Acknowledgements
This project acknowledges the support of the Yong Loo Lin School of
Medicine from the National University of Singapore, National Medical
Research Council Singapore and the Biomedical Research Council Singapore.
The study used data generated by the International HapMap Consortium
and the Singapore Genome Variation Project. The study also acknowledges
David Reich and his colleagues for making their genetic dataset on 132
Indians available for us to perform the principal components analysis. Y.Y.T.,
P.C. and R.T.H.O. acknowledge support from the National Research
Foundation, NRF-RF-2010-05, Singapore.
Author details
1
Life Sciences Institute, National University of Singapore, Singapore,
Singapore. 2Saw Swee Hock School of Public Health, National University of
Singapore, Singapore, Singapore. 3NUS Graduate School for Integrative
Science and Engineering, National University of Singapore, Singapore,
Singapore. 4Genome Institute of Singapore, Agency for Science, Technology
and Research, Singapore, Singapore. 5Department of Statistics and Applied
Probability, National University of Singapore, Singapore, Singapore.
6
Department of Statistics and Applied Probability, Faculty of Science,
National University of Singapore, Blk S16, Level 7, 6 Science Drive 2,
Singapore 117546, Singapore.
Received: 15 November 2013 Accepted: 11 July 2014
Published: 22 July 2014
References
1. Reich D, Thangaraj K, Patterson N, Price AL, Singh L: Reconstructing Indian
population history. Nature 2009, 461(7263):489–494.
2. Indian Genome Variation Consortium: Genetic landscape of the people of
India: a canvas for disease gene exploration. J Genet 2008, 87(1):3–20.
3. Bamshad M, Kivisild T, Watkins WS, Dixon ME, Ricker CE, Rao BB, Naidu JM,
Prasad BV, Reddy PG, Rasanayagam A, Papiha SS, Villems R, Redd AJ, Hammer
MF, Nguyen SV, Carroll ML, Batzer MA, Jorde LB: Genetic evidence on the
origins of Indian caste populations. Genome Res 2001, 11(6):994–1004.
4. Xing J, Watkins WS, Hu Y, Huff CD, Sabo A, Muzny DM, Bamshad MJ, Gibbs
RA, Jorde LB, Yu F: Genetic diversity in India and the inference of
Eurasian population expansion. Genome Biol 2010, 11(11):R113.
5. Mitchell RJ, Reddy BM, Campo D, Infantino T, Kaps M, Crawford MH:
Genetic diversity within a caste population of India as measured by
Y-chromosome haplogroups and haplotypes: subcastes of the Golla of
Andhra Pradesh. Am J Phys Anthropol 2006, 130(3):385–393.
6. Krithika S, Trivedi R, Kashyap VK, Vasulu TS: Genetic diversity at 15
microsatellite loci among the Adi Pasi population of Adi tribal cluster in
Arunachal Pradesh, India. Leg Med (Tokyo) 2005, 7(5):306–310.
7. Majumder PP: The human genetic history of South Asia. Curr Biol 2010,
20(4):R184–R187.
8. Palanichamy MG, Sun C, Agrawal S, Bandelt HJ, Kong QP, Khan F, Wang CY,
Chaudhuri TK, Palla V, Zhang YP: Phylogeny of mitochondrial DNA
macrohaplogroup N in India, based on complete sequencing:
implications for the peopling of South Asia. Am J Hum Genet 2004,
75(6):966–978.
9. Kumar S, Padmanabham PB, Ravuri RR, Uttaravalli K, Koneru P, Mukherjee
PA, Das B, Kotal M, Xaviour D, Saheb SY, Rao VR: The earliest settlers'
antiquity and evolutionary history of Indian populations: evidence from
M2 mtDNA lineage. BMC Evol Biol 2008, 8:230.
10. Watkins WS, Thara R, Mowry BJ, Zhang Y, Witherspoon DJ, Tolpinrud W,
Bamshad MJ, Tirupati S, Padmavati R, Smith H, Nancarrow D, Filippich C, Jorde
LB: Genetic variation in South Indian castes: evidence from Y-chromosome,
mitochondrial, and autosomal polymorphisms. BMC Genet 2008, 9:86.
11. Emeneau MB: India as a Lingustic Area. Language 1956, 32(1):3–16.
12. Stokowski RP, Pant PV, Dadd T, Fereday A, Hinds DA, Jarman C, Filsell W,
Ginger RS, Green MR, van der Ouderaa FJ, Cox DR: A genomewide
association study of skin pigmentation in a South Asian population. Am
J Hum Genet 2007, 81(6):1119–1132.
13. Altshuler DM, Gibbs RA, Peltonen L, Dermitzakis E, Schaffner SF, Yu F,
Bonnen PE, de Bakker PI, Deloukas P, Gabriel SB, Gwilliam R, Hunt S, Inouye
M, Jia X, Palotie A, Parkin M, Whittaker P, Yu F, Chang K, Hawes A, Lewis LR,
Ren Y, Wheeler D, Gibbs RA, Muzny DM, Barnes C, Darvishi K, Hurles M, Korn
JM, Kristiansson K: Integrating common and rare genetic variation in
diverse human populations. Nature 2010, 467(7311):52–58.
Ali et al. BMC Genetics 2014, 15:86
/>
14. Teo YY, Sim X, Ong RT, Tan AK, Chen J, Tantoso E, Small KS, Ku CS, Lee EJ,
Seielstad M, Chia KS: Singapore Genome Variation Project: a haplotype
map of three Southeast Asian populations. Genome Res 2009,
19(11):2154–2162.
15. Saw SH: The population of Singapore. 2nd edition. Singapore: Institute of
South East Asian Studies; 2007.
16. Wright S: The genetical structure of populations. Ann Eugen 1949,
15(1):323–354.
17. Voight BF, Kudaravalli S, Wen X, Pritchard JK: A map of recent positive
selection in the human genome. PLoS Biol 2006, 4(3):e72.
18. Sabeti PC, Varilly P, Fry B, Lohmueller J, Hostetter E, Cotsapas C, Xie X, Byrne
EH, McCarroll SA, Gaudet R, Schaffner SF, Lander ES, International HapMap
C, Frazer KA, Ballinger DG, Cox DR, Hinds DA, Stuve LL, Gibbs RA, Belmont
JW, Boudreau A, Hardenbol P, Leal SM, Pasternak S, Wheeler DA, Willis TD,
Yu F, Yang H, Zeng C, Gao Y: Genome-wide detection and
characterization of positive selection in human populations. Nature 2007,
449(7164):913–918.
19. Suo C, Xu H, Khor CC, Ong RT, Sim X, Chen J, Tay WT, Sim KS, Zeng YX,
Zhang X, Liu J, Tai ES, Wong TY, Chia KS, Teo YY: Natural positive selection
and north–south genetic diversity in East Asia. Eur J Hum Genet 2012,
20(1):102–110.
20. Mukherjee M, Mukerjee S, Sarkar-Roy N, Ghosh T, Kalpana D, Sharma AK:
Polymorphisms of four pigmentation genes (SLC45A2, SLC24A5, MC1R
and TYRP1) among eleven endogamous populations of India. J Genet
2013, 92(1):135–139.
21. Ikram MA, Fornage M, Smith AV, Seshadri S, Schmidt R, Debette S, Vrooman
HA, Sigurdsson S, Ropele S, Taal HR, Mook-Kanamori DO, Coker LH, Longstreth
WT Jr, Niessen WJ, DeStefano AL, Beiser A, Zijdenbos AP, Struchalin M, Jack CR
Jr, Rivadeneira F, Uitterlinden AG, Knopman DS, Hartikainen AL, Pennell CE,
Thiering E, Steegers EA, Hakonarson H, Heinrich J, Palmer LJ, Jarvelin MR:
Common variants at 6q22 and 17q21 are associated with intracranial
volume. Nat Genet 2012, 44(5):539–544.
22. Do CB, Tung JY, Dorfman E, Kiefer AK, Drabant EM, Francke U, Mountain JL,
Goldman SM, Tanner CM, Langston JW, Wojcicki A, Eriksson N: Web-based
genome-wide association study identifies two novel loci and a substantial
genetic component for Parkinson's disease. PLoS Genet 2011, 7(6):e1002141.
23. Spencer AH, Rickards H, Fasano A, Cavanna AE: The prevalence and clinical
characteristics of punding in Parkinson's disease. Mov Disord 2011,
26(4):578–586.
24. Simon-Sanchez J, Scholz S, Matarin Mdel M, Fung HC, Hernandez D, Gibbs
JR, Britton A, Hardy J, Singleton A: Genomewide SNP assay reveals
mutations underlying Parkinson disease. Hum Mutat 2008, 29(2):315–322.
25. Twee-Hee Ong R, Wang X, Liu X, Teo YY: Efficiency of trans-ethnic
genome-wide meta-analysis and fine-mapping. Eur J Hum Genet 2012,
20(12):1300–1307.
26. Lamason RL, Mohideen MA, Mest JR, Wong AC, Norton HL, Aros MC,
Jurynec MJ, Mao X, Humphreville VR, Humbert JE, Sinha S, Moore JL,
Jagadeeswaran P, Zhao W, Ning G, Makalowska I, McKeigue PM, O'donnell
D, Kittles R, Parra EJ, Mangini NJ, Grunwald DJ, Shriver MD, Canfield VA,
Cheng KC: SLC24A5, a putative cation exchanger, affects pigmentation in
zebrafish and humans. Science 2005, 310(5755):1782–1786.
27. Giardina E, Pietrangeli I, Martinez-Labarga C, Martone C, de Angelis F, Spinella A,
De Stefano G, Rickards O, Novelli G: Haplotypes in SLC24A5 Gene as Ancestry
Informative Markers in Different Populations. Curr Genom 2008, 9(2):110–114.
28. Béteille A: Race and Descent as Social Categories in India. Daedalus 1967,
96(2):444–463.
29. Thanseem I, Thangaraj K, Chaubey G, Singh VK, Bhaskar LV, Reddy BM,
Reddy AG, Singh L: Genetic affinities among the lower castes and tribal
groups of India: inference from Y chromosome and mitochondrial DNA.
BMC Genet 2006, 7:42.
30. Mountain JL, Hebert JM, Bhattacharyya S, Underhill PA, Ottolenghi C, Gadgil
M, Cavalli-Sforza LL: Demographic history of India and mtDNA-sequence
diversity. Am J Hum Genet 1995, 56(4):979–992.
31. Metspalu M, Kivisild T, Metspalu E, Parik J, Hudjashov G, Kaldma K, Serk P,
Karmin M, Behar DM, Gilbert MT, Endicott P, Mastana S, Papiha SS, Skorecki
K, Torroni A, Villems R: Most of the extant mtDNA boundaries in south
and southwest Asia were likely shaped during the initial settlement of
Eurasia by anatomically modern humans. BMC Genet 2004, 5:26.
32. Liu X, Ong RT, Pillai EN, Elzein AM, Small KS, Clark TG, Kwiatkowski DP, Teo
YY: Detecting and Characterizing Genomic Signatures of Positive
Selection in Global Populations. Am J Hum Genet 2013, 92(6):866–881.
Page 11 of 11
33. Basu Mallick C, Iliescu FM, Mols M, Hill S, Tamang R, Chaubey G, Goto R, Ho
SY, Gallego Romero I, Crivellaro F, Hudjashov G, Rai N, Metspalu M, Mascie-Taylor
CG, Pitchappan R, Singh L, Mirazon-Lahr M, Thangaraj K, Villems R, Kivisild T: The
light skin allele of SLC24A5 in South Asians and Europeans shares identity by
descent. PLoS Genet 2013, 9(11):e1003912.
34. Price AL, Patterson NJ, Plenge RM, Weinblatt ME, Shadick NA, Reich D:
Principal components analysis corrects for stratification in genome-wide
association studies. Nat Genet 2006, 38(8):904–909.
35. Pickrell JK, Coop G, Novembre J, Kudaravalli S, Li JZ, Absher D, Srinivasan BS,
Barsh GS, Myers RM, Feldman MW, Pritchard JK: Signals of recent positive
selection in a worldwide sample of human populations. Genome Res
2009, 19(5):826–837.
doi:10.1186/1471-2156-15-86
Cite this article as: Ali et al.: Characterizing the genetic differences
between two distinct migrant groups from Indo-European and
Dravidian speaking populations in India. BMC Genetics 2014 15:86.
Submit your next manuscript to BioMed Central
and take full advantage of:
• Convenient online submission
• Thorough peer review
• No space constraints or color figure charges
• Immediate publication on acceptance
• Inclusion in PubMed, CAS, Scopus and Google Scholar
• Research which is freely available for redistribution
Submit your manuscript at
www.biomedcentral.com/submit