Genome-enabled predictions for binomial traits in sugar beet populations
Bạn đang xem bản rút gọn của tài liệu. Xem và tải ngay bản đầy đủ của tài liệu tại đây (1.03 MB, 9 trang )
Biscarini et al. BMC Genetics 2014, 15:87
/>
RESEARCH ARTICLE
Open Access
Genome-enabled predictions for binomial
traits in sugar beet populations
Filippo Biscarini1 * , Piergiorgio Stevanato2 , Chiara Broccanello2 , Alessandra Stella1,3 and Massimo Saccomani2
Abstract
Background: Genomic information can be used to predict not only continuous but also categorical (e.g. binomial)
traits. Several traits of interest in human medicine and agriculture present a discrete distribution of phenotypes (e.g.
disease status). Root vigor in sugar beet (B. vulgaris) is an example of binomial trait of agronomic importance. In this
paper, a panel of 192 SNPs (single nucleotide polymorphisms) was used to genotype 124 sugar beet individual plants
from 18 lines, and to classify them as showing “high” or “low” root vigor.
Results: A threshold model was used to fit the relationship between binomial root vigor and SNP genotypes, through
the matrix of genomic relationships between individuals in a genomic BLUP (G-BLUP) approach. From a 5-fold
cross-validation scheme, 500 testing subsets were generated. The estimated average cross-validation error rate was
0.000731 (0.073%). Only 9 out of 12326 test observations (500 replicates for an average test set size of 24.65) were
misclassified.
Conclusions: The estimated prediction accuracy was quite high. Such accurate predictions may be related to the
high estimated heritability for root vigor (0.783) and to the few genes with large effect underlying the trait. Despite
the sparse SNP panel, there was sufficient within-scaffold LD where SNPs with large effect on root vigor were located
to allow for genome-enabled predictions to work.
Keywords: Genomic predictions, Binomial traits, Root vigor, Sugar beet
Background
Most of current research and applications in genetics are
driven by the large quantity of data on individual genomic
polymorphisms produced by modern high-throughput
genotyping and sequencing technologies [1]. A thriving
area is that of genomic predictions in animal and plant
science and human medicine.
Genomic data are used to predict future or unobserved
events (e.g. disease risk [2]), or the unknown genetic
component of given phenotypes (e.g. GEBVs -genomic
breeding values- in livestock, crops and trees [3-5]). Such
predictions are based on the entire available genomic
information, irrespective of the position along the genome
or point effects on the response. This ingenious and highly
effective “black box” approach was conceived and first
*Correspondence:
1 Department of Bioinformatics, PTP, Via Einstein - Loc. Cascina Codazza,
Lodi, Italy
Full list of author information is available at the end of the article
described by Meuwissen et al. around the turn of the millennium [6] and has since then found several applications
and started fruitful areas of research.
Genomic information can in principle be used to predict continuous or categorical (ordered or unordered)
polygenic traits. Most works so far focussed on continuous traits, while fewer studies dealt with genomic
predictions for categorical traits [7-11]. However, several traits of interest in human medicine and agriculture present a discrete distribution of phenotypes (e.g.
litter size in mammals), often binomial (e.g. disease
status). Statistical methods used for genomic predictions of continuous traits cannot be adequately applied
for such traits: the relationship between predictors and
binomial phenotypes is logistic rather than linear; the
phenotypes follow a binomial rather than normal distribution; the variance is no longer constant but a function of the expectation [12]. Root vigor in sugar beet
(B. vulgaris) is an example of binomial trait of agronomic
importance.
© 2014 Biscarini et al.; licensee BioMed Central Ltd. This is an Open Access article distributed under the terms of the Creative
Commons Attribution License ( which permits unrestricted use, distribution, and
reproduction in any medium, provided the original work is properly credited. The Creative Commons Public Domain Dedication
waiver ( applies to the data made available in this article, unless otherwise
stated.
Biscarini et al. BMC Genetics 2014, 15:87
/>
In this paper, SNP (single nucleotide polymorphisms)
genotypes were used for the classification problem of predicting “high” or “low” root vigor inidividual plants in
sugar beet.
Pioneering works on genomic predictions for continuous traits in sugar beet already exist [13,14]. However, this
is the first study to propose direct modeling of genomic
predictions for binomial traits in sugar beet and, to our
knowledge, among the few to address this problem in
plants in general.
Page 2 of 9
Table 1 Description of the experimental population and
SNP marker genotypes
124
N. plant samples
(duplicated)
1
18
N. sugar beet lines
High-root-vigor lines
15
Samples
100
Low-root-vigor lines
3
Samples
24
192
N. SNPs
Methods
Average call-rate
Per SNP
0.969
Per sample
0.984
N. of SNP call-rate ≤ 85%
1
Experimental population
A population of 124 individual sugar beet (B. vulgaris)
plants from 18 high- and low-root-vigor lines were available. These lines were characterised by different productivity and were provided by Lion Seeds Ltd. (UK). Root
vigor is related to nutrient uptake from the soil and plant
productivity [15], and is recorded as a binary trait (either
high or low). The lines were phenotyped by measuring the root elongation rate of eleven-days-old seedlings
grown under hydroponic conditions. There was no predetermined root elongation rate threshold to classify a
sugar beet as having high or low root vigour, and the
decision was subjectively made upon phenotypic inspection. The classification has nevertheless been shown to be
robust: seedlings classified as “low” or “high” maintain the
same class also at the adult plant stage [15]. There were
three low-root-vigor (24 individuals) and 15 high-rootvigor (100 individuals) lines. Root elongation rate was < 3
mm/day in the low-root-vigor lines and > 6 mm/day in
the high-root-vigor lines.
Marker genotypes and imputation
All individual plants were genotyped for 192 SNP markers with the high-throughput marker array QuantStudio
12K Flex system coupled with Taqman OpenArray technology. Additional details on the genotyping procedure
are described in Stevanato et al., 2013 [16].
The initial genotype screening led to the detection
of one duplicated individual (100% matching genotypes)
from a high-root-vigor line, which was removed. The average per-sample and per-marker call-rate was 0.984 and
0.969. Only one SNP had a per-marker call-rate ≤ 85%
and was removed from the analysis. There were in total
738 missing genotypes (3.14%). Missing genotypes were
imputed based on linkage disequilibrium (LD, [17]). After
imputation data were edited for minor allele frequency
(MAF): 16 SNPs with MAF ≤ 2.5% were discarded. This
left a total of 123 individuals and 175 SNP markers for
the analysis. An overview of the data used in the paper
is given in Table 1. Table 2 reports the distribution of
the 175 SNPs (and related scaffolds) used in the analysis
0.262
Average MAF
N. SNPs MAF ≤ 2.5%
16
N. SNPs MAF ≥ 2.5%
175
along the 9 chromosomes of the Beta vulgaris genome.
The average scaffold size was 1037 kbps (range: 34.5 - 4957
kbps).
Genomic relationships
Marker genotypes can be used for genome-enabled predictions either by directly estimating and summing their
effects over all loci (Ridge Regression BLUP - RR-BLUP)
or, indirectly, through the estimation of realized relationships between individuals (genomic BLUP - G-BLUP).
These are two different parametrizations of the genomic
selection model described in Meuwissen et al. [6]. The two
approaches have been shown to be equivalent [18,19].
Table 2 Per-chromosome distribution of scaffolds and
SNPs along the Beta vulgaris genome (“-” indicates
scaffolds and SNPs not yet assigned to chromosomes)
Chromosome
# scaffolds
# SNPs
1
6
8
2
7
11
3
10
18
4
18
33
5
9
16
6
9
16
7
14
21
8
7
10
9
10
22
−
9
20
Total
99
175
Biscarini et al. BMC Genetics 2014, 15:87
/>
Page 3 of 9
In this paper SNP genotypes were incorporated in the
prediction model through the matrix of genomic relationships between individuals. From imputed genotypes
the genomic relationships between individual plants were
computed according to Van Raden (2008 [19]) as:
G=
2
ZZ
pi (1 − pi )
(1)
where G is the matrix of genomic relationships, Z is
the matrix of centered SNP genotypes per individual
(-1, 0 or 1 for the homozygous, heterozygous and other
homozygous respectively), and pi is the allele frequency at
SNP i. Genomic relationships were used to model covariances between observations and to evaluate the genetic
structure of the population.
In a GBLUP (Genomic Best Linear Unbiased Predictions)
framework [6], the probability Pr(Y = [0/1] |X) of having either high or low root vigor given the predictors was
modeled assuming a continuous underlying latent variable
l (“liability”). A threshold model [12] of the following form
was fitted:
l = 1μ + Xg + e
(2)
with l the vector of continuous gaussian liabilities, g the
vector of additive genetic values of individual plants, and
e the vector of logistically distributed residuals; X is a
design matrix that allocates records to genetic values. The
genetic and residual variances were Var(g) = Gσa2 and
2 2
Var(e) = I s 3π (variance of the logistic distribution, with
scale parameter s = 1; I is the identity matrix). The narrow sense heritability for root vigor was then estimated as:
σa2
ER(n) =
1
n
σa2
(3)
2
σa2 + 3.29
σa2 + π3
Low and high root vigor (coded as 0 and 1 respectively)
phenotypes were the input of model 2, which returned a
probability (for individuals with known or unknown phenotype) of belonging to either class. The probability of
classifying each observation i into high- or low-root-vigor
plant was obtained from the cumulative distribution function of the logistic distribution (i.e. the logistic function:
eμ+gi
pi = logistic(li ) = 1+e
μ+gi ). Individuals were classified as
high-/low-root vigour if pi > / ≤ 0.5.
=
Cross-validation
In order to obtain a valid estimate of the classification
error from model (2), a 5-fold cross validation procedure
was adopted [20]. The 123 samples were randomly split
into 5 subsets of approximately the same size. In turn, the
observations in one subset were set to missing and predicted using the model trained with the remaining four
subsets, until all subsets were used once as validation set.
n
Erri
(4)
i=1
where n is the number of observations in the test set and
Erri = I yi = yˆ i , with I(·) an indicator function which
returns a value of 1 if the predicted and observed phenotypes are different, 0 otherwise. The cross-validation (CV)
error rate was then estimated averaging the test error rate
over all replicates:
1
CVk =
k
Threshold model
h2 =
This process was repeated 100 times, each time randomly
sampling different subsets, eventually yielding 500 replicates of the analysis. The test error rate in each replicate
was computed as:
k
ERi
(5)
i=1
Software
The programme Beagle was used to impute missing genotypes [17]. The computer package for linear mixed models
Asreml was used to fit the threshold model in (2) and estimate variance components [21]. Genomic relationships
between plants were estimated with “ad hoc” Python code.
Data preparation and figures were produced with the open
source statistical environment R [22].
Results
Realized relationships
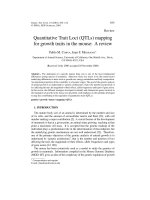
Figure 1 shows the heatmap of estimated genomic relationships between individual plants. Plants have been
ordered by root vigor (low and high) and line. Darker
colours indicate closer kinship between individuals. The
average genomic relationships was 0.365 (standard deviation 0.248; coefficient of variation 67.9%). The closest
lines appeared to be “LOW1” and “HIGH1” aij = 0.938 ;
the lines farthest apart were “HIGH2” and “HIGH13”
aij = 0.104 .
Heritability and classification
Model fit was evaluated comparing the full (model (2))
and the reduced (null model: the intercept only) models
through a likelihood ratio test. Deviance dropped significantly (p-value ≈ 0), showing good fit of the model.
The estimated genetic variance was 11.856, on the liability scale. From Eq. 3 heritability was then estimated as
h2 = 0.783, with a standard error of 0.086.
From cross-validation, 500 testing subsets were generated. In each of these, observations were classified according to the model fitted to the corresponding training
subset, and the classification error calculated as in (4),
then averaged over all subsets. The estimated crossvalidation error rate from (5) was 0.000731 (0.073%). Only
9 out of 12326 test observations (500 replicates for an
Biscarini et al. BMC Genetics 2014, 15:87
/>
Page 4 of 9
Figure 1 Heatmap of genomic relationships between sugar beet individual plants. Plants have been groupd by line. Darker colors indicate
stronger genomic relationships.
average test set size of 24.65) were wrongly classified. All 9
missclassified observations belonged to a single low-root
vigor line (line “LOW1”).
In the training sets observations were always correctly
classified (training error rate = 0). The average estimated
probability of having low or high root vigor was calculated for each plant across all 500 replicates of the training
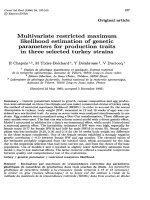
and testing sets. The box plots in Figure 2 show the wider
probability distribution in the test compared to the training data; the 9 misclassified observations in the test data
are represented by points beyond the P(Y = 0|X) = 0.5
dotted threshold line.
Discussion
In this paper, the problem of classifying binomial phenotypes using SNP markers in sugar beet (B. vulgaris) has
been addressed. A very low cross-validation test error rate
(<1%) was estimated for the genome-based classification
of root vigor in sugar beet lines. Genomic predictions with
different accuracies have been reported in literature: high
(e.g. 0.89 for soluble solids content in apple trees [23];
0.92 for fat and protein percentage in cattle [24]), moderate (e.g. ≈ 0.60 for egg weight in laying hens [25]) and
low (e.g. 0.38 for stem height in loblolly pines [26]) accuracy of prediction. Wang et al. ([10]) reported accuracies
ranging from 0.17 to 0.69 for a simulated categorical trait.
In sugar beet, moderate to high prediction accuracies were
estimated for a number of traits such as sugar content,
molasses loss, root yield and mineral (Na, K ) content
[13,14].
The few prediction errors were all observed in line
“LOW1”. This line had the strongest off-diagonal genomic
relationship with line “HIGH1”. “LOW1” and “HIGH1”
differ for root vigor (and related genes) but share most of
their genetic basis. The close relationship of “LOW1” to
“HIGH1” (a high root vigor line) may well explain why all
9 misclassifications were observed in this line, considering that SNP genotypes -through the genomic relationship
matrix- were used as predictors. The error rate in line
“LOW1” was nonetheless very low (∼ 1.1%).
The accuracy of genomic predictions is known to
depend on a number of factors related to the nature of
the analysed trait (e.g. heritability [3]) and to the experimental population at hand (e.g. sample size, number of
markers, relatedness between the training and validation
sets [3,27]).
Some relevant aspects are discussed below.
Genetic architecture of the trait
The high predictive ability for root vigor estimated in
this study (>99% of correct classifications) may be related
Biscarini et al. BMC Genetics 2014, 15:87
/>
Page 5 of 9
Figure 2 Box plots of estimated probability vs observed root vigor in the training (left) and validation/test (right) data. True high- and
low-root-vigor individuals are in light yellow and dark red respectively. The dotted line is the classification threshold (P(Y = [0/1] |X) = 0.5).
to the heritability of the trait and to the number of
segregating QTL underlying its expression: this is sometimes referred to as the “genetic architecture” of the
trait [28].
Root vigor has been estimated to have high heritability (≈ 80%). For a highly heritable trait, using genetic
markers to correctly predicting phenotypes is expected
to yield good results. The effect of heritability on error
rate was checked by fixing the heritability in model (2)
instead of estimating it from the data. This has the effect
of altering the covariance structure in the GBLUP mixed
model equations from model (2) by loosening the relationship between genotypes and phenotypes. Artificially
lower heritabilities of 0.5, 0.33 and 0.20 were tested by
rerunning the analysis with the same cross-validation
scheme and number of replicates. Figure 3 shows the boxplots of the error rate with the true heritability (utmost left
column) and with progressively lower heritabilities: both
the median error rate and the variance around it incresed
when reducing the heritability. The error rate for h2 = 0.5,
0.33 and 0.2 was 0.058 (5.8%), 0.128 (12.8%) and 0.181
(18.1%), respectively.
Not only the total genetic variance of a trait plays a
role in determining the accuracy of genomic predictions,
but also how this variance is spread along the genome
(i.e. the distribution of QTL/genes underlying the trait).
For a polygenic trait (i.e. determined by a large number
of genes) a large number of markers would be needed to
ensure that the genetic variance is fully captured. Contrariwise, for an oligogenic trait (i.e. determined only by
few genes), even a small number of markers -as in the
present study- may be sufficient to capture the genetic
variance of the trait, provided that these markers are close
to the relevant QTLs. A single-SNP genome-wide association study was performed in order to estimate marker
effects for root vigor. A logistic regression model of the
form logit(pi ) = μ + SNPm (pi = P(Y = 1|μ + SNPm );
SNPm : individual genotype at SNP m) was fit to the data.
The magnitude of estimated SNP effects is reported in
the barplot in Figure 4. Large marker effects appear to
cluster on specific scaffolds from a few chromosomes of
the sugar beet genome, while most SNPs do not seem to
have an appreciable effect on root vigor. Such distribution
of marker effects agrees with an oligogenic basis for the
trait root vigor. This, together with the high heritability
of the trait, may help explain the very low classification
error rate estimated with relatively few markers in this
study.
Biscarini et al. BMC Genetics 2014, 15:87
/>
Figure 3 Boxplot of the cross-validation test error rate for the original data (h2 = 0.783) and for lower heritabilities.
Figure 4 Snp effects for root vigor along the genome of B. vulgaris.
Page 6 of 9
Biscarini et al. BMC Genetics 2014, 15:87
/>
Linkage disequilibrium
The extent of linkage disequilibrium (LD) in the experimental population is a parameter relevant to the success
of genomic predictions. The basic assumption underlying
genome-wide predictions is indeed that observed genetic
markers and unobserved QTLs are in LD [6]. LD between
adjacent markers of around 0.2 -measured as r2 [29]- is
deemed to be required for reliable genomic predictions
[3]. Dense marker panels ensure that there is sufficient LD
between markers. With sparser panels this may not be the
case. The available release of the B. vulgaris genome was
not assembled in chromosomes, but organised in 82305
scaffolds (and contigs). The sugar beet genome sequence
comprises 567 Mbps of which 85% could be assigned
to chromosomes [30]. Most scaffolds -but not all- could
therefore be mapped to chromosomes; however, the relative position of the scaffolds along the chromosomes
was not known. Therefore, pairwise LD between adjacent
SNPs could be estimated only within scaffold.
The total average estimated LD between all pairs of
markers, measured as r2 , was 0.061. This values is below
what is needed for genomic predictions to work, but refers
to all markers, not only adjacent markers. Adjacent markers could be determined only within-scaffold; the average
within-scaffold pairwise LD was r2 = 0.404, which seems
to be largely sufficient for reliable genomic predictions.
Also the LD between markers with large effect on root
vigor (see Figure 4) was estimated: this was r2 = 0.327 on
Page 7 of 9
average, and can be interpreted as an indirect estimate of
the LD between markers and QTLs.
Figure 5 reports the LD heatmap between all markers
(large panel on the left) and between markers on three
scaffolds (small panels on the right): though no clear LD
patterns emerge from the total set of SNPs, a strong LD
structure is present on individual scaffolds.
Imputation accuracy
Imputing missing genotypes is usually a preliminary step
to the analysis of genomic data. After markers and individuals with low call-rate are edited out, there is usually
still a small proportion of uncalled genotypes (e.g. < 5%)
randomly distributed along the genome. Such missing
genotypes are imputed using pedigree-based or pedigreefree methods. Imputation accuracy is typically very high;
for instance, > 95% correctly imputed genotypes were
reported in maize [31] and cattle [32]. This usually applies
to scenarios in which moderate to high density marker
panels are available. With fewer markers genotype imputation may be less accurate, as a consequence of lower LD.
This may be especially true for pedigree-free imputation
methods, which rely heavily on between marker LD.
In order to estimate the accuracy with which genotypes were imputed in the present study, a subset with no
missing genotypes was extracted from the total dataset.
Increasing proportions of missing data were then artificially introduced in the data: 1%, 2%, 3%, 5%, 10% and 20%.
Figure 5 Linkage disequilibrium between all SNPs (left) and between SNPs on scaffolds 00184, 00349 and 00704 (right, from top to
bottom).
Biscarini et al. BMC Genetics 2014, 15:87
/>
Page 8 of 9
Table 3 Imputation accuracy with increasing proportions
of missing genotypes
% missing
ˆ
accuracy
1%
2%
3%
5%
10%
20%
0.8405
0.8402
0.8402
0.8396
0.8301
0.8089
The average proportion (over 5 replicates) of correctly imputed genotypes
ˆ
(accuracy)
was used to estimate imputation accuracy.
For each proportion of missing genotypes, 5 random replicates were generated. The average proportion of correctly
imputed genotypes over 5 replicates for each proportion
of missing data was then used to estimate an empirical
curve of the imputation accuracy. Results are summarised
in Table 3: the intersection between the empirical curve
and the percentage of missing genotypes in the original dataset (3.14%), provided an indirect estimate of the
imputation accuracy obtained in this study: 0.840. This
estimate appears to be quite robust, considering that up to
10% missing genotypes the empirical imputation accuracy
curve is substantially flat, and only for missing data > 10%
the accuracy of imputation seems to drop. An imputation
error of about 16% is higher than what is typically found in
humans and commercial crop and livestock populations.
This may be due to the lower extent of LD estimated in this
population with the availabe SNP panel, and to the lack of
a mature assembly of the genome (partial information on
chromosome structure and marker postion).
Comparison with another classification method
The threshold model used in this study for genomeenabled prediction of the binary trait root vigor in sugar
beet was compared with Support Vector Machine (SVM),
another widely adopted method for classification of categorical observations [20,33].
The kernel function and tuning parameter C to be
used in SVM were chosen so to minimize the classification error through 5-fold cross-validation. A linear kernel
p
(K (xi , xi ) = xi , xi = j=1 xij xi j , for individual plant i
and p parameters) and C = 0.01 were chosen and used
to classify sugar beet individual plants with SVM in the
same cross-validation procedure adopted for the threshold model (5-fold, 100 repetitions). The estimated error
rate was close to zero (0.025%), in line with what was
obtained with the threshold model (0.073%). The two classifiers were compared also by looking at the ROC curves
[34]: the two curves overlapped almost completely, having
both an area under the curve (AUC) close to 1 (∼0.98).
This shows that with both classifiers the total error rate
and the number of false positives and false negatives were
very low.
Applications to sugar beet breeding
Root vigor, expressed as high root elongation rate, is essential for the efficient acquisition of mobile soil nutrients
[35]; this is especially true in presence of water-nutritional
stress [36]. The increased root elongation rate in response
to low water availability or nutrient deprivation allow
plants to circumvent water or nutrients limitations [37].
Of all sugar beet morphological root traits, root elongation rate shows the largest variation between high- and
low-yielding genotypes and was shown to be significantly
correlated with sugar beet yield [15].
Root traits are difficult to be measured accurately and
this is an obstacle to reliable and effective selection.
Genomic data can be used for early and accurate prediction of root vigor in sugar beet seeds, thereby enhancing
the efficiency of breeding for rhizospheric stress tolerance
and yield in sugar beet. Improvements are likely to come
from shortened breeding cycles and more accurate and
less expensive phenotypic evaluation.
Conclusions
In this paper, the use of genomic information to predict a binomially distributed phenotype (root vigor) in
sugar beet populations was presented. Prediction accuracy proved to be quite high, with an estimated crossvalidation error rate close to zero (0.073%). Such excellent
prediction performance may be related to properties of
the analysed trait and available population. Root vigor was
estimated to have high heritability (0.783) and to be determined by few genes with large effect. Despite the sparse
SNP panel, there was sufficient within-scaffold LD where
SNPs with large effect on root vigor were located. For
an oligogenic highly heritable trait with a favorable distribution of markers on the genome, even with relatively
few SNPs very accurate predictions can be achieved. The
results described in this paper constitute an interesting
application of genomic predictions to binomial (and more
generally categorical/multinomial) traits, and may lead to
promising applications of genomic selection in sugar beet
breeding programmes.
Competing interests
The authors declare that they have no competing interests.
Authors’ contributions
FB carried out all statistical analyses and drafted most of the manuscript. PS, CB
and MS selected the experimental population and generated all molecular
and phenotypic data. AS contributed ideas to the work and drafted parts of
the manuscript. All authors read and approved the final manuscript.
Acknowledgements
This research was financially supported by the Marie Curie European
Reintegration Grant “NEUTRADAPT”.
Author details
1 Department of Bioinformatics, PTP, Via Einstein - Loc. Cascina Codazza,
Lodi, Italy. 2 DAFNE, Università di Padova, 24105 Padova, Italy. 3 IBBA-CNR, Via
Einstein, 26900 Lodi, Italy.
Received: 7 April 2014 Accepted: 4 July 2014
Published: 22 July 2014
Biscarini et al. BMC Genetics 2014, 15:87
/>
References
1. Van Tassell CP, Smith TP, Matukumalli LK, Taylor JF, Schnabel RD, Lawley
CT, Haudenschild CD, Moore SS, Warren WC, Sonstegard TS: Snp
discovery and allele frequency estimation by deep sequencing of
reduced representation libraries. Nat Med 2008, 5(3):247–252.
2. Abraham G, Tye-Din JA, Bhalala OG, Kowalczyk A, Zobel J, Inouye M:
Accurate and robust genomic prediction of celiac disease using
statistical learning. PloS one 2013, 10(2):1004137.
3. Hayes B, Bowman P, Chamberlain A, Goddard M: Invited review:
genomic selection in dairy cattle: Progress and challenges. J Dairy Sci
2009, 92(2):433–443.
4. Albrecht T, Wimmer V, Auinger H-J, Erbe M, Knaak C, Ouzunova M,
Simianer H, Schön C-C: Genome-based prediction of testcross values
in maize. Theor Appl Genet 2011, 123(2):339–350.
5. Kumar S, Bink MC, Volz RK, Bus VG, Chagné D: Towards genomic
selection in apple (malus× domestica borkh.) breeding
programmes: prospects, challenges and strategies. Tree Genet
Genomes 2012, 8(1):1–14.
6. Meuwissen T, Hayes B, Goddard ME: Prediction of total genetic value
using genome-wide dense marker maps. Genetics 2001,
157(4):1819–1829.
7. González-Recio O, Gianola D, Long N, Weigel KA, Rosa GJ, Avendaño S:
Nonparametric methods for incorporating genomic information
into genetic evaluations: an application to mortality in broilers.
Genetics 2008, 178(4):2305–2313.
8. Villanueva B, Fernández J, García-Cortés L, Varona L, Daetwyler H, Toro M:
Accuracy of genome-wide evaluation for disease resistance in
aquaculture breeding programs. J Anim Sci 2011, 89(11):3433–3442.
9. Manor O, Segal E: Predicting disease risk using bootstrap ranking and
classification algorithms. PLoS Comput Biol 2013, 9(8):1003200.
10. Wang C, Ding X, Wang J, Liu J, Fu W, Zhang Z, Yin Z, Zhang Q: Bayesian
methods for estimating gebvs of threshold traits. Heredity 2013,
110(3):213–219.
11. Ornella L, Pérez P, Tapia E, González-Camacho J, Burgueño J, Zhang X,
Singh S, Vicente F, Bonnett D, Dreisigacker S, Singh R, Long N, Crossa J:
Genomic-enabled prediction with classification algorithms. Heredity
2014, 112(6):616–626.
12. Gianola D: Theory and analysis of threshold characters. J Anim Sci
1982, 54(5):1079–1096.
13. Hofheinz N, Borchardt D, Weissleder K, Frisch M: Genome-based
prediction of test cross performance in two subsequent breeding
cycles. Theor Appl Genet 2012, 125(8):1639–1645.
14. Würschum T, Reif JC, Kraft T, Janssen G, Zhao Y: Genomic selection in
sugar beet breeding populations. BMC Genet 2013, 14(1):85.
15. Stevanato P, Trebbi D, Saccomani M: Root traits and yield in sugar
beet: identification of aflp markers associated with root elongation
rate. Euphytica 2010, 173(3):289–298.
16. Stevanato P, Broccanello C, Biscarini F, Del Corvo M, Sablok G, Panella L,
Stella A, Concheri G: High-throughput rad-snp genotyping for
characterization of sugar beet genotypes. Plant Mol Biol Rep 2014,
32(3):691–696.
17. Browning SR, Browning BL: Rapid and accurate haplotype phasing
and missing-data inference for whole-genome association studies
by use of localized haplotype clustering. Am J Hum Genet 2007,
81(5):1084–1097.
18. Habier D, Fernando R, Dekkers J: The impact of genetic relationship
information on genome-assisted breeding values. Genetics 2007,
177(4):2389–2397.
19. VanRaden P: Efficient methods to compute genomic predictions. J
Dairy Sci 2008, 91(11):4414–4423.
20. Hastie T, Tibshirani R, Friedman J: Model assessment and selection. In
The Elements of Statistical Learning. Volume 2. New York, NY, USA: Springer
New York Inc.; 2009:241–247.
21. Gilmour AR, Gogel B, Cullis B, Thompson R: Asreml User Guide Release 3.0.
Hemel Hempstead: VSN International Ltd; 2009.
22. R Development Core Team: R: A Language and Environment for Statistical
Computing. Vienna: R Foundation for Statistical Computing; 2008. ISBN
3-900051-07-0. []
23. Kumar S, Chagné D, Bink MC, Volz RK, Whitworth C, Carlisle C: Genomic
selection for fruit quality traits in apple (malus× domestica borkh.).
PloS one 2012, 7(5):36674.
Page 9 of 9
24. Charfeddine N, Rodríguez-Ramilo ST, Jiménez-Montero JA, Carabaño MJ,
González-Recio O: Non parametric vs. gblup model for genomic
evaluation with large reference population in holstein cattle.
Interbull Bull 2013, 47:67–76.
25. Wolc A, Stricker C, Arango J, Settar P, Fulton JE, O’Sullivan NP, Preisinger R,
Habier D, Fernando R, Garrick DJ, Lamont SJ, Dekkers JCM: Breeding
value prediction for production traits in layer chickens using
pedigree or genomic relationships in a reduced animal model. Genet
Sel Evol 2011, 43(5):1–9.
26. Resende MF, Muñoz P, Resende MD, Garrick DJ, Fernando RL, Davis JM,
Jokela EJ, Martin TA, Peter GF, Kirst M: Accuracy of genomic selection
methods in a standard data set of loblolly pine (pinus taeda l.).
Genetics 2012, 190(4):1503–1510.
27. Pszczola M, Strabel T, Mulder H, Calus M: Reliability of direct genomic
values for animals with different relationships within and to the
reference population. J Dairy Sci 2012, 95(1):389–400.
28. Daetwyler HD, Pong-Wong R, Villanueva B, Woolliams JA: The impact of
genetic architecture on genome-wide evaluation methods. Genetics
2010, 185(3):1021–1031.
29. Hill W, Robertson A: Linkage disequilibrium in finite populations.
Theor Appl Genet 1968, 38(6):226–231.
30. Dohm JC, Minoche AE, Holtgräwe D, Capella-Gutiérrez S, Zakrzewski F,
Tafer H, Rupp O, Sörensen TR, Stracke R, Reinhardt R, Goesmann A, Kraft T,
Schulz B, Stadler PF, Schmidt T, Gabaldón T, Lehrach H, Weisshaar B,
Himmelbauer H: The genome of the recently domesticated crop
plant sugar beet (beta vulgaris). Nature 2013, 505:546–549.
31. Hickey JM, Crossa J, Babu R, de los Campos G: Factors affecting the
accuracy of genotype imputation in populations from several maize
breeding programs. Crop Sci 2012, 52(2):654–663.
32. VanRaden PM, O’Connell JR, Wiggans GR, Weigel KA: Genomic
evaluations with many more genotypes. Genet Sel Evol 2011, 43:10.
33. Hornik K, Meyer D, Karatzoglou A: Support vector machines in r. J Stat
Software 2006, 15(9):1–28.
34. Fawcett T: Roc graphs: Notes and practical considerations for
researchers. Mach Learn 2004, 31:1–38.
35. Stevanato P, Saccomani M, Bertaggia M, Bottacin A, Cagnin M, De Biaggi
M, Biancardi E: Nutrient uptake traits related to sugarbeet yield. J
Sugar Beet Res 2004, 41:89–100.
36. Saccomani M, Stevanato P, Trebbi D, McGrath JM, Biancardi E: Molecular
and morpho-physiological characterization of sea, ruderal and
cultivated beets. Euphytica 2009, 169(1):19–29.
37. Huang B: Water relations and root activities of buchloe dactyloides
and zoysia japonica in response to localized soil drying. Plant Soil
1999, 208(2):179–186.
doi:10.1186/1471-2156-15-87
Cite this article as: Biscarini et al.: Genome-enabled predictions for
binomial traits in sugar beet populations. BMC Genetics 2014 15:87.
Submit your next manuscript to BioMed Central
and take full advantage of:
• Convenient online submission
• Thorough peer review
• No space constraints or color figure charges
• Immediate publication on acceptance
• Inclusion in PubMed, CAS, Scopus and Google Scholar
• Research which is freely available for redistribution
Submit your manuscript at
www.biomedcentral.com/submit