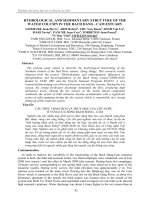
Genetic diversity and population structure of the Tibetan poplar (Populus szechuanica var. tibetica) along an altitude gradient
Bạn đang xem bản rút gọn của tài liệu. Xem và tải ngay bản đầy đủ của tài liệu tại đây (1.82 MB, 10 trang )
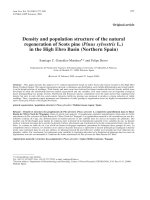
Shen et al. BMC Genetics 2014, 15(Suppl 1):S11
/>
PROCEEDINGS
Open Access
Genetic diversity and population structure of the
Tibetan poplar (Populus szechuanica var. tibetica)
along an altitude gradient
Dengfeng Shen, Wenhao Bo, Fang Xu, Rongling Wu*
From International Symposium on Quantitative Genetics and Genomics of Woody Plants
Nantong, China. 16-18 August 2013
Abstract
Background: The Tibetan poplar (Populus szechuanica var. tibetica Schneid), which is distributed at altitudes of
2,000-4,500 m above sea level, is an ecologically important species of the Qinghai-Tibet Plateau and adjacent areas.
However, the genetic adaptations responsible for its ability to cope with the harsh environment remain unknown.
Results: In this study, a total of 24 expressed sequence tag microsatellite (EST-SSR) markers were used to evaluate
the genetic diversity and population structure of Tibetan poplars along an altitude gradient. The 172 individuals
were of genotypes from low-, medium- and high-altitude populations, and 126 alleles were identified. The
expected heterozygosity (HE) value ranged from 0.475 to 0.488 with the highest value found in low-altitude
populations and the lowest in high-altitude populations. Genetic variation was low among populations, indicating
a limited influence of altitude on microsatellite variation. Low genetic differentiation and high levels of gene flow
were detected both between and within the populations along the altitude gradient. An analysis of molecular
variance (AMOVA) showed that 6.38% of the total molecular variance was attributed to diversity between
populations, while 93.62% variance was associated with differences within populations. There was no clear
correlation between genetic variation and altitude, and a Mantel test between genetic distance and altitude
resulted in a coefficient of association of r = 0.001, indicating virtually no correlation.
Conclusion: Microsatellite genotyping results showing genetic diversity and low differentiation suggest that
extensive gene flow may have counteracted local adaptations imposed by differences in altitude. The genetic
analyses carried out in this study provide new insight for conservation and optimization of future arboriculture.
Introduction
Altitude gradients represent one of the most useful natural
environments to investigate ecological and evolutionary
responses of biota to geophysical influences [1]. For species from habitats which cover different altitudes, differences in their spatial population structure could be due to
restricted gene movement, as a result of non-random mating or geographic barriers [2,3]. Outliers of species found
at the boundaries of their distribution zones could be
* Correspondence:
Center for Computational Biology, National Engineering Laboratory for Tree
Breeding, Key Laboratory of Genetics and Breeding in Forest Trees and
Ornamental Plants, Ministry of Education, College of Biological Sciences and
Biotechnology, Beijing Forestry University, Beijing, China
subject to limited gene flow, a small population size and
founder effects, all of which lead to a decrease in genetic
diversity and an increase in population differentiation [4].
For species living in mountainous areas, altitude changes
represent a series of physical factors that can result in the
establishment of different populations and species. These
factors form barriers, which influence genetic diversity and
population structure [5-7], and include factors such as
rainfall [8] and temperature [9]. There is no general rule
to summarize the relationship between genetic diversity
and altitude; for trees on mountainsides, the pattern of
genetic diversity along the altitude gradient is divided into
four groups. (1) Populations at an intermediate altitude
have greater diversity than populations at lower and higher
© 2014 Shen et al.; licensee BioMed Central Ltd. This is an Open Access article distributed under the terms of the Creative Commons
Attribution License ( which permits unrestricted use, distribution, and reproduction in
any medium, provided the original work is properly cited. The Creative Commons Public Domain Dedication waiver (http://
creativecommons.org/publicdomain/zero/1.0/) applies to the data made available in this article, unless otherwise stated.
Shen et al. BMC Genetics 2014, 15(Suppl 1):S11
/>
altitudes, due to local adaptation and milder environmental conditions [10,11]. (2) Populations at higher altitudes
have greater diversity than those at lower altitudes if the
higher altitude conditions are similar to their home sites,
representing higher fitness [12]. (3) Populations at lower
altitudes have greater diversity than those at higher altitudes, as higher altitudes impede growth and the expanding of species countering the bottleneck leaded to decrease
of genetic diversity [13]. (4) Populations show no differences in diversity at differing altitudes [14], the pattern
may be due to that the sampling area was part of main distribution area, limited number of populations sampled
along the gradient may cause the failure to detect altituderelated trends. On the other hand, if the sampled population was large enough, extensive gene flow and other factors also could lead to the similar pattern..
The Qinghai-Tibetan Plateau (QTP) is the highest and
largest plateau in the world, with a mean altitude of
4 000 m above sea level, and an area of 2.5 × 10⁶ km2. In
recent years, the QTP has become a hotspot for plant
phylogeographical studies [15,16], focusing mainly on the
population dynamics that took place during the Quaternary (reviewed in Qiu et al.) [17]. However, genetic variation patterns along altitudinal gradients of the QTP
remain unclear.
The Tibetan poplar belongs to Populus sect. Tacamahaca
in the genus Populus and is an ecologically important species, mainly distributed in Sichuan and Tibet at altitudes
from 2 000 to 4 500 m [18]. Recent studies have focused
mainly on the phylogenic and physiological mechanisms
responsible for its resistance to the harsh environment
where the lowest temperature is -30°C and the annual average temperature is between 4°C to 12°C [19]. However,
there is a pressing need to understand the genetic diversity
along altitude gradients. In this paper we investigated the
genetic variation of the Tibetan poplar along an altitude gradient using microsatellite genotyping. The specific objectives
were: (1) to understand the genetic variation and differentiation within and between populations, and (2) to detect any
influence of altitude gradients on genetic diversity.
In this study, a total of 24 EST- SSR loci based on
Populus euphratica transcriptome [20] were used to
analyze the genetic diversity and population structure of
Tibetan poplar populations at different altitudes in the
Sejila mountain area. The objectives were to provide a
complete picture of the genetic diversity of Tibetan
poplar populations at different altitudes in the Sejila
mountain area, and to identify a relationship between
genetic variation and differences in altitude.
Materials and methods
Sampling strategy and DNA extraction
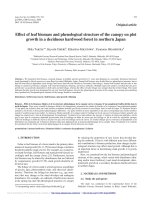
We collected leaves from 64, 34 and 74 individuals from
high-, medium- and low-altitude populations, respectively
Page 2 of 10
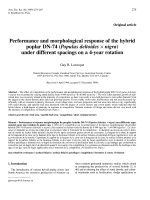
(Figure 1, Table 1). Our sampling scheme was to divide
the distribution areas of the Tibetan poplar in the Sejila
mountains (in southeastern Tibet) into three altitude-gradient groups (high, medium, and low), even though the
trees are distributed continuously throughout the area.
We selected individuals at a minimum of 30 m apart to
prevent selection of clones. The leaf was rapidly dehydrated using silica gel beads. Total genomic DNA was
extracted from approximately 0.5 g of silica-dried leaf
using a modified version of the cetyltrimethyl ammonium
bromide method [21]. The quality and concentration of
the extracted DNA were determined by 1% agarose
gel electrophoresis and ultraviolet spectrophotometry. The
DNA samples were diluted to 5-10 ng/μL for use as
the template for polymerase chain reaction (PCR)
amplification.
Primer selection
113 EST-SSR primer pairs based on the Populus euphratica transcriptome [20] were developed and tested for
suitability in the Tibetan poplar. DNA extracted from
four Tibetan poplar individuals was amplified, and the
amplicons were sequenced to confirm the existence of
and enumerate repeat motifs. DNA from eight individuals was used to test for polymorphisms of the successfully amplified primers. SSRs were selected if they had at
least three alleles and exhibited robust amplification.
SSR amplification
After screening, 24 primer pairs were selected for the
PCR analysis. The forward primer of each pair was
tagged with a section of the universal M13 sequence (5′TGTAAAACGACGGCCAGT-3′) during synthesis. Each
10-μL PCR mixture contained 1× Taq buffer, 0.2 µM
dNTPs, 10-20 ng template DNA, 1.6 pmol reverse primer, 1.6 pmol fluorescently labeled M13 primer,
0.4 pmol forward primer and 1 U Taq polymerase
(BioMed). PCR amplification was performed using a Biometra thermocycler (Biometra, Goettingen, Germany)
under the following conditions: 94°C for 5 min; 30 cycles
of 94°C for 30 s, annealing at 56°C for 45 s and elongation at 72°C for 45 s; 8 cycles of 94°C for 30 s, annealing
at 53°C for 45 s, elongation at 72°C for 45 s; and a final
extension at 72°C for 10 min. The PCR products were
separated by capillary electrophoresis using an ABI
3730xl DNA Analyzer (Applied Biosystems, Foster City,
CA, USA) after confirmation of amplification on a 1.5%
agarose gel. Approximately 0.5 μL of the PCR products
obtained using each of the four fluorescently labeled primers was then combined. The products were separated
using an ABI 3730xl DNA Analyzer with GeneScan-500
LIZ as an internal marker (Applied Biosystems). The
amplicon fragments were sized using GeneMarker version 1.75 (Soft Genetics LLC, State College, PA, USA).
Shen et al. BMC Genetics 2014, 15(Suppl 1):S11
/>
Page 3 of 10
Figure 1 Populus szechuanica population locations. In the Sejila mountain area, we selected three different altitude gradients to select
samples.
Data analysis
The FLEXIBIN software was used for automated binning
of the raw molecular data[22], and the Excel Microsatellite Toolkit [23] was used to convert the size data into a
format suitable for further analysis. Genetic parameters
were estimated under the hypothesis that all the loci
were neutral, thereby presenting a true picture of the natural genetic structure affected by neutral forces such as
genetic drift and gene flow, etc. There are several methods of investigating whether a particular locus has been
under selection pressure. We performed the FST outlier
test using LOSITAN [24] to identify candidate SSR loci
possibly under selection pressure [25]. After removal of
outlier loci, the remaining data were used to estimate the
genetic diversity of the population. Genetic diversity
parameters used included: number of alleles (Na);
observed heterozygosity (HO); expected heterozygosity
(HE) within a subpopulation; Wright’s fixation indices for
within-subpopulation (FIS) and in the total population
(FIT); and pair-wise differentiation among subpopulations
(FST), according to Weir & Cockerham [26]. FIS measures
the deviation from the Hardy-Weinberg equilibrium
(HWE) of genotype frequencies in sub-populations,
whereas F IT measures the deviation from HWE in the
total population. The values of FIT and FIS can be negative, whereas F ST is always a positive value. The Shannon’s diversity index was conducted using Nei’s model,
along with the expected heterozygosity [27]. Gene flow
(Nm) was calculated to ascertain the conditions of gene
communication among populations, and was estimated
as follows: Nm = (1- FST)/4 FST [28]. Summary statistics
were calculated using POPGENE version 1.32 [29]. Interand intra-population differentiation was determined
by AMOVA analysis using the GenAlEx software version
6.41 [30]. Clustering, based on a Bayesian model which
assumed that all the individuals were from K real populations (where K may be unknown), each of which is characterized by a set of allele frequencies at each locus, the
method attempts to assign individuals to populations on
the basis of their genotypes, while simultaneously estimating population allele frequencies. The model was used to
evaluate the genetic structures of the Tibetan poplar populations using STRUCTURE in its extended version 2.3.3
[31,32]. STRUCTURE is based on a model-based clustering
Table 1 Locations of Populus szechuanica populations.
Pop code
Elevation(m)
Location
Latitude(N)
Longitude(E)
Sample size
Low
2000-2100
Tongmai, Linzhi, Tibet
30°05.81
95°04.15
64
Middle
2300-2700
Lulang, Linzhi, Tibet
30°10.33
94°56.15
34
High
2900-3090
Lulang, Linzhi, Tibet
29°50.9
94°45.8
74
Shen et al. BMC Genetics 2014, 15(Suppl 1):S11
/>
algorithm that applies a Bayesian framework and the Markov chain Monte Carlo (MCMC) algorithm. The optimum
number of subpopulations (K) was confirmed after 20
independent runs for each value of K between 1 and 10.
The length of the burn-in period and number of MCMC
reps after burn-in were set to 25,000 and 100,000, respectively. The K subpopulations identified indicated clusters
characterized by a set of allele frequencies at each locus,
where individuals were assigned to a subpopulation, or to
two or more populations, if the genotype indicated
that they are admixed [33]. In this study, the identification
of K used the model developed by Evanno et al. [34]. The
Bayesian framework was not used to estimate the nonhomogeneous original populations, instead we used ΔK,
which was based on the rate of change in the log probability of data between successive Ks. STRUCTURE accurately
detected the uppermost hierarchical level structure for the
scenarios tested.
A Mantel test, performed with GenAlEx version 6.41
[30], was used to calculate the coefficient of association
between genetic distance and altitude.
Results
SSR genotyping
SSRs are generally used in genetic diversity studies as
evolutionary neutral markers. In this study, 24 SSR
Page 4 of 10
primer pairs were developed using the Populus euphratica genome, which were transferable to the Tibetan
poplar. Sequencing results were uploaded to GenBank,
(Table 2). In total, 114 alleles for 24 loci were amplified
(mean = 4.75, SD = 2.71), with locus 7 having 12 alleles
and exhibiting the most variation. Locus 18 was detected
using LOSITAN based on its FST value(0.16) [24], which
showed that it was under positive natural selection
( p = 0.01) (Figure 2). Subsequently, the sequence was
processed using NCBI BLAST [35], and there was high
homology with a protein (ID: XM_002311699.1) present
in Populus trichocarpa. This implied that this SSR locus
could be under selection pressure.
Genetic diversity
Previous assessment of genetic diversity among three
populations of Tibetan poplar was based on allelic variation observed at 23 neutral microsatellite loci. In this
study, a mean of 3.71 alleles per locus were confirmed
for all 23 loci in 172 Tibetan poplar individuals. HO and
HE are important parameters for assessing genetic diversity of populations, and they ranged from 0.40-0.42 and
0.48-0.49, respectively. In the three populations, as the
results were consistent with the Na, it indicated that
genetic variation was not significant, and the populations were similar in all parameters. F IS presented a
Table 2 Descriptions of and references for the 24 SSR loci analyzed.
ID
Motif
Forward primer
Reverse primer
Allele range
Genebank ID
U18679
U21882
(TGC)7
(GAT)6
ACATCAGGTGGTCTTCCTCG
GCGGACGGTCTTGATTACAT
GCATGCTTAAGGCACGAGTT
TCTTTCGACCCTTTTAGCGA
401-413
305-329
KF501217
KF501218
U22153
(AC)13
TTCCACAAGCCATACCACAA
CCACCTTTCGTAACCTTGGA
269-281
U61645
(TG)13
AATGGTATAGCCGGCCTCTT
ACAGGAGAAGGGGGAGATGT
220-222
KF501226
U63239
(CTC)6
TTTGCTCTGTGAACGCAATC
AGCTTGTGGATTTGTCTGCG
202-205
KF501227
U78717
(GT)10
CTGGTATGGATGGATTTGGG
ATTAAGCCCAAGCCTTCACC
237-239
KF501231
U7452
(AC)11
CCCCCTCCTTACATCTTATGG
CTGGAAAGTGCATCTCCGAT
265-287
KF501215
U64059
(AG)10
TGTGCAATTGTGAGGTCAAT
GCAACCTAAATGACCACCTTG
295-315
KF501228
U7459
U60914
(CT)12
(AG)11
TCCTTCCTTCACGAAGCACT
TTGACCCCCAGTTCAGATTC
GTGGGCAAGCTCTTTGAAAC
GGCAAATTCGCCCTAGAATTA
325-337
226-238
KF501216
KF501225
U78
(GAGCTG)3
TGTCAGCTCTTCACCACCTG
CAGAAAGGGAGAACCCACAA
176-194
KF501212
U74541
(AC)10
GACCCACACCCACAAAAGAT
TCACATGAATTTGCTCGAGTG
217-221
KF501230
U4192
(AAAAAT)3
GCAGTGGAGAAGAAGCATCC
CGTTGCTTTCGCAGACAATA
298-313
KF501213
U16390
(TGGGGA)3
TGGAGTCCGAGGAAGAGAGA
TCGTCACTTTTGCAAGCATC
454-560
U16
(GAG)9
GGAGGACCAGATAAGGGAGC
TGGGGTAAGCTGACTTGCTT
222-234
KF501211
U45275
(TTC)7
TGCAGTTTTAGGCCTCTTCC
CTGCAGAATTCCACATCCAA
181-193
KF501224
U35013
U65600
(CT)16
(AG)14
TTTCCAGGGACAGAACTTCG
GTCTTTGGTGGCTACACCGT
GATGGGGTGAGAGAGGAACA
CTCAATCCTTTCCTTGGTGG
110-134
229-240
KF501229
U37186
(CA)10
TAACATGGCGAGTAGGGACC
GCCAAACAGACCTCGATCAT
399-403
KF501221
U6496
(TTCTT)5
GTAAACAAAGGGACCCCTCC
CCCAAATCCCCAATTATTCC
290-298
KF501214
U34847
(AG)14
TCTCCTCTCCTTTCCACCAA
AAAAAGCCCAAGGATCAGGT
182-199
KF501219
U38100
(GT)12
GCTGTGCTTGAGGATGATGA
CCCTAATCCCACCTCTTGAA
210-225
KF501223
U38010
(TTG)12
ACCACCTTCATGTTCTTGGC
CCGTTTCTTTCACTCCCAAA
309-337
KF501222
U35536
(AGAAGT)3
TGAAATTGGGTGGTGCAGTA
CTCTTCACCAAAACCCTCCA
269-275
KF501220
Shen et al. BMC Genetics 2014, 15(Suppl 1):S11
/>
Page 5 of 10
Figure 2 FST values of 24 microsatellite loci vs heterozygosity in the Populus szechuanica population. The dot in the red area is the locus
U65600 which is positively under nature selection.
similar pattern in that no significant difference was
detected among populations; it ranged from -0.85 to
0.56 (mean = 0.17, SD = 0.18), with only a moderate difference for loci from trees at low altitude. The FST was
estimated at each locus for all individuals, and ranged
from 0.0004 to 0.16 (table 3), indicating that there was
no evidence to support the hypothesis that the populations differed from each othe r.
Genetic structure
The AMOVA indicated different levels of genetic variance among populations and among individuals within
populations. Of the total genetic variance, 6.67% was
ascribed to population divergence; the remainder was
ascribed to the differences between individuals. However, there was a significant difference among populations (p < 0.001). In populations sampled from high,
medium, and low altitudes, all genetic diversity parameters were similar, indicating no local adaptation or
population differentiation in the study area.
The SSR data was sorted in order of altitude. Population
structure analysis was processed according to the known
order of individuals, yielding an optimal of K = 2 [34].
Estimated populations of the 172 individuals are shown
(Figure 3). The samples plot showed that low- and highaltitude individuals were considered to originate from a
single group. However, the medium-altitude group was an
admixture of the high- and low-altitude groups, and there
was no clear separation between the groups (Figure 4).
The FST value showed little differentiation between the
populations. Since STRUCTURE could not perform an
analysis of K = 1 on populations with no difference, we
did not accept the results of K = 2, based on the low FST
and the genetic parameters pattern among the three populations. To compare the structure of new clusters (cluster
1 and cluster 2), further STRUCTURE analyses were performed in cluster 1, which contained individuals from a
high altitude, and cluster 2 from low altitude. It shows no
clear structure despite peaks in K = 3 for cluster 1 and K
= 2 for cluster 2 (Figure 5). The ancestry values of all of
the individuals revealed that each had an equal probability
of being grouped in cluster 1, 2 or 3 for the high- and lowaltitude clusters. An analysis based on the Mantel test
(Figure 6) showed that genetic distance was not significantly correlated with altitude (r2 = 0.001, p ≤ 0.07), suggesting that altitude was not the principal factor
influencing genetic differentiation in the Tibetan poplar.
Discussion
SSR markers and neutrality
In this study, we used GeneMarker version 1.75 to identify
the fluorescently labeled PCR products. We selected 24
SSR primer pairs based on the Populus euphratica genome,
to analyze genetic diversity within three populations of
Tibetan poplar living at different altitudes in Linzhi, Tibet.
As the loci were transferable between the two species, this
indicates that they may be sited in a conserved region.
However, based on the FST using LOSITAN, one locus
appeared to be an outlier. SSR loci mutations occasionally
occur as a result of the stress of adapting to a change of
Shen et al. BMC Genetics 2014, 15(Suppl 1):S11
/>
Page 6 of 10
Table 3 Comparisons of genetic diversity and differentiation among Populus szechuanica populations along altitude
gradients.
L
I
Ho
M
He
Fis
Na
I
Ho
H
He
Fis
Na
I
Ho
total
Locus
Na
He
Fis
Fit
ssr1
2
0.086 0.034 0.033 -0.017
2
0.215 0.111 0.105 -0.059
3
0.219 0.100 0.096 -0.046 -0.035 0.012
20.945
ssr2
ssr3
3
4
0.272 0.095 0.120
1.238 0.566 0.676
0.209
0.163
5
4
0.762 0.303 0.345 0.121
1.052 0.654 0.605 -0.081
4
5
1.068 0.487 0.587
1.136 0.433 0.628
0.172
0.310
2.450
5.143
ssr4
2
0.667 0.419 0.475
0.116
2
0.656 0.303 0.463
0.345
2
0.693 0.420 0.500
0.159
0.238
0.042
5.766
ssr5
3
0.645 0.254 0.376
0.323
3
0.627 0.387 0.362 -0.069
3
0.828 0.500 0.480 -0.042
0.069
0.007
34.496
ssr6
2
0.650 0.569 0.457 -0.245
2
0.688 0.367 0.495
0.259
2
0.585 0.429 0.396 -0.084
0.011
0.023
10.542
ssr7
8
1.588 0.639 0.768
0.168
10
1.761 0.688 0.758
0.093
7
1.489 0.767 0.715 -0.073
0.104
0.040
5.936
ssr8
9
1.566 0.542 0.712
0.238
5
1.274 0.643 0.666
0.035
5
1.164 0.514 0.618
0.167
0.163
0.017
14.129
0.237
0.174
Fst
0.093
0.046
Nm
ssr9
5
0.882 0.167 0.528
0.684
2
0.627 0.240 0.435
0.449
2
0.570 0.279 0.382
0.269
0.499
0.017
14.483
ssr10
ssr11
3
4
0.733 0.508 0.507 -0.002
1.031 0.516 0.583 0.116
2
4
0.460 0.276 0.285
1.154 0.552 0.646
0.033
0.146
3
5
0.495 0.310 0.293 -0.059
1.165 0.414 0.654 0.366
0.097
0.226
0.104
0.017
2.148
14.936
ssr12
2
0.689 0.535 0.496 -0.077
2
0.605 0.517 0.414 -0.248
2
0.466 0.177 0.291
0.393
0.041
0.062
3.784
ssr13
4
1.002 0.500 0.528
0.053
4
0.875 0.483 0.531
5
1.178 0.623 0.618 -0.009
0.062
0.021
11.776
ssr14
2
0.674 0.446 0.481
0.071
2
0.693 0.546 0.500 -0.092
2
0.680 0.541 0.487 -0.112 -0.040 0.005
47.305
ssr15
3
0.574 0.180 0.299
0.397
4
0.512 0.107 0.229
0.532
3
0.442 0.167 0.249
0.023
10.830
ssr16
3
0.732 0.377 0.467
0.193
3
0.647 0.464 0.401 -0.157
3
0.643 0.458 0.423 -0.084 -0.002 0.005
53.991
ssr17
5
1.095 0.245 0.569
0.569
6
1.565 0.407 0.753
0.459
7
1.449 0.258 0.700
0.632
0.563
0.029
8.384
ssr19
ssr20
2
2
0.641 0.340 0.449
0.641 0.340 0.449
0.243
0.243
2
2
0.628 0.357 0.436
0.628 0.357 0.436
0.181
0.181
2
2
0.627 0.443 0.435 -0.018
0.627 0.443 0.435 -0.018
0.137
0.137
0.000 675.978
0.000 675.978
ssr21
7
1.074 0.469 0.501
0.064
5
0.713 0.367 0.323 -0.136
6
0.497 0.250 0.226 -0.107 -0.008 0.025
9.730
ssr22
5
1.236 0.516 0.644
0.198
4
1.098 0.448 0.599
0.252
4
0.974 0.400 0.557
0.281
0.255
0.018
14.047
ssr23
5
1.286 0.661 0.692
0.045
5
1.424 0.759 0.731 -0.038
8
1.644 0.813 0.783 -0.037
0.008
0.020
12.438
ssr24
2
0.576 0.424 0.387 -0.094
2
0.562 0.433 0.375 -0.156
2
0.593 0.409 0.404 -0.014 -0.085 0.001 314.685
Mean
0.091
0.329
0.428
3.7917 0.856 0.404 0.488
0.172
3.583 0.840 0.422 0.477
0.115
3.833 0.836 0.407 0.475
0.143
0.172
0.034
St. Dev 1.9777 0.366 0.170 0.169
0.200
1.886 0.374 0.166 0.167
0.212
1.857 0.374 0.180 0.171
0.230
0.181
0.038 189.235
7.020
Na: allele number
I: Shannon index
Ho: observed heterozygosity
He: expected heterozygosity
Fis: fixation index in subpopulations
Fit: fixation index in total population
Fst: genetic differentiation of subpopulations
Nm: Gene flow estimated from Fst
environment [36] or an external stimulus [37]. Further, studies have shown that some SSR loci are non-neutral
[38,39], and for this reason it is essential that a neutrality
test is performed before the SSR data are used in any
further analysis. The outlier locus sequence was processed
using NCBI BLAST [35], and indicated high homology
with a protein in Populus trichocarpa. We conclude that
the microsatellite may be linked to expressed genes, and
therefore, neutrality should not be assumed, but tested in
all of the markers before genetic diversity and structure
analysis. This type of marker, however, could be useful for
phylogenetic studies of closely related species [40,41].
Genetic diversity
As expected from perennial and woody species ranging
across most areas of the Qinghai-Tibet plateau, the
study population contained a high level of genetic diversity, but we did not identify any significant differences
among the three populations from different altitudes.
The number of alleles per locus in our study was less
than in other related Populus species [42]. A mean of
6.1 alleles per locus was identified from the existing literature on Populus genetic diversity [42]. The Na of
3.73 in our study is lower than the Na in P. tremuloides
(4.9) as described previously [43]. The difference is most
likely due to the limited sampling area. We only collected samples from one mountain area, whereas the
Tibetan poplar is distributed throughout southwestern
China, of which our samples were from a limited proportion, as we aimed to study adaptation and genetic
diversity along an altitude gradient. The samples from
high, medium, and low altitudes appeared to be similar
Shen et al. BMC Genetics 2014, 15(Suppl 1):S11
/>
Page 7 of 10
Figure 3 Identification of K. the method of delta K was used to identify the accurate sub-clusters in the population. In this population
there is a peak of delta K in K = 2, the population is possibly composed of two sub-clusters.
in genetic diversity and showed no evidence of local
adaptation in the study area. STRUCTURE analysis
showed that the population could be divided into two
groups (clusters), with individuals from the lower altitude clustered into group 1, and those from the higher
altitude clustered into group 2. Altitude appeared to
have a direct relationship with the distribution of the
groups, but the FST value showed little differentiation
between the populations. As STRUCTURE could not
provide data for K = 1, we rejected the result showing
that the population was divided into two groups. There
was no peak in the estimate of the log-likelihood of the
Figure 4 Population structure of Populus szechuanica estimated by STRUCTURE. In the figure, the individuals were sorted as the altitude of
sampling distributed area.
Shen et al. BMC Genetics 2014, 15(Suppl 1):S11
/>
Page 8 of 10
Figure 5 Structure analysis of two sub-clusters. A,C) the sub-clusters detected at low altitude; B,D) the sub-clusters detected at high altitude
cluster number (L(k)) since the lowest likelihood was for
K = 1, and L(k) either consistently increased or showed
an erratic pattern with increasing variance, with all individuals admixed and the proportion of any individual
assigned to each subpopulation remaining roughly similar. The Evanno criterion, ΔK [34], was not relevant as
it can only be computed for K ≥ 2 and does not enable
comparison of results from K = 1. For K > 2, the value
of ΔK remained close to 0 in this study.
Figure 6 Relevance between genetic distance and altitude.
The population structure and Mantel test results suggest
that the relationship between genetic diversity and altitude
is not significant, and hence it is possible to hypothesize
that the species has not had sufficient time for evolutionary differentiation to occur along an altitude gradient.
Low FST and strong gene flow
FST was low for all loci, except for SSR 18. There was
no noticeable differentiation among populations at three
Shen et al. BMC Genetics 2014, 15(Suppl 1):S11
/>
different altitudes. This may contribute to the local
geographic structure and strong gene flow among individuals. The STRUCTURE results showed that the medium-altitude group was an admixture of the low- and
high-altitude groups, clearly indicating that the mountain harbored two groups (clusters) of poplars, and that
they separated into these clusters at an altitude of
~2700 m. Because the study area altitude ranged from
2 000 to 4 000 m, and the Tibetan poplar is distributed
from 2000 to 3096 m, the tree line represented a limiting factor for tree distribution, but it appeared to have
had limited impact on gene exchange between individuals and did not hinder pollen or seed dispersal. In
this study, gene flow occurred among the populations.
Gene flow is a vital element in local adaptation studies,
because it can instruct the establishment of the local
genetic structure or influence it indirectly. Gene flow
among populations can also lead to combining of gene
pools, reducing genetic variation among groups [44].
Therefore, gene flow acts strongly against speciation in
evolutionary processes [45], by recombining the gene
pools of the groups. Gene flow plays a part in evolution
through pollen dispersal, seed dispersal, and the establishment of the individual adult. A geographic barrier
increases the probability of extinction or local adaptation
of a population, as it may push the population to evolve
into a different population with a unique genetic structure, or even into a new species [46,47]. However, gene
flow could also be a constraining force of natural evolution by homogenizing populations under a heterogeneous
environment, and balancing gene distribution and spread
[48]. However, gene flow can also be considered a creative force in evolution, where superior genes or combinations of genes are spread by gene flow [49,50]. For local
adaptation, gene flow and selection are usually considered as the main forces affecting the processes of establishment. This is especially true for high outcrossing
trees and perennial species, where there is extensive gene
flow [51]. In summary, the factors contributing to the
low level of differentiation among populations at different
altitudes include: (1) Pollen dispersal and an overlapping
flowering period of all three populations (high, medium
and low altitude). Generally the flowering phase of Populus is of long duration; for example, flowering in P. ×
canadensis and P. nigra [52] lasts for 15 and 31 days,
respectively. (2) Seed dispersal mechanisms. Most Populus trees live adjacent to rivers and roads, and some in
the river channel itself. Therefore, rivers cannot be
ignored as an important factor in seed dispersal. Poplar
populations are evolutionarily homogeneous. The germplasm and genetic diversity of the Tibetan poplar could
be protected by random selection in the future work,
which couldprovid all of the genetic diversity to date. An
Page 9 of 10
unpublished experiment comparing poplars at two sites
showed some differences in the growth rate, leaf characteristics, and branch numbers, etc. of individual clones
sampled at different altitudes, indicating that natural
selection conserved some fitness types. Genes linked to
adaptation mechanisms could contribute to phenotypic
variation without genetic structure differentiation which
has been proved in this study. Consequently, this makes
the population ideal for identifying functional genes and
mechanisms of adaptation to high altitudes.
Conclusion
To our knowledge, this is the first genetic analysis of the
Tibetan poplar. The results indicate that the Tibetan
poplar populations living at different altitudes on the
Sejila mountain have a low level of differentiation. They
have an excellent ability to adapt to different altitudes;
however, local adaptation is not observed due to the
lack of a geographic barrier. The high levels of gene
flow lead to a low FST, as was observed. We consider
the Sejila mountain population to be appropriate for
investigation of the mechanisms of adaptation to high
altitudes, despite the low level of genetic structure differentiation among populations at different altitudes.
Competing interests
The authors declare that they have no competing interests.
Authors’ contributions
Rongling Wu designed the study. Dengfeng Shen, Wenhao Bo and Fang Xu,
contributed extensively to the samples collection. Dengfeng Shen
performed PCR experiments and genetic diversity analysis. Dengfeng Shen
and Rongling Wu wrote the manuscript. Wenhao Bo and Fang Xu prepared
and revised the manuscript. All authors read and approved the final
manuscript.
Acknowledgements
The authors thank Dr. Fang Du for comments and for revision of the
manuscript.
Declarations
Publication charges for this article came from the Special Fund for Forest
Scientific Research in the Public Welfare (201404102), NSF/IOS-0923975,
Changjiang Scholars Award and “Thousand-person Plan” Award.
This article has been published as part of BMC Genetics Volume 15
Supplement 1, 2014: Selected articles from the International Symposium on
Quantitative Genetics and Genomics of Woody Plants. The full contents of
the supplement are available online at />bmcgenet/supplements/15/S1.
Published: 20 June 2014
References
1. Körner C: The use of ‘altitude’in ecological research. Trends in ecology &
evolution 2007, 22(11):569-574.
2. Pickup M, Barrett SC: The influence of demography and local mating
environment on sex ratios in a wind-pollinated dioecious plant. Ecology
and evolution 2013, 3(3):629-639.
3. Byars SG, Papst W, Hoffmann AA: Local adaptation and cogradient
selection in the alpine plant, Poa hiemata, along a narrow altitudinal
gradient. Evolution 2007, 61(12):2925-2941.
Shen et al. BMC Genetics 2014, 15(Suppl 1):S11
/>
4.
5.
6.
7.
8.
9.
10.
11.
12.
13.
14.
15.
16.
17.
18.
19.
20.
21.
22.
23.
24.
25.
26.
27.
28.
29.
Lesica P, Allendorf FW: When are peripheral populations valuable for
conservation? Conservation Biology 1995, 9(4):753-760.
Rainey PB, Travisano M: Adaptive radiation in a heterogeneous
environment. Nature 1998, 394(6688):69-72.
Ortego J, Riordan EC, Gugger PF, Sork VL: Influence of environmental
heterogeneity on genetic diversity and structure in an endemic
southern Californian oak. Molecular Ecology 2012, 21(13):3210-3223.
Mosca E, Eckert A, Di Pierro E, Rocchini D, La Porta N, Belletti P, Neale D:
The geographical and environmental determinants of genetic diversity
for four alpine conifers of the European Alps. Molecular ecology 2012,
21(22):5530-5545.
Avolio ML, Beaulieu JM, Smith MD: Genetic diversity of a dominant C4
grass is altered with increased precipitation variability. Oecologia 2013,
171(2):571-581.
Manel S, Gugerli F, Thuiller W, Alvarez N, Legendre P, Holderegger R,
Gielly L, Taberlet P: Broad-scale adaptive genetic variation in alpine
plants is driven by temperature and precipitation. Molecular Ecology 2012,
21(15):3729-3738.
Oyama K, Ito M, Yahara T, Ono M: Low genetic differentiation among
populations ofArabis serrata (Brassicaceae) along an altitudinal gradient.
Journal of plant research 1993, 106(2):143-148.
Taira H, Tsumura Y, Tomaru Y, Ohba K: Regeneration system and genetic
diversity of Cryptomeria japonica growing at different altitudes.
Canadian Journal of Forest Research 1997, 27(4):447-452.
Jump AS, Hunt JM, MARTÍNEZ-IZQUIERDO JA, Penuelas J: Natural selection
and climate change: temperature-linked spatial and temporal trends in
gene frequency in Fagus sylvatica. Molecular Ecology 2006, 15(11):3469-3480.
Mathiasen P, Premoli AC: Fine-scale genetic structure of Nothofagus
pumilio (lenga) at contrasting elevations of the altitudinal gradient.
Genetica 2013, 141(1-3):95-105.
Korshikov I, Mudrik E: Elevation-dependent genetic variation of plants
and seed embryos in the Crimea Mountain population of Pinus
pallasiana D. Don. Russian Journal of Ecology 2006, 37(2):79-83.
Zhang Y, Li B, Zheng D: A discussion on the boundary and area of the
Tibetan Plateau in China. Geographical Research 2002, 21(1):1-8.
Zheng D: The system of physico-geographical regions of the QinghaiTibet (Xizang) Plateau. Science in China (Series D) 1996, 39(4):410-417.
Qiu Y-X, Fu C-X, Comes HP: Plant molecular phylogeography in China
and adjacent regions: tracing the genetic imprints of Quaternary climate
and environmental change in the world’s most diverse temperate flora.
Molecular Phylogenetics and Evolution 2011, 59(1):225-244.
Chen S-l, Wu Z-y, Raven PH: Flora of China: Science Press; 1994.
TangYudan P, CidanZhuoga : Biological Characteristics of Populus
szechuanica var. tibetica theRareand Endemic Plant of Qinghai-Tibetan
Plateau in the Different Local Environment. Chinese Wild Plant Resources
2012, 31(2):24-32.
Xu F, Feng S, Wu R, Du FK: Two highly validated SSR multiplexes (8-plex)
for Euphrates’ poplar, Populus euphratica (Salicaceae). Molecular ecology
resources 2013, 13(1):144-153.
Doyle JJ: A rapid DNA isolation procedure for small quantities of fresh
leaf tissue. Phytochem Bull 1987, 19:11-15.
Amos W, Hoffman J, Frodsham A, Zhang L, Best S, Hill A: Automated
binning of microsatellite alleles: problems and solutions. Molecular
Ecology Notes 2007, 7(1):10-14.
Shaibi T, Lattorff H, Moritz R: A microsatellite DNA toolkit for studying
population structure in Apis mellifera. Molecular Ecology Resources 2008,
8(5):1034-1036.
Antao T, Lopes A, Lopes R, Beja-Pereira A, Luikart G: LOSITAN: a workbench
to detect molecular adaptation based on a Fst-outlier method. BMC
bioinformatics 2008, 9(1):323.
Beaumont MA: Adaptation and speciation: what can Fst tell us? Trends in
Ecology & Evolution 2005, 20(8):435-440.
Cockerham CC, Weir B: Covariances of relatives stemming from a
population undergoing mixed self and random mating. Biometrics 1984,
40(1):157-164.
Nei M: Analysis of gene diversity in subdivided populations. Proceedings
of the National Academy of Sciences 1973, 70(12):3321-3323.
Nei M: Molecular evolutionary genetics Columbia University Press; 1987.
Yeh FC, Yang R, Boyle T, Ye Z, Mao JX: POPGENE, version 1.32: the user
friendly software for population genetic analysis. Molecular Biology and
Biotechnology Centre University of Alberta, Edmonton, AB, Canada; 1999.
Page 10 of 10
30. Peakall R, Smouse PE: GENALEX 6: genetic analysis in Excel. Population
genetic software for teaching and research. Molecular Ecology Notes 2006,
6(1):288-295.
31. Pritchard JK, Donnelly P: Case-control studies of association in structured
or admixed populations. Theoretical population biology 2001, 60(3):227-237.
32. Hubisz MJ, Falush D, Stephens M, Pritchard JK: Inferring weak population
structure with the assistance of sample group information. Molecular
ecology resources 2009, 9(5):1322-1332.
33. Pritchard JK, Stephens M, Donnelly P: Inference of population structure
using multilocus genotype data. Genetics 2000, 155(2):945-959.
34. Evanno G, Regnaut S, Goudet J: Detecting the number of clusters of
individuals using the software STRUCTURE: a simulation study. Molecular
ecology 2005, 14(8):2611-2620.
35. Johnson M, Zaretskaya I, Raytselis Y, Merezhuk Y, McGinnis S, Madden TL: NCBI
BLAST: a better web interface. Nucleic acids research 2008, 36(suppl 2):W5-W9.
36. Ellegren H: Microsatellites: simple sequences with complex evolution.
Nature Reviews Genetics 2004, 5(6):435-445.
37. Schmidt AL, Mitter V: Microsatellite mutation directed by an external
stimulus. Mutation Research/Fundamental and Molecular Mechanisms of
Mutagenesis 2004, 568(2):233-243.
38. Li Y-C, Korol AB, Fahima T, Nevo E: Microsatellites within genes: structure,
function, and evolution. Molecular biology and evolution 2004, 21(6):991-1007.
39. Ganopoulos I, Aravanopoulos F, Argiriou A, Tsaftaris A: Genome and
population dynamics under selection and neutrality: an example of Sallele diversity in wild cherry (Prunus avium L.). Tree Genetics & Genomes
2012, 8(6):1181-1190.
40. Garcia-Lor A, Curk F, Snoussi-Trifa H, Morillon R, Ancillo G, Luro F, Navarro L,
Ollitrault P: A nuclear phylogenetic analysis: SNPs, indels and SSRs
deliver new insights into the relationships in the ‘true citrus fruit trees’
group (Citrinae, Rutaceae) and the origin of cultivated species. Annals of
botany 2013, 111(1):1-19.
41. Nas MN, Bolek Y, Bardak A: Genetic diversity and phylogenetic relationships
of Prunus microcarpa CA Mey. subsp. tortusa analyzed by simple sequence
repeats (SSRs). Scientia Horticulturae 2011, 127(3):220-227.
42. Slavov GT, Zhelev P: Salient biological features, systematics, and genetic
variation of Populus. Genetics and Genomics of Populus. Springer; 2010, 15-38.
43. Cole CT: Allelic and population variation of microsatellite loci in aspen
(Populus tremuloides). New Phytologist 2005, 167(1):155-164.
44. Slatkin M: Gene flow in natural populations. Annual review of ecology and
systematics 1985, 16:393-430.
45. Kronforst MR: Gene flow persists millions of years after speciation in
Heliconius butterflies. BMC evolutionary biology 2008, 8(1):98.
46. Vermeij GJ: The dispersal barrier in the tropical Pacific: implications for
molluscan speciation and extinction. Evolution 1987, 1046-1058.
47. Barnes I, Matheus P, Shapiro B, Jensen D, Cooper A: Dynamics of
Pleistocene population extinctions in Beringian brown bears. Science
2002, 295(5563):2267-2270.
48. Storfer A, Sih A: Gene flow and ineffective antipredator behavior in a
stream-breeding salamander. Evolution 1998, 52(2):558-565.
49. Hendry AP, Taylor EB, McPhail JD: Adaptive divergence and the balance
between selection and gene flow: lake and stream stickleback in the
Misty system. Evolution 2002, 56(6):1199-1216.
50. Olson-Manning CF, Wagner MR, Mitchell-Olds T: Adaptive evolution:
evaluating empirical support for theoretical predictions. Nature Reviews
Genetics 2012, 13(12):867-877.
51. Muona O, Brown A, Clegg M, Kahler A, Weir B: Population genetics in
forest tree improvement. Plant population genetics, breeding, and genetic
resources 1990, 282-298.
52. Broeck AV, Cox K, Quataert P, Van Bockstaele E, Van Slycken J: Flowering
Phenology of Populus nigra L., P. nigra cv. italica and P. × canadensis
Moench. and the Potential for Natural Hybridisation in Belgium. Silvae
genetica 2003, 52(5/6):280-283.
doi:10.1186/1471-2156-15-S1-S11
Cite this article as: Shen et al.: Genetic diversity and population
structure of the Tibetan poplar (Populus szechuanica var. tibetica) along
an altitude gradient. BMC Genetics 2014 15(Suppl 1):S11.