Next generation haplotyping to decipher nuclear genomic interspecific admixture in Citrus species: Analysis of chromosome 2
Bạn đang xem bản rút gọn của tài liệu. Xem và tải ngay bản đầy đủ của tài liệu tại đây (2.01 MB, 19 trang )
Curk et al. BMC Genetics (2014) 15:152
DOI 10.1186/s12863-014-0152-1
RESEARCH ARTICLE
Open Access
Next generation haplotyping to decipher nuclear
genomic interspecific admixture in Citrus species:
analysis of chromosome 2
Franck Curk1,2, Gema Ancillo2, Andres Garcia-Lor2, Franỗois Luro1, Xavier Perrier3, Jean-Pierre Jacquemoud-Collet3,
Luis Navarro2* and Patrick Ollitrault2,3*
Abstract
Background: The most economically important Citrus species originated by natural interspecific hybridization
between four ancestral taxa (Citrus reticulata, Citrus maxima, Citrus medica, and Citrus micrantha) and from limited
subsequent interspecific recombination as a result of apomixis and vegetative propagation. Such reticulate
evolution coupled with vegetative propagation results in mosaic genomes with large chromosome fragments from
the basic taxa in frequent interspecific heterozygosity. Modern breeding of these species is hampered by their
complex heterozygous genomic structures that determine species phenotype and are broken by sexual
hybridisation. Nevertheless, a large amount of diversity is present in the citrus gene pool, and breeding to allow
inclusion of desirable traits is of paramount importance. However, the efficient mobilization of citrus biodiversity in
innovative breeding schemes requires previous understanding of Citrus origins and genomic structures.
Haplotyping of multiple gene fragments along the whole genome is a powerful approach to reveal the admixture
genomic structure of current species and to resolve the evolutionary history of the gene pools. In this study, the
efficiency of parallel sequencing with 454 methodology to decipher the hybrid structure of modern citrus species
was assessed by analysis of 16 gene fragments on chromosome 2.
Results: 454 amplicon libraries were established using the Fluidigm array system for 48 genotypes and 16 gene
fragments from chromosome 2. Haplotypes were established from the reads of each accession and phylogenetic
analyses were performed using the haplotypic data for each gene fragment. The length of 454 reads and the level
of differentiation between the ancestral taxa of modern citrus allowed efficient haplotype phylogenetic assignations
for 12 of the 16 gene fragments. The analysis of the mixed genomic structure of modern species and cultivars (i)
revealed C. maxima introgressions in modern mandarins, (ii) was consistent with previous hypotheses regarding the
origin of secondary species, and (iii) provided a new picture of the evolution of chromosome 2.
Conclusions: 454 sequencing was an efficient strategy to establish haplotypes with significant phylogenetic
assignations in Citrus, providing a new picture of the mixed structure on chromosome 2 in 48 citrus genotypes.
Keywords: Phylogeny, Haplotype, Evolution, SNP, NGS, Genome admixture
* Correspondence: ;
†
Equal contributors
2
Centro de Protección Vegetal y Biotecnología, Instituto Valenciano de
Investigaciones Agrarias (IVIA), 46113 Moncada, Valencia, Spain
3
UMR AGAP, Centre de coopération Internationale en Recherche
Agronomique pour le Développement (CIRAD), TA A-108/02, 34398
Montpellier, Cedex 5, France
Full list of author information is available at the end of the article
© 2014 Curk et al.; licensee BioMed Central. This is an Open Access article distributed under the terms of the Creative
Commons Attribution License ( which permits unrestricted use, distribution, and
reproduction in any medium, provided the original work is properly credited. The Creative Commons Public Domain
Dedication waiver ( applies to the data made available in this article,
unless otherwise stated.
Curk et al. BMC Genetics (2014) 15:152
Background
World-wide production of citrus was 131 million tonnes
in 2011 and 2012 [1]. The main citrus varietal groups
are sweet oranges (52%), small citrus (21%), limes and
lemons (12%), and grapefruits and pummelos (6%). The
inter-varietal genetic diversity of most of these varietal
groups is very scarce, particularly for sweet oranges,
lemons, and grapefruits, where intra-group diversity results
from clonal variation/selection in vegetatively propagated
material [2]. This confers a substantial fragility of these
groups against emerging diseases, as demonstrated by the
ongoing major crisis in the Brazilian and Floridian citrus
industries [3-5]. Moreover, conventional breeding of these
species is hampered by their complex heterozygous
genomic structures that determine species phenotype
and are broken by sexual hybridisation. Therefore,
most breeding efforts for sweet orange, grapefruit,
and lemons to date have used natural or induced mutations and somaclonal variation [6]. However, important
natural phenotypically useful variability exists in the
citrus gene pool particularly for resistance to biotic and
abiotic constraints [7]. The efficient mobilization of
this biodiversity in innovative breeding schemes will
require prior knowledge of varietal group origins and genomic structures.
The taxonomy of Citrus remains controversial due to
the conjunction of broad morphological diversity, total
interspecific sexual compatibility within the genus, and
partial apomixis of many cultivars. Fixing complex
genetic structures through seedling propagation via apomixis led some taxonomists to consider clonal families of
interspecific origin as new species [8]. Two major systems
are widely used to classify Citrus species: the Swingle and
Reece [9] classification, which identifies 16 species, and
the Tanaka [10] classification, which recognizes 156 species. More recently, Mabberley [11] proposed a new
classification of edible citrus that recognized three
species and four hybrid groups. In this paper, we will
use the Swingle and Reece [9] classification system.
This taxonomic system is widely used in the citrus
scientific community and, as mentioned below, mostly
agrees with molecular data. Despite the difficulties involved in establishing a consensus classification system for edible citrus, most authors now agree on the
origins of the main cultivated forms. Molecular analyses
clarified the genetic underpinnings of various cultivated
species of Citrus [12-18]. Four ancestral taxa [C. medica L.
(citron), C. reticulata Blanco (mandarin), C. maxima
(Burm.) Merr. (pummelo), and C. micrantha Wester
(papeda)] were identified as the ancestors of all cultivated
Citrus [13,15]. Differentiation between these sexually
compatible taxa may be explained by foundation effects in three distinct geographic zones and by an initial
allopatric evolution. C. maxima originated in the Malay
Page 2 of 19
Archipelago and Indonesia, C. medica evolved in northeastern India and the nearby region of Myanmar and
China, and C. reticulata diversification occurred over a region including Vietnam, southern China, and Japan [8,19].
Secondary species [C. sinensis (L.) Osb. (sweet orange),
C. aurantium L. (sour orange), C. paradisi Macf. (grapefruit), C. limon (L.) Burm. (lemon), and C. aurantifolia
(Christm.) Swing. (lime)] arose from hybridizations between the four basic taxa [13,15]. Partial apomixis of
most of the secondary species has been an essential
element in the limitation of the number of further interspecific meiosis. Moreover, studies considering diversity
of morphological characteristics [20,21], primary metabolites [22], and secondary metabolites [23] confirmed that a
major part of the phenotypic diversity of edible citrus resulted from differentiation between the basic taxa. In this
context, deciphering the phylogenomic structures of the
secondary citrus species is essential before innovative
conventional breeding strategies can be developed.
Reticulations pose serious challenges in phylogenetic
analyses and result in evolutionary histories that cannot
be adequately represented in the form of phylogenetic
trees [24-28]. For many species, these relationships
resemble a network with phylogenetic incongruities
observed not only between cytoplasmic and nuclear
genomes, but also between different regions of nuclear
genomes [29-32]. In plants such as citrus, where vegetative
propagation such as apomixis took place immediately or a
few generations after a reticulation event, large parts
of the genome remain in interspecific heterozygosity.
Genome-wide molecular analyses are, therefore, needed to
decipher the complex interspecific mosaic genomes
resulting from such evolution. Studies based on linkage
disequilibrium can provide good evidence for recent and
ancient hybridization events. This was demonstrated in
sunflower by Rieseberg et al. [33,34], who showed
that the genomes of hybrid sunflower species contained
chromosomal segments from both parental species. When
examining heterozygous structures like citrus genotypes,
phased multilocus studies offer improvements over
monolocus analysis for the identification of interspecific
heterozygous genome fragments deriving from reticulate
events. The expectation is that tightly linked markers in a
hybrid species are significantly more likely to come from
the same parent and, therefore, to display linkage disequilibrium [29]. Sanger sequencing after bacterial cloning to
separate gene copies was used effectively for such analysis
[35-37]. However, because this is time-consuming and
expensive, and only a few individuals and genes can be
investigated, this type of analysis can miss intraspecific diversity components and may lead to erroneous
conclusions about the evolutionary history of related
taxa [38]. In recent years, massively parallel sequencing of barcoded DNA mixtures enabled rapid and
Curk et al. BMC Genetics (2014) 15:152
Page 3 of 19
relatively inexpensive DNA sequence data production
and facilitated genome-wide sequence variant discovery.
This analysis was applied to a wide variety of bacteria,
fungi [39,40], multi-copy genes [41], and polyploids. In
citrus, recent whole genome sequencing projects [42,43]
confirmed hybridization at the origin of C. sinensis and C.
clementina (clementine) and allowed the phylogenetic
origin of DNA fragments in the whole genome to be determined. However, the genomic structure of other secondary
species and most modern varieties remain to be studied,
and no analysis of the phylogeny of DNA fragments from
the whole genome has yet been undertaken.
Whole genome sequencing (WGS) in large populations
remains costly and requires considerable bioinformatic
analysis. Major challenges include the need to reduce
genome complexity and manage orthologous sequence
data for a large number of individuals. Alternatives
such as targeted capture [44] or targeted amplicon [45] sequencing can be valuable. In human research, deep amplicon sequencing using 454 technology yielded thousands
of haplotype calls per amplicon at the beta-defensin locus,
and this was considered to be an efficient method for
haplotyping and copy-number estimation in small to
medium-sized cohorts [41]. A particular advantage of
using such an approach for haplotyping heterozygous
structures is that sequencing data come from single DNA
molecules, and there is no requirement for cloning.
Therefore, we hypothesize that, by using a sequencing
method allowing enough long reads (over 500 bp) such as
454 pyrosequencing [41], it should be possible to establish
multilocus haplotypes that are phylogenetically significant
when working at a sufficient level of genetic differentiation
between taxa.
The objective of this work was to analyze the potential
of the 454 sequencing method for efficient targeted
parallel haplotyping to decipher complex interspecific
genomic structures resulting from reticulate evolution
in citrus. Amplicons from 48 genotypes, representative of
Citrus ancestral taxa and secondary species, were subjected
to parallel sequencing. Sixteen targeted genes distributed
across chromosome 2 were sequenced. Chromosome 2 was
selected due to its complex admixture structure in sweet
orange, as identified in our previous research [16,43].
Methods
Plant material
Leaves from 48 accessions of the Citrus genus and one
accession of Severinia buxifolia [Poir.] Tenore were
collected from the IVIA Citrus Germplasm Bank of
pathogen-free plants (Valencia, Spain; accessions with
IVIA identification number) and the INRA/CIRAD Citrus
collection of San Giuliano (Corsica, France; accessions
with SRA identification number) [Additional file 1]. In
addition, in silico data were mined (phytozome.net [46])
from the haploid clementine used to establish the first
high-quality reference sequence of Citrus [43].
The Swingle and Reece [9] botanical classification for scientific names was adopted (Table 1 and [Additional file 1]).
The four ancestral taxa of the Citrus genus were represented by 31 accessions: 14 mandarins (12 C. reticulata and
two C. tachibana (Mak.) Tan.), ten pummelos (C. maxima),
six citrons (C. medica), and one papeda (C. micrantha).
Representatives of secondary citrus species or genotypes
included two diploid clementines (C. reticulata), the
haploid clementine used to establish the whole citrus
genome reference sequence (C. reticulata), three sweet
Table 1 Scientific names and number of accessions per common horticultural group
Ancestral groups
Secondary species or genotypes arising from
hybridizations between ancestral groups
Out-group
Common horticultural
group name
Swingle scientific name
Number of
accessions
Pummelo
Citrus maxima (Burm.) Merr.
10
Mandarin
Citrus reticulata Blanco
12
Citrus tachibana (Mak.) Tan.
2
Citron
Citrus medica L.
6
Papeda
Citrus micrantha Wester
1
Bergamot
Citrus aurantifolia (Christm.) Swing.
1
Lime
Citrus aurantifolia (Christm.) Swing.
1
Alemow
Citrus aurantifolia (Christm.) Swing.
1
Sour orange
Citrus aurantium L.
2
Lemon
Citrus limon (L.) Burm.
5
Grapefruit
Citrus paradisi Macf.
2
Clementine
Citrus reticulata Blanco
3
Sweet orange
Citrus sinensis (L.) Osb.
3
Severinia buxifolia (Poir.) Ten.
1
Curk et al. BMC Genetics (2014) 15:152
oranges (C. sinensis), two sour oranges (C. aurantium),
two grapefruits (C. paradisi), five lemons (C. limon), one
bergamot (C. aurantifolia), one lime (C. aurantifolia), and
one ‘Alemow’ (C. aurantifolia). These 18 genotypes were
putative hybrids derived from the four ancestral taxa. One
Citrus genus relative (Severinia buxifolia) was added as an
out-group.
DNA extraction
High molecular weight genomic DNA was extracted
from leaf samples using the DNeasy Plant Mini Kit
(Qiagen S.A.; Madrid, Spain) according to the manufacturer’s instructions.
Target genomic fragment selection
Chromosome 2 targeted genomic fragments
The reference citrus whole genome sequence, released
in Phytozome [46] by the International Citrus Genome
Consortium (ICGC), was used to select gene fragments
in this study. The annotated genes file (“Cclementina_
182_gene.gff3” file) was used and is available at the Phytozome web page [46].
Duplicated and overlapping genes were discarded. SSRs
were annotated (up to tetranucleotidic motifs and at
least 11 bp sequences) and all genes presenting microsatellite motifs were eliminated. Finally, the genes were
sorted by length, and 415 genes were selected, each with a
length of 1000–2000 bp. This length was selected to facilitate the design of primers for efficient sequencing of
500–600 bp amplicons. Sixteen genes within chromosome
2 were chosen.
Page 4 of 19
454 parallel sequencing was performed using a mixture
of all the amplicons for all the genotypes. DNA from each
genotype carried a different MID, as defined by Roche
[49]. The 454 sequencing technique requires amplicon
primers to contain a directional GS FLX Titanium primer
sequence (which includes a four base library “key” sequence) at the 5′ end of the oligonucleotide in addition to
the gene-specific sequence at the 3′ end. To allow for automated software identification of samples after pooling
and sequencing, MID sequences [Additional file 3] were
added between primer A (or B) and the gene-specific
sequences [50].
Forty-eight DNA samples were amplified and parallelsequenced on a GS FLX Titanium system (Roche 454).
Haploid clementine gene fragment sequences were
obtained from the reference citrus whole genome sequence
(Phytozome [46]). S. buxifolia (out-group) gene fragments
were obtained by PCR amplification performed using a
Mastercycler Ep gradient S thermocycler (Eppendorf). PCR
was conducted in a final volume of 25 μl containing 0.027
U Taq DNA polymerase (Fermentas), 1 ng/μl of genomic
DNA, 10 × PCR buffer (Fermentas), 0.2 mM of each dNTP,
1.5 mM MgSO4, and 0.2 μM of each primer. The following
PCR program was applied: denaturation at 94°C for 5 min;
40 cycles of 30 s at 94°C, 1 min at 55°C, and 2 min at 72°C;
and a final elongation step of 4 min at 72°C. PCR
product purification was performed using a QIAquick
PCR purification kit (Qiagen S.A.). Amplicons were
sequenced using the Sanger method from the 5′ end
using fluorescently labeled dideoxynucleotides (Big Dye
Terminator Cycle Sequencing Kit v3.1).
Sequencing and sequence data analysis for SNP calling
Amplicon library preparation
For the 16 selected gene fragments of chromosome 2
[Additional file 2], 16 primer pairs were designed
(according to the Access Array™ System for 454
Sequencing Platform User Guide [47]) and loaded on the
Fluidigm Access Array. This method employed the same
approach as the two-step PCR methods proposed by
Bybee et al. [45] and validated by Curk et al. [48] for
citrus. Two successive PCR reactions produced amplicons
with specific multiplex identifiers (MIDs) and directional
titanium primer sequences for each variety. PCR products
were generated using a 48.48 Access Array IFC (Fluidigm
48.770 Digital PCR Workflow Quick Reference Card),
and amplicon quality was checked using an Agilent
2100 Bioanalyzer (Agilent DNA 1000 Kit Guide). Next,
equal volumes of the PCR products were pooled together
to create one PCR product library. The PCR product
library was purified using AMPure beads. After purification, the PCR product library was quantified using
Quant-iT PicoGreen fluorimetry (Quant-iT™ PicoGreen®
User Guide) before proceeding to emulsion PCR.
Raw reads obtained from 454 pyrosequencing were preprocessed by removal of low-quality reads and adapter/primer
sequences using PRINSEQ [51]. Short reads (<150 bases)
with primer dimers were considered to be low-quality
reads. Remaining reads were automatically identified and
sorted by MID and specific gene primers using the SFF
Tool commands of Newbler software [52].
For each variety, 454 pyrosequencing reads were aligned
independently for each gene using SeqMan NGen software
version 7.0 [53] with the following assembly parameters:
match size, 12; minimum match percentage, 80; and
minimum sequence length, 150. For each gene fragment,
consensus alignments from a homozygous sequence
comprised one haplotype, while those from a heterozygous
sequence comprised two haplotypes.
Genetic analysis of SNP data
Unbiased expected heterozygosity (He), observed heterozygosity (Ho), fixation index values (FW [54]), and FStat
parameters (FST and GST Index) were calculated using
GENETIX v. 4.03 software [55]. SNP number and location
Curk et al. BMC Genetics (2014) 15:152
were identified with SNiPlay online software [56,57].
Principal component analysis (PCA) was performed
using XLSTAT software.
Haplotype and genotypic phylogenetic relationships
were studied by (i) neighbor-joining analysis (NJA), based
on the SNP data using DARwin software [58] with a
simple matching dissimilarity index, (ii) maximum likelihood phylogenetic analysis using Mega software [59]. The
simple matching dissimilarity index was also used to infer
intra- and inter-taxa average differentiation.
Graphical visualization of chromosome 2 genotypes
was constructed using GGT2 software [60].
Population structure was inferred using Structure
(version 2.3.4) software [61], which implements a modelbased clustering method using genotype data [62,63]. No a
priori population structure was defined. The linkage model
option was used, with allele frequencies correlated and
compute probability of the data for estimating K. Analyses
were made with K-values (number of subpopulations) of
1–10. The statistics used to select the correct K-value were
those used by Evanno et al. [64]. Ten runs using Structure
software were performed, each with 50,000 steps of burning followed by 50,000 Monte Carlo Markov Chain
(MCMC) repetitions using the linkage model, knowing
Map distances between loci [Additional file 2] [17]. The
independent Structure-run cluster outputs were permuted
and aligned to match one another as closely as possible.
Results
Page 5 of 19
using 454 software tools. All reads were attributed to one of
the 768 (48 × 16) amplicons according to the fragment gene
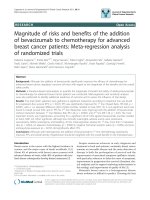
sequence. The average number of reads per amplicon was
75; however, the distribution of reads per amplicon
(Figure 1) was asymmetric, resulting in a high proportion of amplicons with insufficient coverage. Based on
454 single-read sequencing data error rates and our
preliminary unpublished data, we defined a threshold
level of 50 reads per amplicon for confident genotype
calling. However, 305 amplicons (40%) had fewer than
this initial threshold number. Detailed analysis of read
distribution for each amplicon [Additional file 4] showed
that much of the heterogeneity was due to global
under-representation of three gene fragments and overrepresentation of five fragments. The total number of
reads per variety was less heterogeneous than one per
gene fragment. We therefore conducted a second round
of Fluidigm/454 sequencing. A total of 159,490 useful
reads was obtained (average 208 reads per amplicon) from
the combination of the two runs [Additional file 5].
The distribution of the number of reads per amplicon
remained highly heterogeneous, and 135 amplicons (18%
of the total gene fragments/varieties) still had fewer than
50 associated reads. In cases where number or quality of
reads was insufficient for genotype calling, amplicons were
Sanger sequenced to complete the genotypic data set.
Sanger sequence analysis also allowed inference of haplotype if only one or no heterozygous loci were observed in
the Sanger sequence [Additional file 5].
Read distribution
The first round of Fluidigm amplification/454 sequencing
produced 64,170 reads. Of these, 11% were short reads with
primer dimers, and 57,394 reads were therefore considered
useful. Useful reads were classified according to their MID
and titanium sequences, and MID sequences were removed
Genotype calling and polymorphism of gene fragments
A total of 318 SNPs were identified from 7895 bp readable
sequences for the 16 gene fragments within the 48 Citrus
accessions (Table 2). The web based SNiPlay tool [56,57]
was used to analyze the intragenic location and potential
Figure 1 Distribution of the numbers of reads per amplicon for two rounds of Fluidigm/454 sequencing.
Curk et al. BMC Genetics (2014) 15:152
Page 6 of 19
For genotypic based analyses, we refer to the modern
varietal groups, while we focus on pure ancestral taxa
for the haplotype phylogenetic analyses.
Only 19 of the 318 SNPs were not found in the accessions representing the four basic taxa. These rare alleles
were identified in heterozygosity in secondary species
(‘Alemow’, nine; sour oranges, four; bergamot, three,
‘Volkamer’ lemon, one; ‘Mexican’ lime, one; and grapefruit,
one) and concerned 9 of the 16 gene fragments. The
parameters of SNP genetic diversity given in Table 3
(and detailed in [Additional file 6] for each SNP position)
were calculated without these 19 rare alleles. The whole
population displayed a diversity index (He) of 0.23 and a
fixation index (FW) value of 0.29, suggesting an important
population genetic structure of the analysed varietal
sample. Mandarin and pummelo intra-diversity FW values
were close to zero, but intra-group polymorphism was
higher in mandarin (He = 0.12 ± 0.02) than in pummelo
(He = 0.07 ± 0.02). Citron displayed low heterozygosity
(Ho = 0.02 ± 0.01) and diversity (He = 0.03 ± 0.01). Only
one C. micrantha representative was available: the
observed heterozygosity value (0.09; ± 0.09) was, therefore,
calculated between the pummelo and mandarin values.
The average numbers of SNPs/kb between two varieties
within and between the four supposed basic taxa were
1.26–3.93 SNPs/kb within groups and 10.41–14.56
SNPs/kb at the inter-group level (Table 4).
For secondary species, no intraspecific polymorphism
was observed for sweet oranges, grapefruits, and sour
impact of the different SNPs according to the whole
genome annotation available at phytozome.net. The
vast majority (98%) of the SNP loci was diallelic, but 2%
(seven loci) were triallelic (Table 2). The tri-allelism was
validated by Sanger sequencing (data not shown). Sanger
sequencing of the 2P33506778 fragment was performed
for 32 Citrus varieties to estimate the 454 SNP-calling
error rate. Only three differences between 454 and Sanger
data were observed over 17,152 bp genotyping data
(32 genotypes per 536 bp fragment; 0.02% error rate).
The ‘Clemenules’ clementine was homozygous according
to Sanger sequencing, but had two heterozygotic SNPs
according to the 454 sequencing data. The ‘Beauty’
mandarin was shown to be heterozygous with the two
techniques, but one of the three heterozygotic 454 SNPs
was not identified in the Sanger data. The average SNP
frequencies in intronic, exonic and 3′ UTR regions were
53.57, 38.77, and 39.77 SNPs/kb, respectively. In addition,
five indels were found in exonic regions (fragments
2P8108334, 2P26819388, and 2P32507721 contained one
indel, and 2P29538734 contained two).
SNP diversity differentiation
Previous molecular studies [14,16,43] showed that some
varieties of the main Citrus cultivar groups had interspecific introgressions. Therefore, in this study, we differentiated mandarin, pummelo, and citron groups of their
respective pure ancestral taxa: C. reticulata, C. maxima,
and C. medica.
Table 2 SNP number and location for 16 gene fragments sequenced in 48 diploid Citrus genotypes
Gene
fragment
Total Sequence
Seq size
SNP
SNP/kb
Trialelic SNP
Intron
Seq size
SNP
SNP/kb
Seq size
SNP
SNP/kb
Seq size
SNP
SNP/kb
2P737170
452
22
48.67
Exon
0
0
-
452
22
48.67
0
0
-
2P3068140
421
14
33.25
_
337
12
35.61
84
2
23.81
0
0
-
2P4517048
502
12
23.90
_
0
0
-
316
4
12.66
186
8
43.01
2P8108334
502
40
79.68
Exon
0
0
-
502
40
79.68
0
0
-
2P11442721
547
21
38.39
Exon
0
0
-
547
21
38.39
0
0
-
2P13928427
502
21
41.83
_
0
0
-
336
15
44.64
166
6
36.14
2P21022460
538
11
20.45
_
0
0
-
538
11
20.45
0
0
-
2P25198627
454
12
26.43
_
128
7
54.69
326
5
15.34
0
0
-
2P26819388
535
22
41.12
Exon
0
0
-
535
22
41.12
0
0
-
2P29538734
541
36
66.54
Exon
190
12
63.16
351
24
68.38
0
0
-
2P30446231
475
28
58.95
_
216
15
69.44
259
13
50.19
0
0
-
2P32507721
463
16
34.56
_
0
0
-
463
16
34.56
0
0
-
2P33532337
459
9
19.61
_
0
0
-
459
9
19.61
0
0
-
2P33506778
536
6
11.19
Exon
0
0
-
536
6
11.19
0
0
-
2P35391362
449
19
42.32
_
108
6
55.56
341
13
38.12
0
0
-
Exon
2P36235952
519
29
55.88
16
7895
318
40.28
Exon
3′-UTR
141
8
56.74
378
21
55.56
0
0
-
1120
60
53.57
6423
244
37.99
352
14
39.77
Curk et al. BMC Genetics (2014) 15:152
Page 7 of 19
Table 3 SNP genetic diversity within and between supposed ancestral varietal groups
Whole population
Citrons
Citrus micrantha
Pummelos
Ho
He
FW
Ho
He
FW
Mandarins
Ho
He
FW
Ho
He
FW
Ho
He
FW
4 populations
FST
2P737170
0.11
0.23
0.52
0.02
0.03
0.33
0.01
0.01
−0.04
0.15
0.08
−1.00
0.08
0.07
−0.22
0.78
SD
0.07
0.15
0.25
0.02
0.11
0.00
0.03
0.02
0.00
0.36
0.18
0.00
0.04
0.15
0.08
0.33
CI
0.03
0.07
0.11
0.02
0.05
-
0.01
0.01
-
0.16
0.08
-
0.02
0.07
0.08
0.14
2P3068140
0.18
0.33
0.46
0.00
0.00
-
0.07
0.10
−0.01
0.00
0.00
-
0.02
0.02
−0.18
0.72
SD
0.08
0.17
0.22
0.00
0.00
-
0.12
0.10
0.13
0.00
0.00
-
0.04
0.07
-
0.40
CI
0.05
0.09
0.12
-
-
-
0.06
0.05
0.07
-
-
-
0.02
0.04
-
0.22
2P4517048
0.09
0.19
0.55
0.01
0.01
−0.09
0.10
0.08
−0.17
0.00
0.00
-
0.06
0.05
−0.14
0.48
SD
0.07
0.19
0.33
0.03
0.04
-
0.07
0.18
0.22
0.00
0.00
-
0.08
0.09
0.04
0.47
CI
0.04
0.11
0.19
0.02
0.02
-
0.04
0.10
0.25
-
-
-
0.05
0.05
0.04
0.27
2P8108334
0.12
0.20
0.42
0.01
0.04
0.80
0.04
0.06
0.38
0.21
0.10
−1.00
0.14
0.09
−0.52
0.52
SD
0.09
0.18
0.36
0.01
0.10
0.49
0.05
0.14
0.28
0.41
0.20
0.00
0.06
0.17
0.33
0.36
CI
0.03
0.06
0.11
0.01
0.03
0.39
0.03
0.04
0.18
0.13
0.06
-
0.04
0.05
0.20
0.11
2P11442721
0.15
0.18
0.18
0.02
0.02
−0.09
0.23
0.20
−0.19
0.00
0.00
-
0.06
0.06
0.04
0.32
SD
0.11
0.13
0.26
0.05
0.05
0.00
0.09
0.20
0.16
0.00
0.00
-
0.06
0.12
0.32
0.35
CI
0.05
0.05
0.11
0.04
0.02
0.00
0.05
0.08
0.09
-
-
-
0.04
0.05
0.28
0.15
2P13928427
0.11
0.17
0.38
0.04
0.05
0.17
0.06
0.05
−0.11
0.10
0.05
−1.00
0.01
0.01
−0.05
0.40
SD
0.08
0.16
0.23
0.04
0.15
0.00
0.11
0.08
0.05
0.30
0.15
0.00
0.03
0.03
0.00
0.38
CI
0.04
0.07
0.10
0.04
0.06
-
0.06
0.04
0.04
0.13
0.07
-
0.02
0.01
-
0.16
2P21022460
0.12
0.19
0.34
0.00
0.04
1.00
0.05
0.06
0.11
0.18
0.09
−1.00
0.10
0.07
−0.50
0.49
SD
0.08
0.13
0.28
0.00
0.13
-
0.07
0.13
0.11
0.39
0.20
0.00
0.03
0.16
0.35
0.41
CI
0.05
0.08
0.16
-
0.08
-
0.03
0.08
0.11
0.23
0.12
-
0.02
0.09
0.48
0.24
2P25198627
0.17
0.21
0.20
0.08
0.10
0.16
0.10
0.13
0.23
0.17
0.08
−1.00
0.20
0.15
−0.38
0.34
SD
0.14
0.16
0.20
0.08
0.18
0.61
0.14
0.18
0.22
0.37
0.19
0.00
0.10
0.22
0.05
0.33
CI
0.08
0.09
0.12
0.06
0.10
0.69
0.07
0.10
0.15
0.21
0.11
-
0.06
0.12
0.05
0.19
2P26819388
0.09
0.16
0.46
0.07
0.05
−0.33
0.08
0.13
0.45
0.32
0.17
−1.00
0.02
0.02
−0.33
0.25
SD
0.10
0.17
0.30
0.06
0.13
0.00
0.10
0.19
0.36
0.47
0.24
0.00
0.02
0.08
-
0.18
CI
0.04
0.07
0.12
0.05
0.05
-
0.07
0.08
0.21
0.19
0.10
-
0.01
0.03
-
0.07
2P29538734
0.17
0.26
0.34
0.00
0.03
1.00
0.19
0.16
−0.18
0.06
0.03
−1.00
0.05
0.05
−0.07
0.53
SD
0.11
0.16
0.28
0.00
0.09
0.00
0.16
0.17
0.09
0.23
0.11
0.00
0.06
0.10
0.37
0.39
CI
0.04
0.05
0.09
-
0.03
-
0.08
0.05
0.04
0.08
0.04
-
0.04
0.03
0.23
0.13
2P30446231
0.12
0.20
0.37
0.02
0.04
0.56
0.10
0.11
0.07
0.08
0.04
−1.00
0.10
0.16
0.39
0.47
SD
0.09
0.14
0.28
0.04
0.12
0.00
0.12
0.17
0.11
0.27
0.14
0.00
0.07
0.20
0.44
0.37
CI
0.03
0.05
0.11
0.03
0.05
-
0.06
0.07
0.07
0.10
0.05
-
0.05
0.08
0.26
0.14
2P32507721
0.14
0.21
0.31
0.00
0.00
-
0.29
0.31
0.06
0.18
0.08
−1.00
0.07
0.04
−0.60
0.43
SD
0.10
0.14
0.18
0.00
0.00
-
0.25
0.24
0.05
0.39
0.19
0
0.04
0.14
-
0.32
CI
0.06
0.08
0.10
-
-
-
0.13
0.14
0.03
0.23
0.11
-
0.02
0.08
-
0.18
2P33506778
0.18
0.29
0.37
0.00
0.00
-
0.18
0.17
−0.07
0.00
0.00
-
0.05
0.06
0.20
0.81
SD
0.13
0.17
0.11
0.00
0.00
-
0.17
0.21
0.02
0.00
0.00
-
0.08
0.15
-
0.20
CI
0.10
0.13
0.09
-
-
-
0.09
0.17
0.03
-
-
-
0.05
0.12
-
0.16
2P33532337
0.19
0.32
0.39
0.00
0.07
1.00
0.23
0.24
−0.14
0.00
0.00
-
0.04
0.09
0.52
0.65
SD
0.11
0.15
0.15
0.00
0.08
0.00
0.26
0.17
0.20
0.00
0.00
-
0.09
0.19
0.00
0.31
CI
0.07
0.10
0.10
-
0.05
-
0.14
0.11
0.15
-
-
-
0.06
0.12
-
0.21
Curk et al. BMC Genetics (2014) 15:152
Page 8 of 19
Table 3 SNP genetic diversity within and between supposed ancestral varietal groups (Continued)
2P35391362
0.22
0.37
0.41
0.01
0.01
−0.09
0.24
0.20
−0.24
0.00
0.00
-
0.02
0.06
−0.15
0.73
SD
0.09
0.13
0.16
0.02
0.04
-
0.24
0.18
0.10
0.00
0.00
-
0.03
0.09
0.09
0.24
CI
0.04
0.06
0.07
0.02
0.02
-
0.13
0.08
0.06
-
-
-
0.02
0.04
0.06
0.11
2P36235952
0.13
0.28
0.55
0.00
0.00
-
0.02
0.04
0.45
0.04
0.02
−1.00
0.08
0.07
−0.28
0.55
SD
0.08
0.21
0.34
0.00
0.00
-
0.04
0.11
0.35
0.20
0.10
0.00
0.02
0.13
0.15
0.47
CI
0.03
0.08
0.14
-
-
-
0.02
0.04
0.26
0.08
0.04
-
0.01
0.05
0.12
0.19
Total
0.14
0.23
0.29
0.02
0.03
0.46
0.12
0.12
−0.02
0.09
0.05
−1.00
0.07
0.07
−0.08
0.51
SD
0.10
0.17
0.28
0.01
0.10
0.53
0.05
0.17
0.24
0.19
0.15
0.00
0.02
0.14
0.37
0.38
CI
0.03
0.02
0.03
0.01
0.01
0.19
0.03
0.02
0.04
0.09
0.02
-
0.01
0.02
0.09
0.04
Ho: observed heterozygosity; He: expected heterozygosity; FW: fixation index; FST: fixation index within population; SD: standard deviation; CI: confidence interval
estimated with alpha = 0.05.
oranges, represented, respectively, by three, two, and
two varieties. The two clementine cultivars were also
found to be identical. Polymorphism was found between
regular lemons and the other ones; however, the two
regular lemons (‘Eureka’ and ‘Lisbon’) and ‘Sweet’
lemon were found to be identical. Acid citrus types
(lemons, limes, ‘Alemow’, and bergamot) and sour orange
displayed high Ho values (0.26–0.34 ± 0.05). Sweet orange
(0.15 ± 0.04), clementine (0.19 ± 0.04), and grapefruit
(0.12 ± 0.04) displayed comparatively lower heterozygosity
levels [Additional file 7].
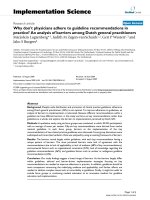
Structure software analysis was performed in the
absence of a prior hypothesis for group number. Analysis
of ΔK identified K = 4 as the optimal population number.
The ten runs for K = 4 displayed very homogeneous results (as shown by the average values [Figure 2, Additional
file 8]). C. medica, C. maxima, and C. micrantha defined
three populations, and five mandarins defined a fourth
population. The magnitude of genetic differentiation
between the groups was statistically confirmed by the
pairwise FST values, which ranged from 0.499 ± 0.091
for C. maxima/C. micrantha to 0.719 ± 0.087 for C.
micrantha/C. medica (Table 5). Eight of the additional
mandarins appeared to belong chiefly to this last
group but exhibited introgression from the C. maxima
group. ‘Shekwasha’ mandarin displayed a possible introgression of C. micrantha. Some cultivars displayed more
Table 4 Intra- and inter-varietal group dissimilarities
(average number of SNP/kb between two varieties)
Mandarins
Pummelos
Citrons
Mandarins
3.93*
Pummelos
10.41
2.06*
Citrons
14.56
11.21
1.26*
C. micrantha
13.49
10.61
12.24
*Average number of SNP/kb at intra-specific level.
pronounced genetic mixing. ‘Alemow’ and ‘Mexican’ lime
had half their features from the C. micrantha group
and half from the C. medica group. Similarly, sour oranges
had half their features from each of the C. reticulata
and C. maxima groups. Sweet orange and clementine
were admixtures of the C. maxima and C. reticulata
groups.. Regular and ‘Sweet’ lemons and bergamot were
admixtures of three groups: C. maxima, C. reticulata,
and C. medica. Close to half of the genetic material
in ‘Volkamer’ and ‘Meyer’ lemons was of the C. medica
group, and half was of the C. reticulata group [Figure 2,
Additional file 8].
PCA analysis confirmed the organization of the whole
diversity coming from the four ancestral varietal groups
(Figure 3). The three primary axes encompassed 56.3%
of the total observed diversity. The first axis mainly
separated citrons and C. micrantha from pummelos
and mandarins. The second axis distinguished pummelos
from other ancestral varietal groups. Finally, the third axis
separated C. micrantha from other groups. ‘Alemow’
and ‘Mexican’ lime displayed intermediate positions
between citrons and C. micrantha. Regular and ‘Sweet’
lemons and bergamot had intermediate positions between
citrons and mandarins/sour oranges. Clementine lay
within the mandarin cluster, while grapefruit was included in the pummelo cluster. Sweet orange and sour
orange were located between the pummelo and mandarin clusters. The mandarin group displayed two noticeable subclusters. The subcluster that contained
clementines and mandarins that were potentially introgressed by pummelo was displaced towards the pummelo cluster.
Analysis of linkage disequilibrium (LD) between SNPs
along the chromosome [Additional file 9] also testifieds
to a very high population genetic structure of the varietal
sample. Significant LD values were observed across the
whole chromosome, even for SNPs at distally opposing
positions.
Curk et al. BMC Genetics (2014) 15:152
Page 9 of 19
Figure 2 Estimated population structure representation based on the average values of ten Structure runs at K = 4.
Gene fragment haplotype inference and phylogeny
For each gene fragment, two haplotypes were inferred
for each variety. NJA and maximum likelihood analysis
of haplotypes was performed to determine phylogenetic
relationships, and the two methods produced the same
outcomes. For example, for the 2P35391362 gene fragment (Figures 4), three, three, one, and two different
haplotypes were identified in the C. reticulata, C. maxima, C. micrantha, and C. medica clusters, respectively.
Multilocus haplotypic analysis also provided evidence
of interspecific introgressions in varieties representative of one of the four supposed ancestral varietal
groups. For this fragment, six mandarins shared one C.
maxima haplotype with pummelos. Haplotypic analysis
allowed clear inference of phylogenetic inheritance
patterns for 2P35391362 in the secondary citrus species
[Additional file 10]. For example, clementine clearly exhibited interspecific heterozygosity (C. maxima/C. reticulata): one haplotype was shared with sweet orange in the
C. maxima cluster, and one was shared with ‘Willowleaf’
mandarin in the C. reticulata cluster. The second sweet
orange haplotype was also in the C. maxima cluster and
was shared with grapefruits that were homozygous for
this haplotype. Evidence of interspecific inheritance was
also found in sour orange (C. maxima/C. reticulata), bergamot (C. medica/C. reticulata), ’Eureka’, ‘Lisbon’, ‘Sweet’,
‘Volkamer’, and ‘Meyer’ lemons (C. medica/C. reticulata), and
‘Mexican’ lime and ‘Alemow’ (C. medica/C. micrantha).
NJA of genotypic information from the same data set
(Figure 5) provided a representation of two apparent C.
reticulata clusters with unclear relationships. One of the
clusters included accessions that exhibited interspecific inheritance when haplotype was assessed (several mandarins,
sour oranges, and clementines). Similarly, lemons, limes,
‘Alemow’, and bergamot lay between C. medica and C.
micrantha, clusters and branching did not provide definitive phylogenetic information.
A total of 210 haplotypes were identified through
analysis of 16 gene fragments on chromosome 2 (Table 6;
[Additional file 11]). From the phylogenetic analysis
Table 5 Pairwise population FST values
Mandarin
Pummelo
Pummelo
SNP
FST
172
0.502 ± 0.061
SNP
Citron
FST
Citron
171
0.666 ± 0.061
142
0.585 ± 0.066
C. micrantha
167
0.574 ± 0.079
143
0.499 ± 0.091
SNP
FST
127
0.719 ± 0.087
Curk et al. BMC Genetics (2014) 15:152
Page 10 of 19
Figure 3 Organization of genotypic SNP diversity. All varieties and all SNP data were analyzed by PCA. ML: ‘Mexican’ lime; A: ‘Alemow’; V:
‘Volkamer’ lemon; M: ‘Meyer’ lemon; L: Regular and ‘Sweet’ lemons; B: Bergamot; H: Haploid clementine; C: Clementines; S: Sour oranges; O: Sweet
oranges; G: Grapefruits.
of each fragment, we considered 77, 58, 34, and
25 haplotypes to be representative of C. reticulata, C.
maxima, C. medica, and C. micrantha, respectively. For
16 haplotypes, the organization of the genetic diversity of
the corresponding fragment was insufficient to infer
phylogenetic origin. The indeterminate haplotypes mostly
concerned mandarin and pummelo.
The haplotypic structure of each accession was used to
schematize the phylogenetic origin of genome fragments
along chromosome 2 (Figure 6). In the absence of data
regarding the phase between different haplotypes, this
representation was made genotypically (homozygous for
one ancestral taxon or heterozygous between two taxa).
A single genotype was used to represent a varietal
group when no polymorphisms were observed between
varieties.
Ten of the fourteen mandarins were introgressed by
C. maxima, mostly in heterozygosity. Two homozygous
fragments for a C. maxima haplotype (ma1/ma1) and one
fragment heterozygous for two C. maxima haplotypes
(ma1/ma2) were found in ‘Ponkan’ mandarin. No evidence
of interspecific introgression was observed for the representatives of the other three ancestral varietal groups.
Completely heterozygous interspecific structures between
C. micrantha and C. medica were observed for ‘Mexican’
lime and ‘Alemow’. Sour orange displayed complete
heterozygosity between C. reticulata and C. maxima.
Grapefruit appeared to have inherited mostly C. maxima
haplotypes but displayed heterozygosity with C. reticulata
at the start of the scaffold. Sweet orange was mostly
heterozygous between C. reticulata and C. maxima, with
a small fragment at the first part of the scaffold inherited
solely from C. reticulata, and a genome area at the end of
the scaffold inherited exclusively from C. maxima.
Bergamot and regular, ‘Sweet’, and ‘Meyer’ lemons displayed
similar structures that mainly comprised heterozygous regions of C. medica/C. reticulata and C. medica/C. maxima.
However, two small homozygous regions (2P4517048 and
2P33532337 gene fragments) were observed in ‘Meyer’
lemon (C. reticulata homozygosity re3/re3 and re2/re2)
and bergamot (C. maxima homozygosity ma1/ma1 and
ma2/ma2). No exploitable data were obtained for one gene
fragment of ‘Volkamer’ lemon. For the other 15 gene
fragments, ‘Volkamer’ lemon systematically displayed one
haplotype corresponding with the C. medica cluster.
The other haplotypes for 14 of these gene fragments
Curk et al. BMC Genetics (2014) 15:152
Page 11 of 19
Figure 4 Neighbor-joining analysis (NJA) of the haplotypic data for the 2P35391362 gene fragment.
were assigned to the C. reticulata cluster. The remaining
haplotype was in a cluster of indeterminate phylogeny
[Additional file 12].
Revised genetic relationships between the four basic taxa
after removal of introgressed genomic regions identified
in mandarin from haplotypic analysis
The identification, from haplotypic analysis, of introgressed
pummelo fragments in mandarin genotypes prompted a
revision of the relationships of the ancestral basic taxa
(C. maxima, C. reticulata, C. medica, and C. micrantha)
relative to the varietal groups deriving from these taxa
(pummelos, mandarins, citrons and micrantha). The average SNP density within C. reticulata (Table 7) was lower
(2.85 SNP/kb) than in mandarin (3.93 SNP/kb) (Table 4).
Conversely, the C. maxima/C. reticulata average differentiation was 11.15 SNP/kb (10.41 SNP/kb between
mandarins and pummelos). The differentiation values
of C. reticulata with C. micrantha and C. medica were
similar to those of mandarin with micrantha and citron,
respectively.
For each SNP, GST values were estimated for each basic
species relative to all other species. This allowed estimation of the value of each considered SNP to confirm that
Curk et al. BMC Genetics (2014) 15:152
Page 12 of 19
Figure 5 Neighbor-joining analysis (NJA) of the genotypic data for the 2P35391362 gene fragment.
the surrounding genome fragment was inherited from the
given species (SNP specific-diagnostic points). Corrections
from the introgression information increased the number
of diagnostic markers for C. reticulata and C. maxima
relative to the initial data for mandarin and pummelo
[Additional file 13]. The number of SNP loci with an average GST value >0.8 increased from 14 and 6 for mandarins
and pummelos to 27 and 10 for C. reticulata and C. maxima, respectively. The highest number of totally discriminant SNPs (GST = 1) was observed for C. medica (27)
followed by C. reticulata (22), C. micrantha (21), and C.
maxima (8) [Additional file 14].
Discussion
Genotype and haplotype information from 454 parallel
sequencing of 400–600 bp amplicons can identify
admixture structures and infer the evolutionary history of
species with reticulate evolution
Three hundred heighten SNPs were found in 16 gene
fragments from chromosome 2. The SNPs/kb rate within
introns (53.6) was highly similar to the rate previously determined for the Citrus genus (51.5) by Garcia-Lor et al.
[16]. The SNPs/kb rate within exons was slightly higher in
this study (38.0) than in the previous study (29). Taken
together, and including the small 3′ UTR regions, 48.3
Curk et al. BMC Genetics (2014) 15:152
Page 13 of 19
Table 6 Number of haplotypes attributed to the four basic taxa or with indeterminate phylogenetic origin
Gene fragment
C. reticulata
C. maxima
C. medica
C. micrantha
Indeterminate
Total
2P737170
4
6
2
2
0
14
2P3068140
4
2
1
1
1
9
2P4517048
5
3
2
1
0
11
2P8108334
10
7
3
2
2
24
2P11442721
8
5
2
1
0
16
2P13928427
3
2
2
2
2
11
2P21022460
1
2
2
1
2
8
2P25198627
5
1
3
2
1
12
2P26819388
8
2
2
1
2
15
2P29538734
7
6
4
2
0
19
2P30446231
6
7
3
2
1
19
2P32507721
3
1
1
2
4
11
2P33506778
2
1
1
1
1
6
2P33532337
2
2
1
1
0
6
2P35391362
3
3
2
1
0
9
2P36235952
6
8
3
3
0
20
Total
77
58
34
25
16
210
SNPs/kb were identified. This rate varied between gene
fragments (range: 11.2–79.7).
The observed higher heterozygosity in secondary species
than in the basic taxa, as well as the higher diversity
in mandarin and pummelo compared to citron, was in
agreement with previous studies [15,16,18]. Moreover, the
high structuration of the diversity around C. maxima, C.
medica, C. reticulata, and C. micrantha revealed by Structure and PCA agreed with previous molecular [13,14,16,65]
and numerical taxonomy [20] studies, which recognizes the
four basic taxa as the ancestors of the cultivated Citrus
species. The important ancestral taxon differentiation and
the limited number of reticulations and further interspecific
hybridizations also resulted in the generalized LD observed
in this study. LD was maintained even for fragments on
opposing telomeres, also noted in previous studies for
markers on different chromosomes [15,18].
The relative levels of differentiation between C. maxima, C. medica, C. reticulata, and C. micrantha varied
(10.61–14.8 SNPs/kb), and was on average 6.7 times
higher than the within-taxon diversity (from 1.24 in C.
medica to 2.85 in C. reticulata). This diversity pattern
allowed inferring haplotype phylogenetic origin for 12 of
the 16 genes examined on chromosome 2. Differentiation was low for the four genes in the central part of the
chromosome, and this resulted in clusters of indeterminate phylogenetic origin. The indeterminate haplotypes
mainly concerned mandarins, pummelos, and their
secondary species haplotypes.
Haplotype analysis demonstrated C. maxima introgressions in genotypes generally considered to be true
mandarins. After removal of these haplotypes from the
analysis of the supposed ancestral taxa, higher monolocus
differentiation was observed between C. reticulata and C.
maxima. This also allowed more precise estimations of C.
reticulata intraspecific polymorphism. The identification
of introgressed areas from haplotypic analysis, therefore,
provided better species tree reconstruction. As recommended by Ramagudu et al. [37], species trees can be improved by using loci that generate gene trees that are more
clearly resolved. Haplotypic analysis has potential in this regard, and will allow the deselection of regions with incomplete lineage sorting or interspecific introgressions.
In the present study, 454 amplicon sequencing was
successfully used to determine haplotypes in heterozygous
genotypes and to analyze admixtures resulting from reticulate evolution. The broader utility of this method for
identifying polymorphisms and inferring haplotype phylogenetic origins in other plants will depend on polymorphism rates within and between subspecies or species.
Determination of the phylogenetic structure of
chromosome 2 in several Citrus species and varieties
provided insights into the origins of modern cultivated
citrus
Haplotype NJA analysis of each gene fragment allowed
the phylogenetic inheritance of genome fragments along
chromosome 2 to be inferred for the 48 analyzed genotypes. Although a small number of haplotypes remained
of indeterminate phylogenetic origin, the results provided an invaluable overview of the phylogenetic structure of chromosome 2 and the origin of modern Citrus.
Curk et al. BMC Genetics (2014) 15:152
Page 14 of 19
Figure 6 Genotypic structure of chromosome 2 in 48 Citrus varieties inferred from haplotypic data.
The representative genotypes of the pummelo and
citron horticultural groups appeared to be pure C.
maxima and C. medica, respectively, and no interspecific
introgressions were identified. Similarly, no evidence of
introgression was found in C. micrantha. Conversely,
evidence of introgression by C. maxima was found in 10
of the 14 mandarins studied. This corresponds with recent
research [43] in which WGS analysis of ‘Willowleaf’ and
Table 7 Intra- and interspecies group dissimilarity
(average number of SNP/kb between two varieties) after
elimination of introgressed haplotypes
C. reticulata
C. maxima
C. medica
C. reticulata
2.85*
C. maxima
11.15
1.86*
C. medica
14.80
11.21
1.24*
C. micrantha
13.82
10.61
12.19
*Average number of SNP/kb at intra-specific level.
‘Ponkan’ mandarins demonstrated introgression in theses
varieties considered to be true mandarins by citrus
taxonomists. Three of the four mandarin varieties
lacking evidence for introgression (‘Cleopatra’, ‘Sunki’,
and ‘Sun Chu Sha’) are used mostly as rootstock and
do not share the edible mandarin mitotype revealed
by Froelicher et al. [66]. This particular mandarin
clade should, therefore, probably not be considered as
ancestral to modern cultivated mandarins. The fourth mandarin (‘Nanfengmiju’) without evidence for introgression
shares the cytoplasm of edible mandarins.
The parentage hypothesis of some important commercial species and cultivars suspected to have arisen from reticulate evolution was checked by analyzing the haplotype
phylogeny for each gene fragment [Additional file 10].
Citrus sinensis (sweet oranges) and Citrus aurantium
(sour oranges): phenotypic data [20] and molecular
marker studies [18,67,68] suggested that these two species derived from hybridizations between the C. maxima
Curk et al. BMC Genetics (2014) 15:152
and C. reticulata gene pools. Both species have C. maxima maternal phylogeny as determined by chloroplast [69]
and mitochondrial genome analysis [66]. In the present
haplotype analysis within chromosome 2, sour orange
displayed C. maxima/C. reticulata heterozygosity for
each gene fragment. Sweet orange displayed C. reticulata/C. reticulata and C. maxima/C. maxima genome
regions in addition to C. maxima/C. reticulata heterozygosity. The presence of a C. maxima/C. maxima region at
the end of chromosome 2 disproves the hypothesis of a (C.
maxima × C. reticulata) × C. reticulata ancestry proposed
by Roose et al. [70] from SSR data, and Xu et al. [42] from
WGS data. This was also determined by examination of two
genes by Garcia-Lor et al. [16] and confirmed by whole
genome resequencing data from the ICGC [43]. These
results suggest a possible direct F1 interspecific origin for
sour orange and a more complex origin for sweet orange
that would involve two parents each with C. reticulata and
C. maxima admixture. These conclusions are in agreement
with those proposed by the ICGC [43]. Considering that
many mandarin cultivars are introgressed by C. maxima,
a backcross model of (pummelo × mandarin) × mandarin
rather than (C. maxima × C. reticulata) × C. reticulata
would reconcile the Wu et al. [43] and Xu et al. [42]
hypotheses. For 8 of the 16 gene fragments analyzed in the
present study, both sweet orange and sour orange were
heterozygous but did not share haplotypes, therefore
discarding the hypothesis of a direct relationship between
them.
Clementine: It is generally agreed that, a little more
than one century ago in Algeria, Father Clement selected
clementine as a chance seedling from a ‘Mediterranean’
mandarin (‘Willowleaf’). Previous molecular studies
suggested that clementine was a mandarin × sweet orange
hybrid [13,17,18,71], and this was recently confirmed by
WGS analysis [43]. From the haplotype data, the larger part
of chromosome 2 in clementine appears to be inherited
from C. reticulata, with C. maxima/C. reticulata heterozygosity at the end of the orientated chromosome
(phytozome.net [46]) in agreement with WGS data [43].
The haplotype alleles of clementine, sweet orange, and
‘Willowleaf’ mandarin are in complete agreement with the
hypothesis of a ‘Willowleaf’ × sweet orange origin.
C. paradisi (grapefruits): The origin of grapefruit
is attributed to a natural hybridization between pummelo
(C. maxima) and sweet orange (C. sinensis) in the
Caribbean after the discovery of the New World by
Christopher Columbus [15,18,72,74]. The haplotype
analyses agree with this hypothesis, showing coherent
haplotypes for most of the gene fragments. In grapefruit,
only one fragment (2P32507721) displayed a haplotype
observed neither in sweet orange nor in the pummelo
accessions (nor in other basic species clusters). However,
this gene fragment displayed insufficient differentiation to
Page 15 of 19
allow full phylogenetic assignation, and the unassigned
grapefruit haplotype may have been inherited from a
pummelo not included in our limited samples. Chromosome 2 of grapefruit is mainly inherited from C. maxima
and displays a small region of C. maxima/C. reticulata
heterozygosity at the start of the scaffold.
Citrus limon (lemons): Based on RFLP, RAPD, and
CAPS data, Nicolosi et al. [13] proposed that “regular
lemons” arose from hybridization between C. aurantium
and C. medica. This hypothesis was supported by nuclear
SSR [15] and SNP [18] analyses. Moreover, the maternal
C. aurantium parentage was confirmed by study of mitochondrial indels [66]. In the present study, ‘Eureka’, ‘Lisbon’,
and ‘Sweet’ lemon varieties were highly heterozygous and
identical. These lemons are very likely somatic mutants of
the same hybrid ancestor. The three lemons display successive genome regions with C. reticulata/C. medica or C.
maxima/C. medica heterozygosities. The haplotype allele
analysis completely concurs with the sour orange × citron
hypothesis. Indeed, systematic haplotype sharing between
lemon and sour orange and the location of the second
haplotypes within C. medica clusters were observed.
‘Meyer’ lemon also appeared to be of tri-specific hybrid
origin [15] and displayed C. maxima/C. medica and C.
reticulata/C. medica heterozygosity, as well as two gene
fragments homozygous for a C. reticulata haplotype. Even
if the ‘Meyer’ lemon were found to have a sweet orangelike mitotype [66], as there were only two shared haplotypes between sweet orange and Meyer lemon over the
16 gene fragments, the haplotype analysis disproved the
hypothesis that sweet orange was the female parent.
‘Volkamer’ lemon fragment gene haplotypes suggest
that this genotype was a direct hybrid of C. reticulata and
C. medica.
Citrus aurantifolia (‘Mexican’ lime, ‘Alemow’, and bergamot): These three citrus types were considered to be distinct species, namely, C. aurantifolia, C. macrophylla, and
C. bergamia respectively, by Tanaka [10]. ‘Mexican’ lime
and ‘Alemow’ displayed interspecific heterozygosity between haplotypes of the C. medica and the C. micrantha
clusters. For ‘Mexican’ lime, exact haplotype sharing with
the analyzed C. micrantha sample was found for 15 of the
16 gene fragments. This is in agreement with the hypothesis proposed by Nicolosi et al. [13] that suggests ‘Mexican’ lime is a C. micrantha × C. medica hybrid. Maternal
phylogeny was recently confirmed by mitochondrial
marker analysis [66]. Similar results were observed for
‘Alemow’. However, exact haplotype correspondence
with the analyzed C. micrantha sample was found only
for 12 gene fragments. This suggests that the maternal
parent of ‘Alemow’ was closely related to the analyzed
C. micrantha, which is in agreement with the Swingle
and Reece [9] description of ‘Alemow’ as a possible hybrid of Citrus celebica Koord (a papeda distinct from
Curk et al. BMC Genetics (2014) 15:152
C. micrantha) or some other species of the subgenus
Papeda, with a species of the subgenus Citrus. In 1811,
Gallesio [75] proposed that bergamot was a hybrid
between lemon and sour orange. However, alternative
hypotheses were proposed based on molecular studies.
Chen et al. [76] suggested that bergamot could be a hybrid between citron and lime, Herrero et al. [65] and
Federici et al. [77] proposed hybridization between
sour orange and sweet lime, and hybridization between
sour orange and citron was proposed by Nicolosi et al.
[13] and Li et al. [78]. The present haplotypic analysis
disproved the hypotheses of hybridization between sour
orange and citron, and between lemon and ‘Mexican’ lime,
because bergamot displayed haplotypes not found in any
of these theoretical parents.
Implications for secondary species breeding
Some secondary apomictic species such as C. aurantium
(C. maxima × C. reticulata) and C. aurantifolia (C.
micrantha × C. medica), or genotypes such ‘Volkamer’
lemon (C. reticulata × C. medica), displayed interspecific heterozygosity for each gene fragment. They may
have resulted directly from reticulation without further
sexual recombination. For such secondary species, innovative “like species” cultivars should be searched by
direct hybridisation between the ancestral corresponding parental taxa, focusing on germplasm providing
the suitable tolerance or resistance traits.
Conversely, other secondary species such as C. sinensis
and C. limon (“Regular lemon” types) displayed more
complex chromosome structures that testified to further
interspecific recombination after the first reticulation
events. For example, lemons (‘Eureka’, ‘Lisbon’, and ‘Sweet’
cultivars) systematically had one of their haplotypes within
the C. medica cluster and the other in either the C. maxima or the C. reticulata cluster. Under our hypothesis of a
sour orange × citron origin, the changes between C. reticulata/C. medica and C. maxima/C. medica heterozygosities
along the chromosome suggest that at least three interspecific crossing over events occurred to produce the sour orange gamete that generated the lemon prototype. Previous
studies [73,78] and the present work demonstrated that
grapefruit resulted from hybridization between pummelo
and sweet orange. For these three important citrus horticultural groups, it will be necessary to have a complete
view of the nine chromosome admixture organizations to
be able to rebuild similar genomic admixture structures
from germplasm. Of these, “regular lemons” should be the
simplest to assess despite the three-taxa structure, as it
likely resulted from a relatively straightforward sequence
of interspecific hybridizations (C. maxima × C. reticulata) ×
C. medica). Genomic-assisted selection within progenies
resulting from these crossing schemes should allow selection of very close interspecific mosaic structures. Such
Page 16 of 19
crossing will, however, be more complex for sweet orange
and grapefruit because the two parents of sweet orange
were themselves of interspecific origin. However, adequate
pre-breeding at the parental level and genomic selection
schemes over two or three generations should allow the
reconstruction of similar interspecific mosaic genome
structures from C. maxima and C. reticulata germplasm
alongside desired resistance traits.
Conclusion
Sixteen gene fragments on chromosome 2 were sequenced
in 48 genotypes using 454 amplicon sequencing. The
length of the reads and the level of differentiation between
the ancestral taxa of modern citrus allowed efficient
haplotype phylogenetic assignments for most gene fragments. The analysis of admixture genomic structures of
modern species and cultivars revealed C. maxima introgressions in most modern mandarin cultivars. The
haplotype results corresponded with previous hypotheses
regarding the origin of many secondary citrus species, and
provided a novel interpretation for the evolution of
chromosome 2. Haplotyping of well-dispersed genome
fragments should prove to be widely applicable, particularly for the analysis of evolutionary patterns within
gene pools that experienced reticulate evolution. It is
clear that this and other NGS methods will dramatically
change methods of phylogenetic analysis. Regarding citrus breeding, the interspecific mosaic structure of all
nine chromosome should be pursued, as this will provide the opportunity to rebuild the secondary species
genomes from ancestral taxa bearing desirable traits.
Additional files
Additional file 1: Excel table of varieties by common horticultural
group and scientific names.
Additional file 2: Excel table presenting information of amplicon
location (physical and genetic), annotation of genes, and specific
primers for Fluidigm amplification.
Additional file 3: Excel table of multiplex genotype identifiers (MID)
and related genotypes.
Additional file 4: Excel table of the distribution of read numbers
per gene fragment and varieties for the first Fluidigm run.
Additional file 5: Excel table of the distribution of read numbers
per gene fragment and varieties for the two Fluidigm runs, and
solutions used for insufficient read number situations.
Additional file 6: Excel table of parameters of SNP genetic diversity
for each SNP position.
Additional file 7: Excel table of the Heterozygosity (Ho) of
secondary species.
Additional file 8: Pdf document presenting the analyse of ten
Structure software runs at K = 4. Figure S1: 10 independent Structure
software run clusters output permuted and aligned in order to match up
as closely as possible. Table S1: Average values of the Ten Structure runs
at K = 4 for each cluster of each variety (confidence interval estimated
with alpha = 0.05).
Curk et al. BMC Genetics (2014) 15:152
Additional file 9: Pdf document demonstrating linkage
disequilibrium (LD) between SNPs on chromosome 2.
Additional file 10: Pdf document demonstrating the maximum
likelihood phylogenetic tree of the haplotypic data of the
2P35391362 gene fragment.
Page 17 of 19
8.
9.
Additional file 11: Pdf document demonstrating the observed
inherited haplotypic structure of secondary species.
10.
Additional file 12: Excel table of the haplotypic structure of each
accession.
11.
Additional file 13: Pdf document demonstrating a 3D distribution
of gene sequence SNPs according to their haplotypic GST value; a:
GST value for three horticultural groups (mandarins, pummelos and
citrons); b GST values for three basic taxa after introgression
information corrections.
Additional file 14: Excel table of SNP GST values of each taxa
before and after introgression information correction.
Competing interests
The authors declare that they have no competing interests.
Authors’ contributions
FC and GA performed target genomic fragment selection, primer design,
amplicon library preparation, genetic analysis of the SNP data, molecular
genetic studies, and drafted the manuscript. AGL, FL, XP, and JPJC
participated in target genomic fragment selection, and molecular genetic
studies. LN participated in the design of the study and its coordination. PO
conceived the study, and participated in its design and coordination, and
drafted the manuscript. All authors read and approved the final manuscript.
Acknowledgments
This work was supported by a grant (AGL2011-26490) from the Ministry of
‘Economía y Competitividad’– ‘Fondo Europeo de Desarrollo Regional’
(FEDER) and a grant (Prometeo II/2013/008) from the Generalitat Valenciana,
Spain.
We gratefully acknowledge David Karp for his help reviewing the
manuscript.
Author details
1
UMR AGAP, Institut National de la Recherche Agronomique (Inra), Centre
Inra de Corse, F-20230 San Giuliano, France. 2Centro de Protección Vegetal y
Biotecnología, Instituto Valenciano de Investigaciones Agrarias (IVIA), 46113
Moncada, Valencia, Spain. 3UMR AGAP, Centre de coopération Internationale
en Recherche Agronomique pour le Développement (CIRAD), TA A-108/02,
34398 Montpellier, Cedex 5, France.
12.
13.
14.
15.
16.
17.
18.
19.
20.
Received: 21 August 2014 Accepted: 11 December 2014
21.
References
1. FAO: FAOSTAT 2014,
2. Ollitrault P, Navarro L: Citrus. In Fruit Breeding, Dordrecht Heildlberg edition.
Edited by Badenes M, Byrne D. London: Springer New York; 2012:623–662.
3. Wang N, Trivedi P: Citrus Huanglongbing: a newly relevant disease
presents unprecedented challenges. Phytopathology 2013, 103(7):652–665.
4. Grosser JW, Dutt M, Omar A, Orbovic V, Barthe G: Progress towards the
development of transgenic disease resistance in citrus. Acta Hort (ISHS)
2011, 892(101):107.
5. Texeira DC, Ayres J, Kitajima EW, Danet L, Jagoueix-Eveillard S, Saillard C,
Bové JM: First Report of a Huanglongbing-Like Disease of Citrus in Sao
Paulo State, Brazil and Association of a New Liberibacter Species,
“Candidatus Liberibacter americanus”, with the Disease. Plant Dis 2005,
89(1):107.
6. Grosser JW, Deng XX, Goodrich RM: Somaclonal variation in sweet orange:
practical applications for variety improvement and possible causes. In
Citrus genetics, breeding and biotechnology. Edited by Kham IA.
Wallingford: CAB International; 2007:219–233.
7. Krueger RR, Navarro L: Citrus germplasm resources. In Citrus Genetics,
Breeding and Biotechnology. Anonymous Wallingford, UK: CAB International;
2007:45–140.
22.
23.
24.
25.
26.
27.
28.
29.
30.
31.
Scora RW: On the history and origin of Citrus. Bull Torrey Bot Club 1975,
102:369–375.
Swingle WT, Reece PC: The botany of Citrus and its wild relatives. In The
citrus industry. Volume 1. 2nd edition. Edited by Reuther W, Webber HJ,
Batchelor LD. Berkeley, California, USA: University of California Press;
1967:190–430.
Tanaka T: Citologia: Semi-centennial Commemoration Papers on Citrus Studies.
Osaka: Citologia Supporting Foundation; 1961.
Mabberley DJ: A classification for edible Citrus (Rutaceae). Telopea 1997,
7(2):167–172.
Federici CT, Fang DQ, Scora RW, Roose ML: Phylogenetic relationships
within the genus Citrus (Rutaceae) and related genera as revealed by
RFLP and RAPD analysis. Theor Appl Genet 1998, 96(6/7):812–822.
Nicolosi E, Deng ZN, Gentile A, La Malfa S, Continella G, Tribulato E: Citrus
phylogeny and genetic origin of important species as investigated by
molecular markers. Theor Appl Genet 2000, 100:1155–1166.
Barkley NA, Roose ML, Krueger RR, Federici CT: Assessing genetic diversity
and population structure in a citrus germplasm collection utilizing
simple sequence repeat markers (SSRs). Theor Appl Genet 2006,
112(8):1519–1531.
Garcia-Lor A, Luro F, Navarro L, Ollitrault P: Comparative use of InDel and
SSR markers in deciphering the interspecific structure of cultivated citrus
genetic diversity: a perspective for genetic association studies. Mol Genet
Genomics 2012, 287(1):77–94.
Garcia-Lor A, Curk F, Snoussi-Trifa H, Morillon R, Ancillo G, Luro F, Navarro L,
Ollitrault P: A nuclear phylogenetic analysis: SNPs, indels and SSRs deliver
new insights into the relationships in the ‘true citrus fruit trees’ group
(Citrinae, Rutaceae) and the origin of cultivated species. Ann Bot 2013,
111(1):1–19.
Ollitrault P, Terol J, Chen C, Federici CT, Lotfy S, Hippolyte I, Ollitrault F,
Berard A, Chauveau A, Cuenca J, Costantino G, Kacar Y, Mu L, Garcia-Lor A,
Froelicher Y, Aleza P, Boland A, Billot C, Navarro L, Luro F, Roose ML, Gmitter
FG, Talon M, Brunel D: A reference genetic map of C. clementina hort. ex
Tan.; citrus evolution inferences from comparative mapping. BMC Genomics
2012, 13:593-2164-13-593.
Ollitrault P, Terol J, Garcia-Lor A, Berard A, Chauveau A, Froelicher Y, Belzile
C, Morillon R, Navarro L, Brunel D, Talon M: SNP mining in C. clementina
BAC end sequences; transferability in the Citrus genus (Rutaceae),
phylogenetic inferences and perspectives for genetic mapping.
BMC Genomics 2012, 13:13-2164-13-13.
Webber HJ, Reuther W, Lawton HW: istory and development of the Citrus
industry. In The Citrus Industry, Volume Volume 1. Edited by Reuther W,
et al. Berkeley: University of California, Division of Agricultural Sciences;
1967:1–39.
Barrett HC, Rhodes AM: A numerical taxonomic study ofaffinity
relationships in cultivated Citrus and its close relatives. Syst Bot 1976,
1:105–136.
Ollitrault P, Jacquemond C, Dubois C, Luro F: Citrus. In Genetic diversity of
cultivated tropical plants. Edited by Hamon P, Seguin M, Perrier X,
Glaszmann J-C. Montpellier: Cirad; 2003:193–217.
Luro F, Gatto J, Costantino G, Pailly O: Analysis of genetic diversity in
Citrus. Plant Genetic Resources 2011, 9:218–221.
Fanciullino AL, Dhuique-Mayer C, Luro F, Casanova J, Morillon R, Ollitrault P:
Carotenoid diversity in cultivated citrus is highly influenced by genetic
factors. J Agric Food Chem 2006, 54(12):4397–4406.
Stebbins G: Variation and evolution in plants: Columbia University Press ed.
New York: Columbia University Press; 1950.
Grant V: Plant Speciation: 2nd Edit. ed. New York: Colombia University Press;
1981.
Arnold ML: Natural hybridization and evolution. New York: Oxford University
Press; 1997.
Doolittle WF: Phylogenetic Classification and the Universal Tree. Science
1999, 284(5423):2124–2129.
Otto SP, Whitton J: Polyploid incidence and evolution. Annu Rev Genet
2000, 34:401–437.
Linder CR, Rieseberg LH: Reconstructing patterns of reticulate evolution in
plants. Am J Bot 2004, 91:1700–1708.
Pamilo P, Nei M: Relationships between gene trees and species trees. Mol
Biol Evol 1988, 5:568–583.
Rieseberg LH, Soltis DE: Phylogenetic consequences of cytoplasmic gene
flow in plants. Trends in Plants 1991, 5:65–84.
Curk et al. BMC Genetics (2014) 15:152
32. Beiko RG, Hamilton N: Phylogenetic identification of lateral genetic
transfer events. BMC Evol Biol 2006, 6:15.
33. Rieseberg LH, Sinervo B, Linder CR, Ungerer MC, Arias DM: Role of
gene interactions in hybrid speciation: evidence from ancient and
experimental hybrids. SCIENCE-NEW YORK THEN WASHINGTON- 1996,
272:741–744.
34. Rieseberg LH, Raymond O, Rosenthal DM, Lai Z, Livingstone K, Nakazato T,
Durphy JL, Schwarzbach AE, Donovan LA, Lexer C: Major ecological
transitions in annual sunflowers facilitated by hybridization. Science 2003,
301:1211–1216.
35. Rousseau-Gueutin M, Gaston A, Aïnouche A, Aïnouche ML, Olbricht K,
Staudt G, Richard L, Denoyes-Rothan B: Tracking the evolutionary
history of polyploidy in Fragaria L. (strawberry): new insights from
phylogenetic analyses of low-copy nuclear genes. Mol Phylogenet Evol
2009, 51(3):515–530.
36. Fortune P, Pourtau N, Viron N, Ainouche M: Molecular phylogeny and
reticulate origins of the polyploid Bromus species from section Genea
(Poaceae). Am J Bot 2008, 95(4):454–464.
37. Ramadugu C, Pfeil BE, Keremane ML, Lee RF, Maureira-Butler IJ, Roose ML: A
six nuclear gene phylogeny of Citrus (Rutaceae) taking into account
hybridization and lineage sorting. PLoS One 2013, 8(7):e68410.
38. Maddison WP, Knowles LL: Inferring phylogeny despite incomplete
lineage sorting. Syst Biol 2006, 55(1):21–30.
39. Jumpponen A, Jones KL: Massively parallel 454-sequencing of Quercus
macrocarpa phyllosphere fungal communities indicates reduced richness
and diversity in urban environments. New Phytol 2009, 184:438–448.
40. Sønstebø JH, Gielly L, Brysting AK, Elven R, Edwards M, Haile J, Willersleve E,
Coissac E, Rioux D, Sannier J, Taberlet P, Brochmann C: Using nextgeneration sequencing for molecular reconstruction of past Arctic
vegetation and climate. Mol Ecol Resour 2010, 10(6):1009–1018.
41. Taudien S, Groth M, Huse K, Petzold A, Szafranski K, Hampe J, Rosenstiel P,
Schreiber S, Platzer M: Haplotyping and copy number estimation of
the highly polymorphic human beta-defensin locus on 8p23 by 454
amplicon sequencing. BMC Genomics 2010, 11(1):252.
42. Xu Q, Chen L, Ruan X, Chen D, Zhu A, Chen C, Bertrand D, Jiao W, Hao B,
Lyon PM, Chen J, Gao S, Xing F, Lan H, Chang J, Ge X, Lei Y, Hu Q, Miao Y,
Wang L, Xiao S, Biswas KM, Zeng W, Guo F, Cao H, Yang X, Xu X, Cheng Y,
Xu J, Liu J, et al: The draft genome of sweet orange (Citrus sinensis). Nat
Genet 2013, 45:59–66.
43. Wu GA, Prochnik S, Jenkins J, Salse J, Hellsten U, Murat F, Perrier X, Ruiz M,
Scalabrin S, Terol J, Takita MA, Labadie K, Poulain J, Couloux A, Jabbari K,
Cattonaro F, Del Fabbro C, Pinosio S, Zuccolo A, Chapman J, Grimwood J,
Tadeo FR, Estornell LH, Munoz-Sanz JV, Ibanez V, Herrero-Ortega A, Aleza P,
Perez-Perez J, Ramon D, Brunel D, et al: Sequencing of diverse mandarin,
pummelo and orange genomes reveals complex history of admixture
during citrus domestication. Nat Biotechnol 2014, 32(7):656–662.
44. Okou DT, Steinberg KM, Middle C, Cutler DJ, Albert TJ, Zwick ME:
Microarray-based genomic selection for high-throughput resequencing.
Nat Methods 2007, 4(11):907–909.
45. Bybee SM, Bracken-Grissom H, Haynes BD, Hermansen RA, Byers RL, Clement
MJ, Udall JA, Wilcox ER, Crandall KA: Targeted amplicon sequencing (TAS):
a scalable next-gen approach to multilocus, multitaxa phylogenetics.
Genome Biol Evol 2011, 3:1312–1323.
46. Department of Energy’s Joint Genome Institute, Center for Integrative
Genomics: Phytozome; 2014.
47. Fluidigm Corp.: Access Array TM System; 2014.
48. Curk, F.;Ancillo, G.;Garcia-Lor, A.;Luro, F.;Navarro, L.;Ollitrault, P.;
Multilocus SNPs analysis allows phylogenetic assignation of DNA
fragments to decipher the interspecific mosaic genome structure of
cultivated citrus; Plant Genome Evolution 2011 , 4–6 Sep 2011, P2.1572
[ />49. Life Sciences Corp.: Using Multiplex Identifier (MID) Adaptors for the GS
FLX Titanium Chemistry - Extended Mid Set. Technical Bulletin Genome
Sequencer FLX System 2009, 005:1–7.
50. Life Sciences Corp.: Amplicon Fusion Primer Design Guidelines for GS FLX
Titanium Series Lib-A Chemistry. Technical Bulletin Genome Sequencer FLX
System 2009, 013:1–3.
51. PRINSEQ: PReprocessing and INformation of SEQuence data: Easy and
rapid quality control and data preprocessing; rceforge.
net/index.html. 2012.
Page 18 of 19
52. Life Sciences Corp.: 454 Sequencing System Software Manual, v 2.5.3;
Part C – GS De Novo Assembler, GS Reference Mapper, SFF Tools. 454
Sequencing System Software Manual 2010:2–213.
53. DNASTAR Inc.: DNASTAR Sofware for life Scientists; star.
com/t-nextgen-seqman-ngen.aspx. 2014.
54. Wright S: Variability Within and Among Natural Populations. In Evolution
and the Genetics of Populations. Volume 4. Anonymous Chicago, IL: The
University of Chicago Press; 1978.
55. Belkhir K, Borsa P, Chikhi L, Raufaste N, Bonhomme F: GENETIX 4.05, logiciel
sous Windows TM pour la génétique des populations. Laboratoire
Génome, Populations, Interactions, CNRS UMR 5000 1996–2004, (Université de
Montpellier II, Montpellier (France).).
56. Dereeper A, Nicolas S, Lecunff L, Bacilieri R, Doligez A, Peros JP, Ruiz M,
This P: SNiPlay: a web-based tool for detection, management and
analysis of SNPs. Application to grapevine diversity projects. BMC
Bioinformatics 2011, 12(1):134.
57. Dereeper A, Nicolas S, Lecunff L, Bacilieri R, Doligez A, Peros JP, Ruiz M,
This P: 2013, 2014.
58. Perrier X, Jacquemoud-Collet JP: DARwin software. 2006, (http://darwin.
cirad.fr/).
59. Tamura K, Stecher G, Peterson D, Filipski A, Kumar S: MEGA6: Molecular
Evolutionary Genetics Analysis version 6.0. Mol Biol Evol 2013,
30(12):2725–2729.
60. Van Berloo R: GGT 2.0: versatile software for visualization and analysis of
genetic data. J Hered 2008, 99(2):232–236.
61. Pritchard Lab SU: Structure Software; />structure.html 2014.
62. Pritchard JK, Stephens M, Donnelly P: Inference of population structure
using multilocus genotype data. Genetics 2000, 155(2):945–959.
63. Falush D, Stephens M, Pritchard JK: Inference of population structure
using multilocus genotype data: linked loci and correlated allele
frequencies. Genetics 2003, 164(4):1567–1587.
64. Evanno G, Regnaut S, Goudet J: Detecting the number of clusters of
individuals using the software STRUCTURE: a simulation study. Mol Ecol
2005, 14(8):2611–2620.
65. Herrero R, Asins MJ, Pina JA, Carbonell EA, Navarro L: Genetic diversity in
the orange subfamily Aurantioideae. II. Genetic relationships among
genera and species. Theor Appl Genet 1996, 93(8):1327–1334.
66. Froelicher Y, Mouhaya W, Bassene JB, Costantino G, Kamiri M, Luro F,
Morillon R, Ollitrault P: New universal mitochondrial PCR markers reveal
new information on maternal citrus phylogeny. Tree Genetics and
Genomes 2011, 7(1):49–61.
67. Uzun A, Yesiloglu T, Polat I, Aka-Kacar Y, Gulsen O, Yildirim B, Tuzcu O, Tepe
S, Canan I, Anil S: Evaluation of Genetic Diversity in Lemons and Some of
Their Relatives Based on SRAP and SSR Markers. Plant Mol Biol Report
2011, 29(3):693–701.
68. Uzun A, Yesiloglu T, Aka-Kacar Y, Tuzcu O, Gulsen O: Genetic diversity
and relationships within Citrus and related genera based on
sequence related amplified polymorphism markers (SRAPs). Sci Hortic
2009, 121(3):306–312.
69. Bayer RJ, Mabberley DJ, Morton C, Miller CH, Sharma IK, Pfeil BE, Rich S,
Hitchcock R, Sykes S: A molecular phylogeny of the orange subfamily
(Rutaceae: Aurantioideae) using nine cpDNA sequences. Am J Bot 2009,
96(3):668–685.
70. Roose ML, Federici CT, Mu L, Kwok K, Vu C: Map-based ancestry of sweet
orange and other citrus variety groups. Gentile A, Tribulato E eds Second
International Citrus Biotechnology Symposium, 28 Tremestieri Etneo. Italy:
Emme Erre Grafica; 2009.
71. Ollitrault F, Terol J, Pina JA, Navarro L, Talon M, Ollitrault P: Development of
SSR markers from Citrus clementina (Rutaceae) BAC end sequences and
interspecific transferability in Citrus. Am J Bot 2010, 97(11):e124–e129.
72. Webber HJ: Cultivated varieties of citrus. In The Citrus Industry. History,
World Distribution, Botany andVarieties, Volume Volume 1. University of
California Press edition. Edited by Anonymous California. ; 1943:475–668.
73. de Moraes A, dos Santos Soares Filho W, Guerra M: Karyotype diversity and
the origin of grapefruit. Chromosome Research 2007, 15(1):115–121.
74. Scora RW, Kumamoto J, Soost RK, Nauer EM: Contribution to the origin of
the grapefruit Citrus paradisi (Rutaceae). Syst Bot 1982, 7:170–177.
75. Gallesio G: Traité du citrus: Louis Fantin ed. Paris: Chez Louis Fantin Libraire; 1811.
76. Chen LG, Omura M, Hidaka T: A study on the taxonomy of citrus with GOT
isozymes. Acta Horticulturae Sinica 1991, 18(1):27–32.
Curk et al. BMC Genetics (2014) 15:152
Page 19 of 19
77. Federici CT, Roose ML, Scora RW: RFLP analysis of the origin of Citrus bergamia,
Citrus jambhiri, and Citrus limonia. Acta Horticult 2000, 535:55–62.
78. Li X, Xie R, Lu Z, Zhou Z: The origin of cultivated citrus as inferred from
internal transcribed spacer and chloroplast DNA sequence and amplified
fragment length polymorphism fingerprints. J Am Soc Hortic Sci 2010,
135(4):341–350.
Submit your next manuscript to BioMed Central
and take full advantage of:
• Convenient online submission
• Thorough peer review
• No space constraints or color figure charges
• Immediate publication on acceptance
• Inclusion in PubMed, CAS, Scopus and Google Scholar
• Research which is freely available for redistribution
Submit your manuscript at
www.biomedcentral.com/submit