Genome-wide association mapping of iron homeostasis in the maize association population
Bạn đang xem bản rút gọn của tài liệu. Xem và tải ngay bản đầy đủ của tài liệu tại đây (741.03 KB, 13 trang )
Benke et al. BMC Genetics (2015)16:1
DOI 10.1186/s12863-014-0153-0
RESEARCH ARTICLE
Open Access
Genome-wide association mapping of iron
homeostasis in the maize association
population
Andreas Benke, Claude Urbany and Benjamin Stich*
Abstract
Background: Iron (Fe) deficiency in plants is the result of low Fe soil availability affecting 30% of cultivated soils
worldwide. To improve our understanding on Fe-efficiency this study aimed to (i) evaluate the influence of two
different Fe regimes on morphological and physiological trait formation, (ii) identify polymorphisms statistically
associated with morphological and physiological traits, and (iii) dissect the correlation between morphological and
physiological traits using an association mapping population.
Results: The fine-mapping analyses on quantitative trait loci (QTL) confidence intervals of the intermated B73×Mo17
(IBM) population provided a total of 13 and 2 single nucleotide polymorphisms (SNPs) under limited and adequate Fe
regimes, respectively, which were significantly (FDR = 0.05) associated with cytochrome P450 94A1, invertase
beta-fructofuranosidase insoluble isoenzyme 6, and a low-temperature-induced 65 kDa protein. The genome-wide
association (GWA) analyses under limited and adequate Fe regimes provided in total 18 and 17 significant SNPs,
respectively.
Conclusions: Significantly associated SNPs on a genome-wide level under both Fe regimes for the traits leaf necrosis
(NEC), root weight (RW), shoot dry weight (SDW), water (H2 O), and SPAD value of leaf 3 (SP3) were located in genes or
recognition sites of transcriptional regulators, which indicates a direct impact on the phenotype. SNPs which were
significantly associated on a genome-wide level under both Fe regimes with the traits NEC, RW, SDW, H2 O, and SP3
might be attractive targets for marker assisted selection as well as interesting objects for future functional analyses.
Keywords: Fe-efficiency, Association mapping population, Fine-mapping, Genome-wide association, Marker assisted
selection
Background
Iron (Fe) deficiency in plants is the result of a low Fe
availability which might be induced by lime-chlorosis that
affects 30% of cultivated soils worldwide [1]. As an adaptation to the sparingly available Fe, plants evolved two
different strategies to mobilize and uptake Fe [2]. Dicotyledonous and non graminaceous plant species acquire Fe
by the so-called strategy I mechanism [3]. The characteristic of this strategy is the release of protons into the
rhizosphere that facilitate the mobilization and subse-
*Correspondence:
Max Planck Institute for Plant Breeding Research, Carl-von-Linné Weg 10,
50829 Köln, Germany
quent reduction of Fe(III) to Fe(II) via a plasma membrane bound Fe(III) chelate reductase [4]. The soluble
Fe(II) is finally taken up by the iron regulated transporter
1 (IRT1) [5].
For the crop plants which are graminaceous plant
species such as barley, rice, and maize, Fe is acquired
using the so-called strategy II [6]. Characteristic for this
strategy is the release of non proteinogenic compounds
named phytosiderophores. These compounds chelate the
Fe(III) in the rhizosphere. Phyto-siderophore-Fe(III) complexes are transported by the specific transporter yellow
stripe 1 (YS1) into the plant [7]. It was shown by [2]
that the amount of exudated phytosiderophores is crucial
for a chlorosis tolerance and therefore, Fe-efficient plant.
© 2015 Benke et al.; licensee BioMed Central. This is an Open Access article distributed under the terms of the Creative Commons
Attribution License ( which permits unrestricted use, distribution, and reproduction
in any medium, provided the original work is properly credited. The Creative Commons Public Domain Dedication waiver
( applies to the data made available in this article, unless otherwise stated.
Benke et al. BMC Genetics (2015)16:1
Page 2 of 13
However, for an Fe-efficient genotype, the balance of Fe
dependent systems like Fe mobilization and uptake into
the plant and the homeostasis related mechanisms like
translocation and regulation of the Fe level in the cell to
avoid shortage or toxicity [8,9] is essential.
To improve our understanding of the mechanisms
which are responsible for Fe-efficiency in maize, two
different methods have been applied so far. The RNASequencing approach used by [10] focused on genes which
were differentially expressed between the Fe-efficient and
inefficient inbred lines under sufficient and deficient
Fe regimes. This study provided a tremendous amount
of putative candidate genes for Fe-efficiency. The same
inbred lines were used for the establishment of the intermated B73 × Mo17 (IBM) segregating population [11].
Benke et al., 2014 [12] observed a considerable phenotypic variation for Fe-efficiency in this population which
was used to map quantitative trait loci (QTL). An alternative to linkage mapping is association mapping which has
the potential to provide a higher mapping resolution as
well as allows the evaluation of a higher number of alleles
at a time. To our knowledge, no genome-wide association study has been conducted to dissect Fe-efficiency in
maize.
The objectives of our study were to (i) evaluate the
influence of different Fe regimes on morphological and
physiological trait formation, (ii) identify polymorphisms
statistically associated with morphological and physiological traits, and (iii) dissect the correlation between morphological and physiological traits using an association
mapping population.
Results
The repeatability (H 2 ) of the examined traits ranged for
the whole set of phenotyped inbred lines from 0.53 (H2 O)
to 0.72 (SP3, SP4, and RL) under the Fe-deficient regime
(Table 1). H 2 of the traits evaluated under the Fe-sufficient
regime varied between 0.47 (H2 O) and 0.87 (SP4).
The adjusted entry means (AEM) were calculated for
all physiological and morphological traits under consideration of the block effects for each Fe regime (Figure 1).
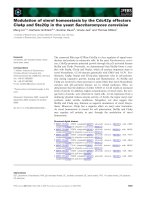
No variation was observed for BTR under the Fesufficient regime. For NEC, no significant (α = 0.05)
difference between both Fe regimes was found. The
remaining morphological and physiological traits except
H2 O showed a significant (α = 0.05) lower trait value
under the Fe-deficient regime in comparison to the
Fe-sufficient regime. For H2 O the opposite trend was
observed.
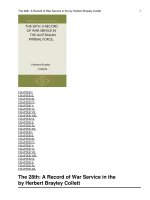
The lowest pairwise correlation coefficient was with
r = 0.17 observed between H2 O and LAT under the
Fe-deficient regime (Figure 2). By comparison, for the
Fe-sufficient regime, the higher positive correlation coefficient was observed between SDW/SL and SDW (r = 0.96)
and the lowest between RL and RW (r = 0.23).
In the ASMP, the population structure explained
on average 2.02% of the phenotypic variation with a
minimum of 0.08% (SL) and a maximum of 5.32%
(RL) under the Fe-deficient regime (Additional file 1:
Table S1). Under the Fe-sufficient regime, the population structure accounted on average for 2.42% of
the phenotypic variation ranging from 0.35% (SDW) to
5.09% (RL).
Table 1 Traits recorded in the current study for two deficient and sufficient iron (Fe) regimes, where H2 is the
repeatability on an entry means basis for the association mapping population
H2
Trait
Abbreviation
Unit
Fe-deficient
Fe-sufficient
SPAD value at leaf 3
SP3
SPAD units
0.72
0.86
SPAD value at leaf 4
SP4
SPAD units
0.72
0.87
SPAD value at leaf 5
SP5
SPAD units
0.68
0.81
SPAD value at leaf 6
SP6
SPAD units
0.68
0.77
Root length
RL
cm
0.72
0.62
Root weight
RW
g
0.59
0.47
Shoot length
SL
cm
0.63
0.57
0.65
Shoot dry weight
SDW
g
0.65
Shoot water content
H2 O
%
0.53
0.44
Ratio of dry shoot weight
SDW/SL
g/cm
0.68
0.71
Branching at the terminal 5 cm
BTR
score 1 - 9
0.68
1
Lateral root formation
LAT
score 1 - 9
0.68
0.58
Leaf necrosis
NEC
score 1 - 9
0.61
0.71
compared to shoot length
1
no variation observed.
Benke et al. BMC Genetics (2015)16:1
Page 3 of 13
Figure 1 Boxplot of the adjusted entry means for the association mapping population of 267 maize inbred lines evaluated at Fe-deficient
and Fe-sufficient regimes represented in white and gray, respectively. T-test was applied to examine the difference of a trait between both Fe
conditions. ***: P = 0.05, 0.01, and 0.001, respectively; ns, not significant.
The QTL fine-mapping (FM) analyses resulted in total
in 13 significant (FDR = 0.05) SNPs detected in QTL confidence intervals of the IBM population where NEC QTL1
comprised the highest amount (4) under the Fe-deficient
regime (Table 2, Figure 3). The highest proportion of phenotypic variance was explained by a SNP in QTL3 of RW
(8.47%). The maximum proportion of phenotypic variance
explained in a simultaneous fit by all SNPs in a QTL confidence interval was 11.45% (QTL8 SP3) and the minimum
was 0.39% (QTL4 RW).
Under the Fe-sufficient regime, the QTL FM analyses revealed in total two significant (FDR = 0.05) SNPs
Benke et al. BMC Genetics (2015)16:1
Page 4 of 13
Figure 2 Pairwise correlation coefficients calculated between all pairs of traits collected for the association mapping population. The
values above the diagonal represent the correlation coefficients between the adjusted entry means (AEM) of the Fe-deficient regime. The values
below the diagonal represent the correlation coefficients between the AEM of the Fe-sufficient regime.
for SP4 QTL1 (Table 2, Figure 3). The maximum proportion of phenotypic variance of SNPs was 6.32%. The
phenotypic proportion was 10.31% for both SNPs in a
simultaneous fit.
The genome-wide association (GWA) analyses of the
traits examined in the Fe-deficient regime provided in
total 18 significant SNPs (FDR = 0.05) where NEC showed
with 12 SNPs the highest number (Table 3, Figure 3,
Additional file 2: Figure S1;A, Additional file 3: Figure
S3;A). The proportion of phenotypic variance explained
by a SNP showed for RL (18.81%) the highest value. The
proportion of phenotypic variance explained in a simultaneous fit by all SNPs for one trait was maximal for RW
(34.65%) and minimal for SDW (13.01%).
The GWA analyses under the Fe-sufficient regime
revealed in total 17 significant (FDR = 0.05) SNPs where
H2 O (9) included the highest number (Table 3, Figure 3,
Additional file 4: Figure S2;A, Additional file 5: Figure S4;
A). The proportion of the explained phenotypic variance
was highest for H2 O (21.21%). In a simultaneous fit of all
Fe regime
Trait
QTL
Deficient
NEC
QTL1
Marker
locus
Chr.
Position
(bp)
Interval
(cM)
P-value
Allele Effect
1/2 Allele 1-2 % r2
QTL3
1
28,643,309 205.0 - 208.5 8.2e-05
G/A
0.43
6.04
GRMZM2G040828
Q9LVS3
Pentatricopeptide repeat-containing protein At5g47360
1
28,643,428 205.0 - 208.5 1.7e-04
G/A
0.41
5.43
GRMZM2G040828
Q9LVS3
Pentatricopeptide repeat-containing protein At5g47360
S1_28765554
1
28,765,554 205.0 - 208.5 1.7e-04
A/G
0.42
5.51
GRMZM2G036257
O81117
Cytochrome P450 94A1
S1_28765627
1
28,765,627 205.0 - 208.5 1.5e-04
G/A
0.39
4.96
GRMZM2G036257
O81117
Cytochrome P450 94A1
S5_3733903
5
3,733,903
73.3 - 74.4
2.1e-04
C/T
-3.87
8.47
GRMZM2G701295
GRMZM2G350471
Q75HK3
Expressed protein
S5_3783037
5
3,783,037
73.3 - 74.4
1.2e-03
C/G
0.60
0.18
GRMZM2G350428
Q6AV48
CLE family OsCLE305 protein
5.29
8.67
QTL4 S5_180440433
5
180,440,433 410.8 - 413.6 3.0e-04
C/G
0.27
0.04
S5_181192685
5
181,192,685 410.8 - 413.6 2.3e-04
T/C
0.24
0.03 AC205703.4_FG005 Q8GUM4
Simultaneous fit
SDW/SL QTL1 S8_165976755
QTL8
8
165,976,755 464.0 - 466.5 6.0e-05
C/T
-7.09
S9_26961652
9
26,961,652 220.7 - 223.9 5.7e-06
A/T
5.85
7.92
S9_37654085
9
37,654,085 220.7 - 223.9 1.4e-04
C/T
6.16
5.56
S9_45093751
9
45,093,751 220.7 - 223.9 4.6e-05
A/G
4.20
QTL3 S1_256662971
SP4
GRMZM2G148773
6.78
GRMZM2G156218
F4K975
Sec14p-like phosphatidylinositol transfer family protein
GRMZM2G177084
Q9FG31
Late embryogenesis abundant protein 4-5
GRMZM2G055037
Q3E8H0
S-ribonuclease binding protein
11.45
1
256,662,971 825.8 - 833.0 1.2e-04
G/A
9.88
Simultaneous fit
Sufficient
6.87
6.87
Simultaneous fit
SP6
Uncharacterized membrane protein At3g27390
0.39
Simultaneous fit
SP3
Confirmed
Annotation
S1_28643309
Simultaneous fit
RW
Best hit
UniProt ID
S1_28643428
Simultaneous fit
RW
Gene
Benke et al. BMC Genetics (2015)16:1
Table 2 Single nucleotide polymorphism (SNP) markers significantly (FDR = 0.05) associated in the association mapping population which were located within
confidence intervals of QTL detected for the same trait in the IBM population [12]
5.82
5.82
QTL1 S1_256466020
1
256,466,020 833.0 - 839.3 7.8e-05
T/C
3.66
6.32
S1_257972883
1
257,972,883 833.0 - 839.3 1.1e-04
T/A
5.45
6.05
Simultaneous fit
10.31
% r2 is the proportion of the phenotypic variance explained by the SNP for the association mapping population.
Page 5 of 13
Benke et al. BMC Genetics (2015)16:1
Page 6 of 13
Figure 3 Summary of significant (FDR = 0.05) single nucleotide polymorphisms (SNPs) detected in confidence intervals of quantitative
trait loci (QTL) (red) of [12] and genome-wide SNPs association analyses (blue) using the association mapping population with respect to
the iron (Fe) regime 10 μM and 300 μM.
significant (FDR = 0.05) SNPs, proportion of the phenotypic variance maximally explained was 57.47% (H2 O) and
the minimum was 10.99% (SP3).
Under consideration of the global extent of LD, 18 and
9 unique genes were linked to the significantly (FDR =
0.05) associated SNPs under the Fe-deficient and Fesufficient regime, respectively (Tables 2 and 3). None
of the Sanger-sequenced genes evaluated in Additional
file 2: Figure S1 included SNPs that were significantly
(FDR = 0.05) associated with the morphological and
physiological traits.
Discussion
Environmental factors such as pH variation in the soil,
temperature, water stress, and mineral concentration
effects have a strong influence on Fe availability for
plants [2]. To reveal genotypic effects that contribute
to Fe-efficiency and avoid an overlap with other mineral nutrients, hydroponic culture has been proven to be
the method of choice providing standard environmental
conditions [13]. Such a culture has been used in our study
to examine the Fe-efficiency in a broad germplasm set of
maize.
Fe regime
Trait
Marker
locus
Chr.
Position
(bp)
Deficient
NEC
P-value
Allele
1/2
S1_276695950
1
S2_3229998
2
Effect
Allele 1-2
276,695,950
7.0e-07
G/A
0.91
10.58
3,229,998
9.4e-08
T/A
1.51
12.39
H2 O
Confirmed
Annotation
GRMZM2G018692
Q56UD0
Beta-fructofuranosidase, insoluble isoenzyme 6
GRMZM2G168163
Q9SX79
Polyadenylate-binding protein RBP47C
2
28,932,171
4.4e-08
A/T
1.55
13.03
2
111,136,826
1.5e-06
A/G
1.16
10.08
S2_186894397
2
186,894,397
9.0e-07
C/T
0.81
10.63
S3_1772101
3
1,772,101
7.4e-07
A/G
0.83
10.89
S5_23763641
5
23763641
1.4e-06
C/G
1.04
10.50
GRMZM2G376743
Q04980
Low-temperature-induced 65 kDa protein
S5_48571692
5
48,571,692
1.5e-09
T/C
1.16
14.68
GRMZM5G848124
Q851X4
Expressed protein
S5_168028100
5
168,028,100
1.1e-06
C/G
1.34
10.08
S5_174017789
5
174,017,789
1.6e-07
C/T
0.89
11.09
GRMZM2G460958
Q9LRB7
E3 ubiquitin-protein ligase EL5
S5_175221001
5
175,221,001
1.2e-07
T/G
1.28
11.52
GRMZM2G128029
Q2R2T4
CASP-like protein Os11g0549625
S7_106685037
7
106,685,037
1.0e-06
T/G
1.21
10.05
4
167,072,278
3.7e-10
C/A
-6.23
18.81
GRMZM2G015049
Q9LR00
SAUR-like auxin-responsive protein
S4_167072278
30.78
S6_160330734
6
160,330,734
1.5e-07
C/G
-3.67
13.63
S6_164144405
6
164,144,405
6.0e-07
T/C
-4.78
12.73
GRMZM2G377613
P23923
Transcription factor HBP-1b(c38)
S7_173225158
7
173,225,158
4.4e-07
G/T
-4.31
13.69
GRMZM2G381386
F4II36
RING-finger, DEAD-like helicase, PHD and SNF2 domain
34.65
S9_28406038
9
28,406,038
7.0e-10
C/T
-0.72
16.35
S9_29869940
9
29,869,940
1.7e-07
T/C
-0.62
11.44
S1_43769442
1
43,769,442
1.6e-06
A/G
3.00
13.52
Simultaneous fit
Sufficient
Best hit
UniProt ID
S2_28932171
Simultaneous fit
SDW
Gene
S2_111136826
Simultaneous fit
RW
% r2
Benke et al. BMC Genetics (2015)16:1
Table 3 Single nucleotide polymorphism (SNP) markers significantly (FDR = 0.05) associated with traits evaluated under Fe-deficient and the Fe-sufficient iron
regime
13.01
10
5,846,137
5.4e-07
C/A
3.59
14.81
2
209,283,962
1.4e-06
G/T
2.27
14.06
S2_220878478
2
220,878,478
4.7e-08
C/T
2.99
16.30
S3_28612747
3
28,612,747
7.7e-07
T/C
2.75
14.90
S4_230588662
4
230,588,662
1.2e-06
G/A
1.91
14.11
GRMZM2G038588
Q54N48
Protein CLP1 homolog
S5_60131644
5
60,131,644
1.3e-06
A/T
2.38
13.80
GRMZM2G097683
Q9XGX0
Putative zinc finger protein SHI
S6_131544420
6
131,544,420
8.4e-12
T/C
5.04
21.21
S6_164852452
6
164,852,452
7.2e-07
G/A
-0.10
0.16
GRMZM2G030305
Q5SN53
Mitogen-activated protein kinase 8
Page 7 of 13
S10_5846137
S2_209283962
Simultaneous fit
RW
57.47
S1_46679288
1
46,679,288
3.3e-09
C/G
S1_80919352
1
80,919,352
6.4e-08
A/C
S1_82391496
1
82,391,496
2.5e-10
G/A
-12.59
20.69
GRMZM2G455809
-9.18
17.60
GRMZM2G087878
-12.76
20.72
S6_88996310
6
88,996,310
6.7e-07
C/T
-7.87
15.38
S7_108322405
7
108,322,405
1.8e-06
T/C
0.58
0.15
S9_42004118
9
42,004,118
9.8e-07
G/A
0.63
0.86
S9_49309187
9
49,309,187
5.4e-07
C/G
-9.48
15.71
5
25,511,041
7.9e-08
A/C
-4.41
10.99
Simultaneous fit
SP3
S5_25511041
P50160
Sex determination protein tasselseed-2
Q9ATL7
Aquaporin TIP3-1
GRMZM2G439598
GRMZM2G040605
Benke et al. BMC Genetics (2015)16:1
Table 3 Single nucleotide polymorphism (SNP) markers significantly (FDR = 0.05) associated with traits evaluated under Fe-deficient and the Fe-sufficient iron
regime (Continued)
38.93
Simultaneous fit
GRMZM2G305446
10.99
% r2 is the proportion of the phenotypic variance explained by the SNP for the association mapping population.
Page 8 of 13
Benke et al. BMC Genetics (2015)16:1
Dissection of phenotypic diversity and relation between
the examined traits
We observed for all traits moderate to high repeatabilities
under both Fe regimes (Table 1). This finding indicated
that the genetic contribution to variation was minimally
covered by experimental variation of hydroponics which
in turn increases the power of the genetic dissection of
Fe-efficiency by association mapping methods.
We observed, under the Fe-deficient regime, variation for the trait BTR (Figure 1). Long et al. 2010 [14]
revealed an Fe sensing gene named POPEYE in Arabidopsis roots during Fe-deficiency. Their finding indicated
that Fe deficiency sensing mechanisms regulate terminal root branching. However, in contrast to Arabidopsis
[14], in maize the mechanism of root branching under
Fe-deficiency is not yet understood.
The whole set of traits evaluated in one Fe regime
showed mostly moderate to high pairwise correlations
(Figure 2). This finding suggests that for each of the Fesufficient and Fe-deficient regimes most of the examined
traits have a joint regulation. One of the few exception
was the correlation between leaf necrosis and water content, which was only observed in the Fe-sufficient regime.
This positive correlation might be caused by a nutrient
distortion, also known as concentration effect [2].
Marker-phenotype associations for QTL confidence
intervals and on genome-wide scale
Using the ASMP we were able to validate 13% and 3%
of detected QTLs from our former study [12] for Fedeficient and Fe-sufficient regimes, respectively. Among
the SNPs that were located within QTL confindence
intervals [12], we identified a SNP (S1_28765627) in the
cytochrome P450 94A1 (CYP94A1) (GRMZM2G036257)
gene that was significantly associated with NEC (Table 2).
CYP94A1 is responsible for modifying lipophilic compounds like fatty acids [15]. Its involvement in plant
development, repair, and defense [15] might indicate the
contribution of stress response mechanisms during Fedeficiency. Furthermore, cytochrome P450 family proteins might also play a role in Fe sensing [16] as Fe is
incorporated into a heme group of the cytochrome P450
proteins [17].
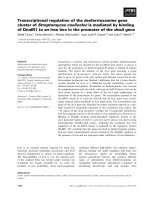
We observed under the Fe-deficient regime several
genes to be associated with NEC (Figure 4) and RW
that are mechanistically involved in regulation of stress
response (Table 3). A subset of these genes includes
the invertase beta-fructofuranosidase insoluble isoenzyme 6 (NEC,GRMZM2G018692) [18], low-temperatureinduced 65 kDa protein (NEC,GRMZM2G376743) [19],
and the late embryogenesis abundant protein 4-5
(SP3,GRMZM2-G177084) [20]. O’Rourke et al., 2007 [21]
showed that these genes are responsible for the universal stress response caused by Fe-deficiency, although they
Page 9 of 13
do not bind or incorporate Fe in their protein structure.
This suggested that these genes are important to maintain
the viability of the plant due to stress prevention caused
by Fe-deficiency. Furthermore, significant associations for
NEC might indicate that this trait is genetically less complex than Fe-chlorosis as for the SPAD value related traits
no significant association could have been detected under
the Fe-deficient regime.
We did not observe a clear clustering of genotypes with high NEC values in the individual subgroups. Furthermore, when examing the subgroups individually (Additional file 1: Table S1), we detected no
significant associations neither for NEC nor for RW
under both Fe regimes (data not shown). Additionally, excluding genotypes with a higher NEC susceptibility from the association analysis changed the results
only marginally compared to the analyses with all
genotypes. These results suggested that the concentration effect does not influence the conclusions of our
study.
Despite the variation observed for BTR under the Fedeficient regime, no significant associations have been
detected. Therefore, further research is required on the
genetics of BTR. In that context, the genes identified
in our companion study [10] using an RNA sequencing
approach can be promising starting points.
In our study, genes, known being mechanistically
involved in strategy II related processes for Fe mobilization, uptake and storage, were resequenced (Additional
file 6: Table S2). For polymorphisms in these genes,
no significant associations were detected for both Fe
regimes. This finding could be explained by a correlation of allele frequency of the mechanistically involved
genes and population structure as was observed previously for flowering time and Dwarf8 [22,23]. As we
did not observe a strong correlation between population structure and phenotypic variation of the studied
traits this explanation is not likely to be true (Additional
file 1: Table S1). The reason could be that these mechanistically involved genes have been identified by mutant
screening only and that natural genetic variation at these
genes leads to evolutionary disadvantages. Therefore,
only neutral polymorphisms with respect to the phenotype are observed in the maize ASMP. This might
reflect purified selection of these adaptive genes that does
not contribute to phenotypic variation of quantitative
trait [24].
An overlap between associated SNPs of traits were
not observed putatively due to minor effect associations and a stringent significance thresholds applied in
our study. Nevertheless, significant association of SNPs
and their corresponding genes as described above provide an insight in the genetic architecture of biological
processes characteristic for each trait that is in a direct
Benke et al. BMC Genetics (2015)16:1
Page 10 of 13
Figure 4 Genome-wide P values for association analysis of NEC under the Fe-deficient regime using 267 maize inbred lines of the
association mapping population. The horizontal line corresponds to a nominal significance threshold of 5% considering the Benjamini Hochberg
correction for multiple testing.
relation to Fe-homeostasis. However, association mapping analyses provide only an indirect statistical evidence
for a contribution of the considered allele to phenotypic
variation [25] a direct functional validation is indispensable. Furthermore, additional traits like protein and transcriptome expression profiling could be performed on
the association mapping population to further dissect
Fe-homeostasis.
Conclusions
The QTL confidence intervals of the traits NEC, RW,
SDW/SL, SP3, SP4, and SP6, from a previous study contained hundreds of genes and millions of base pairs. A
dissection of these QTL confidence intervals using association mapping methods allowed a confirmation of the
previously detected QTLs as well as the fine-mapping. In
addition, our study described SNPs which were significantly associated on a genome-wide level under both Fe
regimes with the traits NEC, RW, SDW, H2 O, and SP3.
Several of these SNPs were located in genes (coding) or
recognition sites (non-coding) of transcriptional regulators, which indicates a direct impact on the phenotype.
Beside being attractive targets for marker assisted selection, these loci are interesting objects for future functional
analyses.
Methods
Plant material
A set of 302 maize inbred lines representing world-wide
maize diversity [26] was used as association mapping
population (ASMP) in the current study. Due to the
unavailability of sufficient amounts of seeds for 35 inbred
lines, a final set of 267 inbred lines was evaluated in the
frame of this study (Additional file 7: Table S4).
Culture conditions and evaluated traits
Maize seeds were sterilized with 60°C hot water for 30
minutes. Afterwards, seeds were placed between two filter paper sheets moistened with saturated CaSO4 solution
for germination in the dark at room temperature. After 6
days, the germinated seeds were transplanted to a continuously aerated nutrient solution with nutrient concentrations as described by [27]. The plants were supplied with
100 μM Fe(III)-EDTA for 7 days. From day 14 to 28, plants
Benke et al. BMC Genetics (2015)16:1
were cultured at 10 (Fe-deficient) and 300 (Fe-sufficient)
μM iron regimes. The nutrient solution was exchanged
every third day. Plants were cultivated from day 7 to day
28 in a growth chamber at a relative humidity of 60%, light
intensity of 170 μmol m−2 s−1 in the leaf canopy, and a
day-night temperature regime of 16 h/24°C and 8 h/22°C,
respectively.
Each genotype was grown in one shaded pot of 600
milliliter volume. All pots of one Fe regime were arranged
in an alpha lattice design with 13 incomplete blocks. The
entire experiment was replicated b = 3 times for the
Fe-deficient and sufficient regime, respectively.
Under both Fe regimes, the following traits were evaluated: the relative chlorophyll content of the 3rd, 4th, 5th,
and 6th leaf (SP) measured with a SPAD meter (Minolta
SPAD 502). Branching at the terminal 5 cm of the root
(BTR) was evaluated with 1 for strong presence and 9 for
absence of terminal root branching. Leaf necrosis (NEC)
was recorded as a visual score on a scale from 1 for high
trait expression and 9 for low trait expression. The lateral root formation (LAT) was recorded on a scale from
1 for absence to 9 for high trait expression. Furthermore,
root length (RL), root weight (RW), shoot length (SL),
shoot dry weight (SDW), water content (H2 O) as well as
the ratio between SDW and SL (SDW/SL) was according
to [12].
In our study, the data collected in this way for both
Fe regimes were not directly combined to calculate a
response variable for each trait in order to avoid problems related to error propagation. Instead, we followed
examples from the literature and analysed data from the
regimes individually but compared the results afterwards.
SNP marker data
A data set with 437,650 SNP markers for the ASMP is
publicly available from . If for one
SNP more than 20% of the marker information across all
inbreds was unknown or denoted as missing data, this
mSNP was skipped from the following analyses. Furthermore, SNPs with minor allele frequency lower than 2.5%
were excluded from the following analyses.
Sequence analysis
A set of 16 candidate genes for mobilization, uptake,
storage, and transport of Fe as well as regulatory function on these processes was selected for sequence analyses to detect additional polymorphisms compared to
the above mentioned SNP data set (Additional file 2:
Figure S1). Primers for candidate genes were designed
using software Primer3 [28] (Additional file 8: Table S3).
Each region of the candidate gene sequence was PCR
amplified for the ASMP. PCR products were sequenced
by the DNA core facility of the Max-Planck-Institute
for Plant Breeding Research on Applied Biosystems
Page 11 of 13
(Weiterstadt, Germany) Abi 3730XL sequencers using
BigDye-terminator v3.1 chemistry. Premixed reagents
were from Applied Biosystems. The gene sequences were
aligned with the software ClustalW2 (http://download.
famouswhy.com/clustalw2/) and edited with BioLign
( manually. The
SNPs were filtered as described above and the remaining 562 SNPs were added to the above mentioned set of
genome-wide distributed SNPs.
Statistical analyses
Phenotypic data analyses: The traits collected at each Fe
regime were analyzed using the following mixed model:
yikm = μ + gi + rk + bkm + eikm ,
where yikm is the ith genotype of the kth replication in
the mth incomplete block, μ the general mean, gi the
effect of the ith genotype, rk the effect of the kth replication, bkm the effect of the mth incomplete block in the
kth replication, and eikm the residual error. To estimate
adjusted entry means (AEM) for all inbreds at each of
two Fe regimes, we considered g as fixed as well as r
and b as random. Furthermore, we considered g, r, and b
as random to estimate the genotypic (σg2 ) and the error
variance (σe2 ).
The repeatability H 2 for each Fe regime was calculated
as:
σg2
H2 =
.
σe2
2
σg +
b
The residuals for each trait under both Fe regimes were
tested with a Kolmogorov-Smirnov test [29] for their normal distribution. Pairwise correlation coefficients were
assessed between all pairs of traits for the ASMP. Student’s
t-tests were calculated for each trait to examine the significance of the difference between the Fe-deficient and
sufficient regimes.
Association analyses: The AEM of each trait for each Fe
regime were used to test their associations with each of the
287,390 SNP markers using the following mixed model:
Mip = μ + mp + gi∗ +
z
Qiu vu + eip ,
u=1
where Mip is the AEM of the ith maize inbred line carrying the pth allele, mp the effect of allele p, g ∗ i the residual
genetic effect of the ith inbred line, vu the effect of the
uth column of the population structure matrix Q [26],
and eip the residual [30]. The variance-covariance matrix
of the vector of random effects g ∗ = g ∗ 1 , . . . , g ∗ 267 was
assumed to be Var(g ∗ ) = 2Kσg2∗ , where K was a 267 ×
267 matrix of kinship coefficients among the ASMP [31],
and σg2∗ genetic variance estimated by REML. The relation
between the population structure and the morphological
Benke et al. BMC Genetics (2015)16:1
and physiological traits was estimated using the ‘EMMA’
R package [31].
Physical map positions of QTL confidence intervals
detected in the linkage mapping study of [12] were used
for fine-mapping.
Multiple testing was considered by applying the
[32] correction. The proportion of phenotypic variation explained by the significant SNPs was computed
according to [33].
For each SNP of the marker set, the information about
the physical map position was available. The extent of
linkage disequilibrium in the maize ASMP which was estimated by [34] was used to determine the genes which
are linked to the detected SNP in the association analysis:
up and downstream of a significant association the genes
included in the region 2,000 base pairs were extracted
from the filtered gene set of the maize genome sequence
version 5b.
If not stated differently, all analyses were performed
using statistical software R [35].
Additional files
Additional file 1: Table S1. Phenotypic variation (%r2 ) explained by
population structure and by kinship for the entire association mapping
population set.
Additional file 2: Figure S1. Genome-wide P values for association
analysis under the Fe-sufficient regime using 267 maize inbred lines of the
association mapping population. The horizontal line corresponds to a
nominal significance threshold of 5% considering the Benjamini Hochberg
correction for multiple testing. Traits with significant SNPs are represented:
shoot water content (H2 O;A), root weight (RW;B), and SPAD value of leaf 3
(SP3;C).
Additional file 3: Figure S3. Expected P values on the horizontal axis and
observed P values on the vertical axis for the QQ plot analysis under the
Fe-sufficient regime using 267 maize inbred lines of the association
mapping population. The red line corresponds to a normal distribution.
Traits with significant SNPs are represented: shoot water content (H2 O;A),
root weight (RW;B), and SPAD value of leaf 3 (SP3;C).
Additional file 4: Figure S2. Expected P values on the horizontal axis and
observed P values on the vertical axis for the QQ plot analysis under the
Fe-deficient regime using 267 maize inbred lines of the association
mapping population. The red line corresponds to a normal distribution.
Traits with significant SNPs are represented: leaf necrosis (NEC;A), root
weight (RW;B), and shoot dry weight (SDW;C).
Additional file 5: Figure S4. Genes sequenced in our study that are
reported in the literature to be involved in Fe-homeostasis of maize.
Additional file 6: Table S2. List of 267 maize genotypes comprising the
source history, pedigree information, and assigned subpopulation.
Additional file 7: Table S4. Primer list (forward: F; reverse: R) of
sequenced amplicons with base pair (bp) length in B73. The annealing
temperature (An. Temp) was empirically determined.
Additional file 8: Table S3. Genome-wide P values for association
analysis under the Fe-deficient regime using 267 maize inbred lines of the
association mapping population. The horizontal line corresponds to a
nominal significance threshold of 5% considering the Benjamini Hochberg
correction for multiple testing. Traits with significant SNPs are represented:
leaf necrosis (NEC;A), root weight (RW;B), and shoot dry weight (SDW;C).
Page 12 of 13
Competing interests
The authors declare that they have no competing interests.
Authors’ contributions
AB and CU carried out the hydroponic growth of maize genotypes, tissue
collection, and phenotype evaluation. AB analyzed the data. AB and BS drafted
the manuscript. All authors read and approved the manuscript.
Acknowledgments
We would like to thank the North Central Regional Plant Introduction Station
(NCRIPS) for providing seeds of the association mapping population. We also
thank Nicole Kliche-Kamphaus, Andrea Lossow, Nele Kaul, and Isabel Scheibert
for the excellent technical support. This work was supported by research
grants from the Deutsche Forschungsgemeinschaft (STI596/4-1 and
WI1728/16-1) and the Max Planck Society.
Received: 9 June 2014 Accepted: 25 September 2014
References
1. Mori S: Iron acquisition by plants. Curr Opin Plant Biol 1999, 2:250–253.
2. Marschner H: Mineral Nutrition of Higher Plants (Second Edition). UK:
Elsevier; 1995.
3. Curie C, Briat JF: Iron transport and signaling in plants. Annu Rev Plant
Biol 2003, 54:183–206.
4. Guerinot M: It’s elementary: Enhancing Fe3+ reduction improves rice
yields. Proc Nat Acad Sci USA 2007, 104:7311–7312.
5. Vert G, Grotz N, Dédaldéchamp F, Gaymard F, Guerinot M, Briat JF,
Curie C: IRT1, an Arabidopsis transporter essential for iron uptake
from the soil and for plant growth. Plant Cell 2002, 14:1223–1233.
6. Römheld V: Existence of two different strategies for the acquisition
of iron in higher plants. In Iron Transport in Microbes, Plants and Animals.
Edited by Winkelmann G, van der Helm D, Wiley-VCH. Federal Republic of
Germany; 1987:353–374.
7. Curie C, Panaviene Z, Loulergue C, Dellaporta S, Briat JF, Walker E: Maize
yellow stripe1 encodes a membrane protein directly involved in
FeIII uptake. Nature 2001, 409:346–349.
8. Kobayashi T, Nishizawa N: Iron uptake, translocation, and regulation
in higher plants. Annu Rev Plant Biol 2012, 63:131–152.
9. Lee S, Ryoo N, Jeon JS, Guerinot M, An G: Activation of rice Yellow
stripe1-like 16 (OsYSL16) enhances iron efficiency. Mol Cells 2012,
33:117–126.
10. Urbany C, Benke A, Marsian J, Huettel B, Reinhardt R, Stich B: Ups and
downs of a transcriptional landscape shape iron deficiency
associated chlorosis of the maize inbreds B73 and Mo17. BMC Plant
Biol 2013, 13:213.
11. Lee M, Sharopova N, Beavis W, Grant D, Katt M, Blair D, Hallauer A:
Expanding the genetic map of maize with the intermated B73 x
Mo17 (IBM) population. Plant Mol Biol 2002, 48:453–461.
12. Benke A, Urbany C, Marsian J, Shi R, von Wirén N, Stich B: The genetic
basis of natural variation for iron homeostasis in the maize IBM
population. BMC Plant Biol 2014, 14:12.
13. Nguyen V, Ribot S, Dolstra O, Niks R, Visser R, van der Linden C:
Identification of quantitative trait loci for ion homeostasis and salt
tolerance in barley (Hordeum vulgare L.). Mol Breeding 2013,
31:137–152.
14. Long T, Tsukagoshi H, Busch W, Lahner B, Salt D, Benfey P: The bHLH
transcription factor POPEYE regulates response to iron deficiency in
arabidopsis roots. Plant Cell 2010, 22:2219–2236.
15. Tijet N, Helvig C, Pinot F, Le Bouquin R, Lesot A, Durst F, Salaün JP,
Benveniste I: Functional expression in yeast and characterization of a
clofibrate-inducible plant cytochrome P-450 (CYP94A1) involved in
cutin monomers synthesis. Biochem J 1998, 332:583–589.
16. Colangelo E, Guerinot M: The essential basic helix-loop-helix protein
FIT1 is required for the iron deficiency response. Plant Cell 2004,
16:3400–3412.
17. Mizutani M, Ward E, Ohta D: Cytochrome p450 superfamily in
Arabidopsis thaliana: Isolation of cDNAs, differential expression,
and RFLP mapping of multiple cytochromes P450. Plant Mol Biol 1998,
37:39–52.
Benke et al. BMC Genetics (2015)16:1
Page 13 of 13
18. Cho JI, Lee SK, Ko S, Kim HK, Jun SH, Lee YH, Seong H, Lee KW, An G,
Hahn TR, Jeon JS: Molecular cloning and expression analysis of the
cell-wall invertase gene family in rice (Oryza sativa L.). Plant Cell Rep
2005, 24:225–236.
19. Nordin K, Vahala T, Palva E: Differential expression of two related,
low-temperature-induced genes in Arabidopsis thaliana (L.) Heynh.
Plant Mol Biol 1993, 21:641–653.
20. Hundertmark M, Hincha D: LEA (Late Embryogenesis Abundant)
proteins and their encoding genes in Arabidopsis thaliana.
BMC Genomics 2008:9–118. 9.
21. O’Rourke J, Charlson D, Gonzalez D, Vodkin L, Graham M, Cianzio S,
Grusak M, Shoemaker R: Microarray analysis of iron deficiency
chlorosis in near-isogenic soybean lines. BMC Genomics 2007:8–476. 8.
22. Van Inghelandt D, Melchinger A, Martinant JP, Stich B: Genome-wide
association mapping of flowering time and northern corn leaf
blight (Setosphaeria turcica) resistance in a vast commercial maize
germplasm set. BMC Plant Biol 2012:12–56. 12.
23. Larsson S, Lipka A, Buckler E: Lessons from Dwarf8 on the strengths
and weaknesses of structured association mapping. PLoS Genet 2013,
9:e1003246.
24. Benke A, Stich B: An analysis of selection on candidate genes for
regulation, mobilization, uptake, and transport of iron in maize.
Genome 2011, 54:674–683.
25. Andersen J, Lübberstedt T: Functional markers in plants. Trends Plant
Sci 2003, 8:554–560.
26. Flint-Garcia S, Thuillet AC, Yu J, Pressoir G, Romero S, Mitchell S, Doebley J,
Kresovich S, Goodman M, Buckler E: Maize association population: A
high-resolution platform for quantitative trait locus dissection. Plant
J 2005, 44:1054–1064.
27. von Wirén N, Marschner H, Römheld V: Roots of iron-efficient maize
also absorb phytosiderophore-chelated zinc. Plant Physiol 1996,
111:1119–1125.
28. Rozen S, Skaletsky H: Primer3 on the WWW for general users and for
biologist programmers. Methods Mol Biol (Clifton, N.J.) 2000,
132:365–386.
29. Chakravarti I, Laha R, Roy J: Handbook of Methods of Applied Statistics,
Volume I. New York: John Wiley and Sons; 1967.
30. Stich B, Möhring J, Piepho HP, Heckenberger M, Buckler E, Melchinger A:
Comparison of mixed-model approaches for association mapping.
Genetics 2008, 178:1745–1754.
31. Kang H, Zaitlen N, Wade C, Kirby A, Heckerman D, Daly M, Eskin E:
Efficient control of population structure in model organism
association mapping. Genetics 2008, 178:1709–1723.
32. Benjamini Y, Hochberg Y: Controlling the False Discovery Rate: A
Practical and Powerful Approach to Multiple Testing. J R Stat Soc. Ser
B (Methodological) 1995, 57:289–300.
33. Sun G, Zhu C, Kramer M, Yang SS, Song W, Piepho HP, Yu J: Variation
explained in mixed-model association mapping. Heredity 2010,
105:333–340.
34. Remington D, Thornsberry J, Matsuoka Y, Wilson L, Whitt S, Doebley J,
Kresovich S, Goodman M, Buckler IV E: Structure of linkage
disequilibrium and phenotypic associations in the maize genome.
Proc Nat Acad Sci USA 2001, 98:11479–11484.
35. R Core Team: R: A Language and Environment for Statistical Computing.
Vienna, Austria: R Foundation for Statistical Computing; 2012.
Submit your next manuscript to BioMed Central
and take full advantage of:
• Convenient online submission
• Thorough peer review
• No space constraints or color figure charges
• Immediate publication on acceptance
• Inclusion in PubMed, CAS, Scopus and Google Scholar
• Research which is freely available for redistribution
Submit your manuscript at
www.biomedcentral.com/submit