Identification of gene co-expression clusters in liver tissues from multiple porcine populations with high and low backfat androstenone phenotype
Bạn đang xem bản rút gọn của tài liệu. Xem và tải ngay bản đầy đủ của tài liệu tại đây (2.63 MB, 18 trang )
Sahadevan et al. BMC Genetics (2015) 16:21
DOI 10.1186/s12863-014-0158-8
RESEARCH ARTICLE
Open Access
Identification of gene co-expression clusters in
liver tissues from multiple porcine populations
with high and low backfat androstenone
phenotype
Sudeep Sahadevan1,2 , Ernst Tholen1 , Christine Große-Brinkhaus1 , Karl Schellander1 , Dawit Tesfaye1 ,
Martin Hofmann-Apitius2 , Mehmet Ulas Cinar3 , Asep Gunawan4 , Michael Hölker1 and Christiane Neuhoff1*
Abstract
Background: Boar taint is principally caused by accumulation of androstenone and skatole in adipose tissues.
Studies have shown high heritability estimates for androstenone whereas skatole production is mainly dependent on
nutritional factors. Androstenone is a lipophilic steroid mainly metabolized in liver. Majority of the studies on hepatic
androstenone metabolism focus only on a single breed and very few studies account for population
similarities/differences in gene expression patterns. In this work, we concentrated on population similarities in gene
expression to identify the common genes involved in hepatic androstenone metabolism of multiple pig populations.
Based on androstenone measurements, publicly available gene expression datasets from three porcine populations
were compiled into either low or high androstenone dataset. Gene expression correlation coefficients from these
datasets were converted to rank ratios and joint probabilities of these rank ratios were used to generate dataset
specific co-expression clusters. Finally, these networks were clustered using a graph clustering technique.
Results: Cluster analysis identified a number of statistically significant co-expression clusters in the dataset. Further
enrichment analysis of these clusters showed that one of the clusters from low androstenone dataset was highly
enriched for xenobiotic, drug, cholesterol and lipid metabolism and cytochrome P450 associated metabolism of
drugs and xenobiotics. Literature references revealed that a number of genes in this cluster were involved in phase I
and phase II metabolism. Physical and functional similarity assessment showed that the members of this cluster were
dispersed across multiple clusters in high androstenone dataset, possibly indicating a weak co-expression of these
genes in high androstenone dataset.
Conclusions: Based on these results we hypothesize that majority of the genes in this cluster forms a signature
co-expression cluster in low androstenone dataset in our experiment and that majority of the members of this cluster
might be responsible for hepatic androstenone metabolism across all the three populations used in our study. We
propose these results as a background work towards understanding breed similarities in hepatic androstenone
metabolism. Additional large scale experiments using data from multiple porcine breeds are necessary to validate
these findings.
Keywords: Boar taint, Androstenone, RNA-seq, Microarray, Multiple dataset, Co-expression, Cluster analysis,
Androgen metabolism, Lipid metabolism
*Correspondence:
1 Institute of Animal Science, University of Bonn, Endenicher Alle, 53115 Bonn,
Germany
Full list of author information is available at the end of the article
© 2015 Sahadevan et al.; licensee BioMed Central. This is an Open Access article distributed under the terms of the Creative
Commons Attribution License ( which permits unrestricted use, distribution, and
reproduction in any medium, provided the original work is properly credited. The Creative Commons Public Domain Dedication
waiver ( applies to the data made available in this article, unless otherwise
stated.
Sahadevan et al. BMC Genetics (2015) 16:21
Background
Boar taint is often described as an off odor or off taste
noticeable from non castrated boar meat [1]. The accumulation of androstenone and skatole in porcine adipose tissues is one of the primary reasons for boar taint
[2]. Studies have reported high heritability estimates of
androstenone [3-5] whereas skatole synthesis is primarily dependent on nutritional factors and genetic control of
skatole levels have not been reported [6]. Androstenone
is a lipophilic sex pheromone synthesized in testis. One
of the widely practiced methods of reducing boar taint
is the surgical castration of boars, to limit the synthesis of androstenone [7]. European union has issued a
declaration for the abolishment of piglet castration without anesthesia by 2018 on grounds of animal welfare [8].
One of the methods to reduce boar taint is selection and
breeding of animals with reduced androstenone content
in backfat. A prerequisite for developing breeding techniques and selecting genetic candidates to reduce boar
taint is understanding the cellular mechanisms behind the
synthesis and metabolism of androstenone. Androstenone
is synthesized in testis and metabolized in liver [9].
Although testis is the site of androstenone synthesis in
boars, this work focuses on the genetic factors involved
in the metabolism of androstenone in liver. A number of
researches have already tried to understand the cellular
mechanisms behind the metabolism of androstenone in
porcine liver [10-16]. In liver, metabolism of steroid hormones, xenobiotics and other endogenous compounds are
mediated by phase I and phase II metabolic processes
[17-20]. Studies on androstenone hepatic metabolism
have come to the conclusion that phase I and phase
II pathway enzymes are involved in the metabolism
of androstenone in porcine liver and the majority
of these studies were mainly focused on 3β-HSD,
cytochrome P450 and sulfotransferase families of genes
[6,9,11,13,15,21,22]. In this scenario, based on the information from the studies mentioned, two major points
have to be taken into consideration: (i) except for a few
candidate biomarkers, genetics behind metabolic pathways and enzymes involved in hepatic androstenone
metabolism are largely unknown and (ii) most of the
aforesaid studies except for [15] used only a single
porcine breed to study the genetics behind androstenone
metabolism. Studies have indicated that there are differences in the expression of genes from same tissue samples
belonging to different breeds [15,23,24].
Since there are sizable gaps in our knowledge about
the genetic mechanisms involved in hepatic androstenone
metabolism, using a data driven approach incorporating
gene expression data from a number of high throughput experiments in multiple populations on hepatic
androstenone metabolism has a number of advantages: (i)
by combining data from multiple populations it would be
Page 2 of 18
possible to understand the underlying population/breed
similarities in genes governing androstenone metabolism,
(ii) since the analysis includes data from multiple populations, the candidate biomarkers can be used to fill
current gaps in the understanding of androstenone hepatic metabolism gene regulation and finally (iii) the analysis results could be used as a comparison standard to
understand breed differences. This work is an attempt to
explore the possibilities of combining metadata from multiple high throughput gene expression datasets to study
the similarities in gene expression patterns and to identify the common genes involved in hepatic androstenone
metabolism of three different porcine populations:
a Duroc × F2 population and Duroc and Norwegian
Landrace breeds. We limited our analysis to these three
pig populations since it was not possible to obtain publicly available high throughput gene expression datasets
on androstenone metabolism for any other pig breeds.
The major aim of this work was to identify the similarities in gene expression patterns to determine the common
genes involved in hepatic androstenone metabolism of
three different pig populations using an integrative analysis approach and a state of the art clustering technique.
Materials and methods
Materials
Datasets
Three publicly available high throughput expression
datasets were used in this work and all three expression
datasets used in this experiment were generated to profile the gene expression differences between liver tissues
of low and high androstenone (LA and HA) phenotypes
(boars). Out of the three datasets used, one was from
an in-house RNA-seq experiment performed on a sample
commercial population of a Duroc sire line, Duroc × F2
boars [10]. In this experiment, liver samples from 5
boars with extreme high levels of androstenone measurement (2.48 ± 0.56 μg/g) in backfat were categorized as
high androstenone animals (HA) and liver samples from
5 boars with extreme low levels of androstenone measurement (0.24 ± 0.06 μg/g) in backfat were categorized
as low androstenone animals (LA). Additional details
of library preparation, sample collection and sequencing are available in [10]. This dataset will be referred to
as DuF2 dataset in further analysis steps. The remaining two datasets were from a microarray experiment
based on a custom porcine cDNA microarray platform.
In this experiment, gene expression profiling was performed on boar liver samples from two breeds, Duroc
and Norwegian Landrace [15]. Expression profiling was
performed separately for each breed and both datasets
contained 29 HA animals and 29 LA animals each [15].
For HA Duroc animals the average androstenone level
was 11.57 ± 3.2 ppm and for LA Duroc animals, the
Sahadevan et al. BMC Genetics (2015) 16:21
Page 3 of 18
average androstenone level was 0.37 ± 0.17 ppm [15]. In
case of Norwegian Landrace animals, average measurement of androstenone in HA animals was 5.95 ± 2.04
ppm whereas the average androstenone level for LA animals was 0.14 ± 0.04 ppm [15]. Further details of this
experiment are available in [15]. The datasets from this
microarray experiment will be referred to as Duroc and
Landrace datasets in our analysis. The datasets were
grouped into LA and HA datasets based on the classification of animals into low and high androstenone animals in
the original experiments. Further details on animal selection and classification into high and low androstenone
animals are available in the original experiments [10,15].
Table 1 gives additional details of the datasets used in our
experiment.
Methods
Data set mapping, quality control and normalization
RNA-seq data The starting point of our analysis was
the quality control mapping and normalization of DuF2
dataset. In the first quality control step, PCR primers
and bad quality sequences (Phred score < 20) reported
by FASTQC quality control application [25] in RNAseq raw read files (DuF2 dataset) were trimmed off. The
raw reads after this filtration step were then mapped to
the latest Sus scrofa genome build Sscrofa10.2 using the
“splice aware” mapping algorithm TopHat [26]. In the
final step, BEDTools [27] was used to compute the raw
expression matrix (raw read count set) from the mapping
files generated by the TopHat algorithm. A key difference
between an expression matrix from an RNA-seq dataset
and an expression matrix from microarray dataset is that
the RNA-seq expression matrix follows a negative binomial distribution [28], whereas the expression matrix from
microarray data follows a Gaussian distribution. Due to
this difference in assumptions about the underlying data
distributions, comparison/merging of expression results
from these two different platforms are not straightforward. One of the recent advancements in the statistical
analysis of RNA-seq data is an analysis method proposed
by Law et al. [29]. This publication asserts that microarray
like statistical methods can be applied to RNA-seq data
after mean-variance modeling and log2 transformation
[29]. The above mentioned data normalization method
is implemented as “voom” function in limma R package
[30]. Following the methodology proposed by Law et al.
[29], we normalized and log2 transformed our RNA-seq
expression matrix.
Microarray data The next step in our analysis was
the retrieval, normalization and mapping of microarray expression data from Duroc and Landrace datasets
to gene identifiers from Sscrofa10.2 gene build. The
data normalization procedure described in the original
microarray experiment is as follows: after hybridization
and scanning, the mean foreground intensities were log
transformed and normalized using print-tip loess normalization procedure in R [31] limma package [15]. Since
the standard procedures of normalization were followed
in the original experiment, we retrieved the normalized
expression datasets from the corresponding GEO dataset
using R package GEOQuery [32]. The distributions of
DuF2 dataset before and after normalization and Duroc
and Landrace datasets were visualized using density plots
and these data distribution density plots are given in
Additional file 1.
One of the challenges we faced in analyzing these
microarray datasets (Duroc and Landrace datasets)
together with our in-house RNA-seq dataset (DuF2
dataset) was the mapping between the custom probe
ids used in the microarray platform and Entrez gene
ids used in RNA-seq expression dataset. The cDNA
microarray chip (see Table 1) used in the experiment
was designed before the release of the pig genome [33]
and used cDNA clones from Sino-Danish Pig Genome
Sequencing Consortium as probes. Since these custom
designed microarray probes and Entrez gene ids from
RNA-seq dataset were not directly compatible, we generated a mapping between the microarray probe identifiers and NCBI Entrez gene identifiers. For this purpose,
sequence alignments were performed between the FASTA
sequences of these custom probes and Sscrofa10.2 Refseq
cDNA sequences mapped to Entrez gene ids using NCBI
standalone BLAST executable [34] (version: 2.2.28+,
approach: all-vs-all and reciprocal blast). The Sscrofa10.2
sequence database generated for BLAST-ing consisted of
25,890 cDNA sequences mapped to Entrez gene ids and
the microarray probe sequence database was comprised
of 26,877 sequences. In this step, we generated mapping between 11,251 microarray cDNA probes and 11,186
Entrez gene ids. In order to avoid the conflicts where multiple cDNA probes were mapped to an Entrez gene id, the
Table 1 Expression dataset details
Dataset
#Genes
#Common genes
#LA samples
DuF2
11,736
7,693
5
5
Duroc × F2
GSE44171
GPL11429
Duroc
11,186
7,693
29
29
Duroc
GSE11073
GPL6173
Landrace
11,186
7,693
29
29
Norwegian Landrace
GSE11073
GPL6173
Table giving details of expression dataset used in this work.
#HA samples
Breed
GEO dataset id
GEO platform id
Sahadevan et al. BMC Genetics (2015) 16:21
Page 4 of 18
expression values from the probe with the largest variance
between sample expression values was mapped to the corresponding Entrez gene id and the remaining conflicting
probe ids and expression values were discarded from
further analysis.
At the end of mapping and normalization of DuF2,
Duroc and Landrace datasets only 7,693 genes were common between all these datasets. Hence, the expression values from only these genes were retained in all the datasets
for further analysis. In the next step, we regrouped the
expression matrices according the phenotype assignment
and generated 2 expression matrix sets: an LA set and an
HA set with 3 expression matrices each. A schematic representation of the entire workflow used in this analysis is
given in Additional file 2.
Generating multi population co-expression networks
In this study, Pearson correlation coefficient between gene
pairs in an expression matrix was used as a measure of
co-expression. The principal aim behind this experiment
was to generate signature gene co-expression networks by
merging metadata from multiple gene expression datasets
to study porcine hepatic androstenone metabolism. Stuart
et al. [35], developed a method for computing gene coexpression clusters across microarray datasets from multiple species. In this method, the authors calculated correlation coefficient between gene pairs in each dataset and
further computed rank order statistics for each gene pair
[35]. The rank order statistics for each gene pair (each
unique correlation coefficient) was calculated as the ratio
of its rank in ordered correlation coefficients to the total
number of gene pairs (unique correlation coefficients).
Finally, the joint cumulative density function (joint cdf )
of an n-dimensional rank order statistics was calculated
using the equation:
r1
P(r1 , r2 ,· · · , rn ) = n!
0
r2
r1
···
rn
ds1 , ds2 ,· · · , dsn
sn−1
[35].
In this equation n is the number of species in the study
and r1 , r2 ,· · · , rn are the rank order ratios of a gene pair
in multiple species (datasets). In this work, we adopted
the aforesaid approach proposed by Stuart et al. [35] to
generate the signature co-expression networks related to
porcine hepatic androstenone metabolism. As a first step
for this purpose, Pearson correlation coefficients were calculated for gene pairs in all the 6 expression matrices
(3 LA and 3 HA expression matrices) separately. Since
we had 7,693 (n = 7,693) common genes among all our
datasets, we ended up with 29.5 million unique gene pairs
n×(n−1)
per dataset. Based on the initial experiments
2
(data not shown) we discovered that due to this high
number of unique correlation coefficients, using signed
values of correlation coefficients for rank order calculation would result in high rank order ratios even for
correlation coefficients with a very small positive value.
Since these rank ratios are used for computing the joint
cdf, even the gene pairs with very small positive correlation coefficients in all the three expression matrices of a
dataset would receive a high joint cumulative probability.
Since our aim was to generate holistic co-expression networks for LA and HA phenotypes, we used the absolute
value of correlation coefficients to compute the rank order
statistics of gene pairs. After calculating the rank order
ratios of gene pairs in all the expression matrices, gene pair
correlation coefficients and rank order ratios were compiled into either LA or HA set according to the phenotype
assignment described in the previous subsection.
In the next step, we trimmed off gene pairs with correlation coefficients ≤ +0.50 in LA and HA sets separately.
This pruning step was aimed at removing all those gene
pairs with conflicting directionalities (positive correlation in one or two datasets and negative correlation in
the other) and very small positive correlation coefficients.
This step was performed to ensure that in the final step,
the correlation coefficients between all the gene pairs
in a cluster are positive and high in LA and HA clusters. After this pruning process, the number of remaining
gene pairs in LA and HA sets were 43,480 (from 3,648
genes) and 42,309 (from 2,826 genes) respectively. The
joint cumulative probability of rank order ratios for these
gene pairs in LA and HA sets were calculated using the
equation stated above. Using these cumulative probabilities as edge weights for LA and HA gene pairs we generated two phenotype specific edge weighted co-expression
networks: an LA network with 43,480 edges among 3,648
nodes and an HA network with 42,309 edges and 2,826
nodes. These LA and HA co-expression networks were
further used as inputs for graph clustering and community
detection. These steps are described in detail in the next
subsection.
Identifying statistically significant co-expression clusters
For identifying the gene clusters in LA and HA coexpression networks, we used a graph clustering algorithm known as Infomap [36]. Infomap clustering
algorithm is based on an information theoretic method
called map equation. This clustering algorithm is based on
optimizing the problem of compressing the information
within a network structure and finding regular patterns in
a network structure that generate the information [36]. A
benchmark test [37] conducted on multiple graph clustering and community detection algorithms concluded that
Infomap algorithm has a reliable performance in a number of real world scenarios. Based on this conclusion in
[37], we chose Infomap clustering algorithm for clustering
LA and HA co-expression networks.
Sahadevan et al. BMC Genetics (2015) 16:21
Although Infomap was shown to be one of the best
performing clustering algorithms, the clustering outputs
from the algorithm is still not deterministic. Like a
number of other graph clustering algorithms [38-41],
even if all the parameters supplied to the algorithm are
kept constant, clustering solutions can still vary slightly
depending on the random seed (random number) chosen to initiate clustering. A solution to this problem
is a clustering strategy known as consensus clustering
[42-45]. The basic principle behind consensus clustering
is identifying the general agreement (consensus) between
a number of different clustering solutions. Recently,
Lancichinetti and Fortunato [42] proposed a greedy algorithm for consensus clustering. This algorithm generates a
matrix (consensus matrix) based on the co-occurrence of
nodes in clusters belonging to a number different of input
clustering solutions (from the same clustering algorithm)
and uses this consensus matrix as an input for the original
clustering method, thus leading to a new set of clusters.
This process is iterated until a complete consensus solution is reached, which upon further clustering would not
result in additional clusters [42].
In our work, a combination of Infomap clustering algorithm and consensus clustering technique was used to
cluster LA and HA co-expression networks. All the input
parameters, except the random seed were kept constant
for clustering LA and HA networks and 500 clustering
solutions were generated in each iteration (per network).
Complete consensus clusters were generated from LA
network after 3 iterations whereas complete consensus
clusters were generated from HA network after only 2
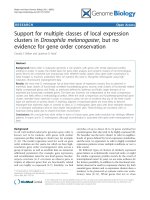
iterations. Figure 1 gives an overview of the LA and HA
consensus clustering runs and the total number of clusters
generated per run for each network.
Although consensus clustering technique can enhance
the accuracy and reliability of the resulting clusters, this
method still cannot guarantee the significance of a cluster with respect to the input network. Since our initial LA
and HA co-expression networks had a large number of
nodes (3,648 and 2,826 respectively), it could be possible
that some of the clusters generated from these networks
are not specific to the phenotype at all, but random collections of nodes either as a result of the large number
of nodes in the initial networks or as a result of an artifact in the cluster algorithm. In this work, we intended
to select only the clusters which were not random but
specific to the given input network. So, in the next step,
we performed a cluster clean up process and assessment
of the statistical significance of the clusters by applying
the methodology proposed by [38]. This methodology is
based on the assumption that given a graph (network)
and clusters generated from the graph, the statistical significance of clusters can be estimated as the probability
of finding these clusters in random null model graphs
Page 5 of 18
generated from the original graph and that a statistical
significance cut-off can be used to identify non random
clusters. The authors also proposed a cluster clean up
procedure, where the nodes are ranked according to the
probability of inclusion in a cluster (when compared to a
null model) and only the nodes with probability above a
certain significance threshold are kept in the pruned cluster [38]. We adopted this methodology to perform cluster
clean up and statistical significance estimation of LA and
HA co-expression networks. After this step, clusters with
less than 10 nodes and significance score (p-value) ≥ 0.05
were excluded from further analysis.
Enrichment analysis
To identify and describe the biological functions of these
significant co-expression networks we performed Gene
Ontology (GO) and KEGG enrichment analysis for each
cluster. Since we were only interested in the biological
functions of these clusters, GO enrichment analysis was
limited to the biological process sub tree of the Gene
Ontology. GO enrichment analysis was performed using
the R package topGO [46]. The algorithm used by topGO
package takes into account the hierarchical structure of
GO graph and shares annotations between parent and
child nodes of the graph for significance testing using
Fisher’s exact test [47]. KEGG enrichment analysis was
performed using a custom R script and Fisher’s exact
test was used for testing the significance of KEGG annotated pathways. In both of these enrichment analyses,
only the GO terms/KEGG pathways with significance
p-value<0.05 and with ≥ 5 annotated genes were selected
as significantly enriched.
Cluster similarity analysis
Once we identified the significant clusters in our networks
and performed enrichment analysis, the next step was to
calculate the similarity between these significant LA and
HA clusters. In this step, we calculated the physical and
functional similarity between significant LA and HA clusters. It should be noted that the physical similarity was
calculated for all significant LA and HA clusters whereas
functional similarity was calculated only for the clusters
with GO enrichment.
Physical similarity Physical similarity between LA and
HA clusters were calculated using a hypergeometric
test. For each significant LA cluster, an HA cluster
was retrieved and hypergeometric test was performed
between the nodes of these clusters to identify the overlap. In this step, only LA - HA similarity was tested since
Infomap clustering algorithm generates non overlapping
clusters. P-values were generated using the phyper function in R environment and the hypergeometric test results
were pruned at a significance threshold of p-value<0.05.
Sahadevan et al. BMC Genetics (2015) 16:21
Page 6 of 18
Figure 1 LA HA networks consensus clustering. Legend: “run 0” in both graphs indicate first clustering run using LA and HA networks, “run 1”
indicates clustering run for the first consensus cluster and “run 2” indicates clustering run for the second consensus cluster.
Functional similarity Functional similarity between LA
and HA significant clusters was established by calculating the Gene Ontology semantic similarity [48-50]. In this
step, we were interested only in assessing the functional
similarity between those clusters showing significant GO
enrichment in the enrichment analysis step. For a given
set of genes, GO semantic similarity can be calculated
based on the number of shared Gene Ontology annotations between the genes. Gene ontology based semantic
similarity can be assessed by two main methods, (i) Information content based methods [49,51-53] and (ii) Graph
based methods [50].
In this work, GO semantic similarity was calculated
between the significantly enriched GO terms of all the
clusters obtained from the enrichment analysis step.
We refer to the GO semantic similarity obtained in
this step as functional similarity between two clusters,
since the semantic similarity calculated directly reflects
the relationship between enriched GO biological process
terms of two clusters and hence is a measurement of
the biological functional relationship. For calculating the
semantic similarity between GO terms, we used the graph
based Wang method [50] as implemented in GOSemSim
[54] bioconductor package. In this step, semantic similarity was calculated between all enriched LA and HA
clusters. For enriched GO terms in each LA or HA cluster, GO terms from another LA or HA cluster was drawn
and semantic similarity was calculated between these
terms using Wang method and these similarity measurements were combined into a single value using best-match
Sahadevan et al. BMC Genetics (2015) 16:21
average strategy (BMA) [54]. These semantic similarity
values were termed simCLUS for future references.
Although the step mentioned above allows to calculate semantic similarity between two enriched clusters in
our analysis, this step does not provide a cut-off threshold to indicate whether the similarity between the two
clusters were significant or not. To provide a significant cut-off point for semantic similarity, we followed
an empirical approach based on random sampling. In
this step, we retrieved all GO biological process annotations for porcine genes and randomly sampled two sets of
GO terms from these annotations. The number of sampled terms was also kept random and was drawn from
the number of GO terms enriched for either LA or HA
clusters. GOSemSim package was again used to calculate semantic similarity. This whole step was repeated
10,000 times to generate a set of random semantic similarity measures. These random semantic similarity values
were termed as simRAND for further references. Finally, the
significance threshold cut-off empirical p-value for each
simCLUS was calculated as:
PvalEmpricial =
# simRAND > simCLUS
, where N = 10, 000.
N
The threshold cut off used here was PvalEmpricial < 0.05.
In the next step, we generated two cluster similarity
graphs based on physical similarity assessment and functional similarity assessment. These graphs were visualized using the biological network visualizing platform,
Cytoscape [55].
Results and discussion
In our analysis, a total of 17 clusters from LA coexpression network and 12 clusters from HA coexpression network were found be significant with more
than 10 nodes per cluster. Table 2 shows the number of
genes, significance score and average correlation coefficients of nodes in these clusters across three datasets.
A comparison of correlation coefficients in the three
datasets shows that the correlation coefficient values were
comparatively higher in Duroc × F2 (RNA-seq) dataset
(Table 2). The maximum and minimum number of nodes
(genes) in LA co-expression clusters were 478 and 20
respectively whereas the maximum and minimum number of nodes in HA co-expression clusters were 616 and
11 respectively (Table 2). In case of DuF2 dataset, we think
that the higher correlation coefficient is mainly the combined result of sensitivity of the RNA-seq technique and
the normalization procedure. RNA-seq being a more sensitive technique might have given a high expression value
per gene. Since all the expression values (read count) were
large positive numbers, the log2 transformation also tend
to give largely positive values which could have impacted
Page 7 of 18
the correlation coefficient calculations. Seven LA coexpression clusters and 5 HA co-expression clusters were
enriched for GO biological processes terms, whereas 5
LA co-expression clusters and 3 HA co-expression clusters were enriched for KEGG metabolic pathways. Table 3
gives an overview on the number of GO terms and KEGG
pathways enriched per cluster. The results from GO and
KEGG enrichment analysis show that LA and HA coexpression clusters are involved in a number of divergent
biological functions. Further details of GO and KEGG
enrichment analysis, such as enriched terms, number of
enriched genes, p-value of enrichment and gene ids of
enriched genes are given in Additional files 3 and 4.
Although several LA and HA clusters were enriched
for GO processes and KEGG pathways, based on enrichment results, we selected LA cluster 2 for a detailed
analysis. LA cluster 2 GO and KEGG enrichments are
complimentary to each other and strongly points to the
involvement of the member genes in phase I and II
metabolism and the metabolism of steroid hormones and
drugs. This cluster was enriched for GO processes such
as oxidation-reduction process, xenobiotic metabolic process, triglyceride metabolic process, lipid metabolic process, cholesterol metabolic process, response to drug,
response to hormone stimulus (Table 4) as well as KEGG
pathways such as PPAR signaling pathway, peroxisome,
retinol metabolism, drug metabolism - other enzymes,
drug metabolism - cytochrome P450 and metabolism of
xenobiotics by cytochrome P450 (Table 5). Additional
information on GO and KEGG enrichments are available
in Additional files 3 and 4. It was previously established
that steroid metabolism is closely linked to metabolism
of drugs/xenobiotics and that the metabolism of steroids,
steroid hormones, drugs and other xenobiotics are mediated by phase I and phase II metabolic pathways [17-20].
One of the GO biological processes enriched in LA cluster 2 results is the oxidation reduction process and it
was already found that oxidation and reduction metabolic
processes constitute to phase I metabolism [56]. Several
genes involved in xenobiotic metabolism are also involved
in the metabolism of androgens [57] and GO biological
process “xenobiotic metabolic processes” was enriched
for LA cluster 2 (Table 4). In GO and KEGG enrichment results GO term aromatic compound catabolic process and KEGG pathways drug metabolism - cytochrome
P450 and metabolism of xenobiotics by cytochrome
P450 were enriched (Tables 4 and 5). Cytochrome P450
related enzyme pathways were identified to be involved
in metabolism of aromatic compounds, drugs and steroid
hormones [58,59].
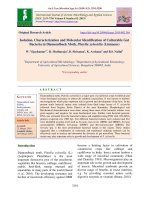
LA cluster 2 gene functions
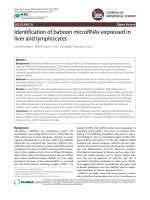
LA cluster 2 was comprised of 134 nodes (genes)
and 1,121 edges (Figure 2). Additional file 5 contains
Sahadevan et al. BMC Genetics (2015) 16:21
Page 8 of 18
Table 2 Significant clusters in LA and HA co-expression networks
Cluster Id
#Genes
Significance (p-value)
DuF2 cor. coeff. (mean ± sd)
Duroc cor. coeff. (mean ± sd)
Landrace cor. coeff. (mean ± sd)
LA 0
478
0.00216
0.758 ± 0.138
0.850 ± 0.115
0.625 ± 0.090
LA 1
316
0.00267
0.742 ± 0.135
0.832 ± 0.122
0.622 ± 0.091
LA 2
134
0.0076
0.776 ± 0.139
0.672 ± 0.100
0.596 ± 0.075
LA 3
116
0.02248
0.741 ± 0.133
0.849 ± 0.111
0.630 ± 0.089
LA 4
96
0.04911
0.773 ± 0.139
0.666 ± 0.101
0.600 ± 0.074
LA 6
86
0.01046
0.793 ± 0.149
0.714 ± 0.108
0.600 ± 0.070
LA 7
87
0.0203
0.736 ± 0.143
0.724 ± 0.115
0.582 ± 0.063
LA 8
72
0.0379
0.765 ± 0.134
0.707 ± 0.132
0.587 ± 0.069
LA 9
68
0.01526
0.765 ± 0.149
0.610 ± 0.081
0.605 ± 0.084
LA 11
61
0.01415
0.729 ± 0.141
0.663 ± 0.126
0.662 ± 0.096
LA 12
40
0.04167
0.739 ± 0.125
0.622 ± 0.085
0.598 ± 0.074
LA 14
39
0.00594
0.736 ± 0.139
0.700 ± 0.116
0.610 ± 0.076
LA 15
30
0.04776
0.768 ± 0.138
0.641 ± 0.104
0.592 ± 0.065
LA 17
21
0.01309
0.748 ± 0.139
0.676 ± 0.131
0.612 ± 0.077
LA 18
28
0.00258
0.749 ± 0.134
0.661 ± 0.117
0.591 ± 0.075
LA 19
20
0.00408
0.726 ± 0.122
0.679 ± 0.100
0.622 ± 0.080
LA 21
21
0.01807
0.758 ± 0.140
0.746 ± 0.107
0.620 ± 0.084
HA 0
616
0.03963
0.780 ± 0.139
0.704 ± 0.115
0.663 ± 0.102
HA 1
75
0.0166
0.812 ± 0.132
0.598 ± 0.077
0.668 ± 0.106
HA 3
23
0.0023
0.815 ± 0.128
0.612 ± 0.081
0.679 ± 0.109
HA 4
18
0.00095
0.826 ± 0.117
0.597 ± 0.065
0.622 ± 0.079
HA 10
207
0.00203
0.770 ± 0.137
0.741 ± 0.116
0.681 ± 0.114
HA 11
22
0.01025
0.773 ± 0.125
0.775 ± 0.098
0.656 ± 0.103
HA 12
13
0.01196
0.776 ± 0.138
0.747 ± 0.105
0.660 ± 0.090
HA 14
75
0.00429
0.750 ± 0.141
0.611 ± 0.086
0.685 ± 0.100
HA 17
40
0.01279
0.821 ± 0.133
0.637 ± 0.088
0.619 ± 0.085
HA 18
25
0.02743
0.770 ± 0.136
0.776 ± 0.094
0.735 ± 0.101
HA 19
25
0.02149
0.767 ± 0.128
0.604 ± 0.080
0.680 ± 0.106
HA 22
11
0.04384
0.744 ± 0.136
0.677 ± 0.121
0.689 ± 0.105
This table contains information on significant clusters generated from LA and HA co-expression networks.
Cytoscape .xgmml network representation of this cluster
and each edge in this cluster is annotated with correlation coefficients from all the three datasets and joint
cumulative density probability calculated. Node degree
calculations done on the cluster indicated that genes
such as PRDX3, LOC100622308 (SCP2), LOC100516628
(UGT2B18-like), PON1 and OTC were the top ranking highly connected nodes in the cluster. Some of the
major families of genes in this cluster were: the UGT
gene family (UGT2B17, LOC100516628 (UGT2B18-like),
LOC100738495 (UGT2B31-like), HSD/SDR gene family
(HSD17B4, HSD17B10, HSD17B13, HSDL2), SLC gene
family (LOC100737875 (SLC22A10), SLC25A4), ALDH
gene family (ALDH3A2, ALDH5A1) and USP gene family (Usp9x, USP28) (see Figure 2). Since describing the
functions of all the genes in LA cluster 2 would be beyond
the scope of this manuscript, the gene discussion part is
limited to a handful important genes described below.
Literature references show that UGT, HSD and ALDH
gene families are associated with steroids and steroid hormone metabolism [60-62]. Three members of the UGT
gene family, UGT2B17, LOC100516628 (UGT2B18-like)
and LOC100738495 (UGT2B31-like) were co-expressed
in LA cluster 2. Members of the UGT gene family are involved in the metabolism of steroids, biogenic amines, fat soluble vitamins, drugs and xenobiotics
[63-65]. UGT2B17 was found to be important for hepatic detoxification and involved in androgen metabolism
[66,67]. It was shown that UGT2B18 was predominantly active on C19 steroids with a hydroxyl group
Sahadevan et al. BMC Genetics (2015) 16:21
Table 3 Enrichment statistics of significant LA and HA
coexpression clusters
Cluster Id
#GO enriched terms
#KEGG enriched pathways
LA 0
19
–
LA 1
10
–
LA 2
14
11
LA 3
5
3
LA 4
–
1
LA 6
8
1
LA 7
4
–
LA 8
5
–
LA 9
–
2
HA 0
50
5
HA 1
7
6
HA 3
3
–
HA 10
8
–
HA 17
3
2
This table contains information on the number of GO terms and KEGG pathways
enriched in significant clusters generated from LA and HA co-expression
networks.
at the 3α position [68]. Kojima and Degawa demonstrated that UGT2B31 expression was higher in male
pigs when compared to female pigs and that testosterone
treatment of castrated boars increased UGT2B31 expression [69]. Canine UGT2B31 catalyzed the glucuronidation of compounds such as steriods, opoids, apliphatic
alcohols and phenols [70]. Glucoronic acid, the substrate molecule for UGT glucuronidation process is a
carboxylic acid. Since GO carboxylic acid catabolic process was enriched in LA cluster 2 results along with
Page 9 of 18
other metabolic processes such as xenobiotic metabolic
process and cholesterol metabolic process (Table 4), it
could be assumed that carboxylic acid (glucoronic acid)
catabolism is interlinked with the metabolism of steroids,
drugs and xenobiotics in the glucuronidation process.
Considering that the literatures cited above points to
steroid metabolic roles of these genes and that these genes
were co-expressed in all the three LA datasets, it could
be possible that the UGT family genes mentioned above
were involved in androgen/androstenone metabolism in
all the three datasets (population). In addition to UGT
gene family, 4 members of HSD gene family were also
co-expressed in our results. These genes are: HSD17B4,
HSD17B10, HSD17B13 and HSDL2. Among these genes,
three (HSD17B4, HSD17B10, HSD17B13) are members
of 17β-HSD gene family. The reduction reactions catalyzed by 17β-HSDs are necessary for the formation of
active androgens whereas the oxidative reactions inactivates potent sex steriods [71]. The enzyme encoded
by gene HSD17B4 functions as a steroid inactivating
enzyme and is also involved in the beta oxidation of fatty
acids [72]. Additionally, it was also demonstrated that
the conversion of 5-androstene-3-17-diol to dehydroepiandrosterone (DHEA) was inactivated by HSD17B4
[73]. HSD17B10 was shown to be expressed in human
liver, gonads, localized to mitochondria and associated
with phase I metabolic pathway. The mitochondrial ability to modulate intracellular levels of active sex steroids
stem from this localization of HSD17B10 [74]. HSD17B13
is expressed in liver across a number of mammalian
species. While the functions of HSD17B4 and HSD17B10
could be discussed in detail, we were unable to find
published evidences related to HDS17B13. But, in the
Table 4 LA cluster 2 GO enrichment
GO.ID
Term
#Enriched genes
Enrichment p-value
GO:0055114
Oxidation-reduction process
42
9.6E-011
GO:0051289
Protein homotetramerization
6
0.0000016
GO:0006805
Xenobiotic metabolic process
8
0.000012
GO:0006641
Triglyceride metabolic process
5
0.002
GO:0006629
Lipid metabolic process
33
0.00231
GO:0009058
Biosynthetic process
40
0.01118
GO:0048869
Cellular developmental process
11
0.0115
GO:0006810
Transport
34
0.01378
GO:0008203
Cholesterol metabolic process
7
0.01502
GO:0042493
Response to drug
8
0.01503
GO:0046395
Carboxylic acid catabolic process
11
0.02834
GO:0019439
Aromatic compound catabolic process
14
0.02987
GO:0006869
Lipid transport
5
0.03686
GO:0009725
Response to hormone stimulus
7
0.04158
This table contains enriched GO biological process terms for LA cluster 2 genes.
Sahadevan et al. BMC Genetics (2015) 16:21
Page 10 of 18
Table 5 LA cluster 2 KEGG enrichment
KEGG.ID
Pathway
#Enriched genes
Enrichment p-value
ssc00982
Drug metabolism - cytochrome P450
9
0.00000325
ssc00071
Fatty acid degradation
8
0.00001695
ssc00980
Metabolism of xenobiotics by cytochrome P450
7
0.00019518
ssc00830
Retinol metabolism
7
0.00026192
ssc00053
Ascorbate and aldarate metabolism
5
0.00033240
ssc05204
Chemical carcinogenesis
7
0.00082319
ssc00983
Drug metabolism - other enzymes
5
0.00107901
ssc04146
Peroxisome
8
0.00109469
ssc00280
Valine, leucine and isoleucine degradation
6
0.00149421
ssc00380
Tryptophan metabolism
5
0.00343914
ssc03320
PPAR signaling pathway
6
0.00990966
This table contains enriched KEGG pathways for LA cluster 2 genes.
light of evidences from SDR (HSD) gene family, it could
be hypothesized that HSD17B13 is also involved in the
metabolism of sex steroids. Another short chain reductase (SDR/HSD) family member HSDL2 was found to be
involved in cholesterol metabolism and homeostasis [75].
In case of SLC family genes in LA cluster 2, we found
that LOC100737875 (SLC22A10) gene product transports
sulfate conjugates of steroids, estrone sulfate and dehydroepiandrosterone sulfate (DHEAS) with high affinity
[76]. We were unable to find any function for SLC25A4
with regard to androgen or sterid metabolism or transport. In case of ALDH gene family, although ALDH3A2 is
involved in phase I metabolic pathway, known to catalyze
the oxidation of long-chain aliphatic aldehydes to fatty
acid and ALDH5A1 is involved in γ aminobutyric degradation [77], we could not find any evidences to link these
genes to hepatic androgen/androstenone metabolism.
Another LA cluster 2 member, AKR1C1 is an
NADPH dependent ketosteroid reductase. The product of this gene converts progesterone to its inactive
form 20 − α − dihydroxyprogesterone [78]. In androgen metabolism, the conversion of dihydrotestosterone
(DHT) to 5α-androstane-3β, 17β-diol is mainly catalyzed
by AKR1C1 gene product [79]. It was also shown that
AKR1C1 activity can be induced by phase II enzyme
inducers [80], suggesting a potential role of this gene in
phase II metabolic processes. FMO5 was another coexpressed gene in LA cluster 2. The enzyme encoded by
this gene is NADPH dependent, upregulated by progesterone and catalyzes the oxidation of drugs, pesticides
and xenobiotics [81]. It was also found that FMO5 is
expressed in human liver cells and ≥ 50% of all FMO
transcripts in human liver cells are from FMO5 [82].
STARD4, an LA cluster 2 member is widely expressed
in liver and is demonstrated to be an important effector of lipid distribution in body [83]. Rodriguez-Agudo
et al. [84] postulated that STARD4 might reduce steroid
hormone production during murine development and
another study [85] found that STARD4 functions in a
rate limiting step in cholesterol ester formation. According to [86] STARD4 increases intracellular cholesteryl
ester formation and is a major component of cholesterol
homeostasis regulating mechanism. In our results, the
gene ADH1C was also found to be co-expressed in LA
cluster 2. This gene is a member of the alcohol dehyrogenase family which metabolize substrates such as ethanol,
retinol, hydroxysteroids and lipid peroxidation products.
A study done on human ADH1C allele 2 found that this
allele (ADH1C*2) had measurable activity on steroidogenic compounds such as 5β-androstan-17β-ol-3-one,
5β-androstan-3β-ol-17-one, 5β-pregnan-3β-ol-20-one
and 5β-pregnan-3, 20-dione [87].
PGRMC1, a progesterone steroid receptor is an LA
cluster 2 member predominantly expressed in liver and
kidney. This gene was found to be involved in sterol
metabolism/homeostasis and cell survival [88]. DBI,
another LA cluster 2 member gene boost steroid synthesis by stimulating delivery of cholesterol to inner
mitochondrial membranes [89]. The functional roles of
DBI include supporting energy metabolism, transcription, membrane production and steroidogenesis [90].
According to [91], CRYZ gene, another LA cluster 2
member is associated with lipid, fatty acid and steroid
metabolism. LOC100622308 (SCP2) gene encodes sterol
carrying protein 2 and is also an LA cluster 2 member.
This gene is found to be involved in hepatic cholesterol metabolism, biliary lipid secretion, and intracellular cholesterol distribution [92] and it is suggested
that SCP2 might be involved in regulating steroidogenesis [93]. Yet another LA cluster 2 member gene
in our analysis was LOC100523701 (aldehyde oxidase
like). The richest source of this gene product in terms
of transcriptome abundance is liver and is found in a
number of mammals. Moreover, aldehyde oxidases are
Sahadevan et al. BMC Genetics (2015) 16:21
Page 11 of 18
Figure 2 LA cluster 2. Figure showing the genes co-expressed in LA cluster 2. Legend: light blue nodes indicate genes and green edges indicate
node co-expression (cor ≥ +0.50 in all three porcine populations).
involved in phase I metabolism of a number of compounds and probably functions along with the microsomal
cytochrome P450 system [94]. FHL2, another LA cluster 2 co-expressed gene is an androgen responsive gene
and a co-activator of androgen receptor (AR) [95,96]. Further research also found that FHL2 is involved in steroid
hormone related pathways and interacts with endoplasmic reticulum (ER) in the presence of 17β-estradiol [97].
An LA cluster 2 member gene, OCT1 interacts with AR
and can interact with HNF1 to modulate its capacity to
upregulate UGT2B expression in liver [57]. Since three
UGT2B genes (UGT2B17, LOC100516628 (UGT2B18like), LOC100738495 (UGT2B31-like)) and OCT1 are
found in the same cluster and co-expressed in three different datasets (population), the potential action of OCT1
on UGT2B genes and their role in androgen/androstenone
metabolism could be further investigated. Another LA
cluster 2 coexpressed gene was PON1. PON1 is synthesized in liver and is involved in the biotransformation of various xenobiotics as well as protection against
lipid peroxidation [98]. The next part of this section
describes and discusses the results from cluster similarity
assessments.
Cluster similarity analysis
Hypergeometric test for cluster node overlap assessment
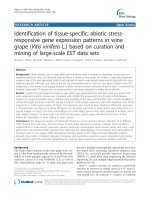
showed that 15 LA clusters and 13 HA clusters had significant node overlap between them (Figure 3). The highest
node overlap was between clusters LA 0 and HA 0 with
280 common nodes followed by the overlap between clusters LA 1 and HA 10 with 152 common nodes (Figure 3).
LA cluster 2 showed significant node overlap between 6
HA clusters: HA 0, HA 1, HA 3, HA 14, HA 17 and HA 22.
Among these clusters, the highest overlap was with cluster HA 0, with 35 nodes in common whereas HA cluster
1 with 33 common nodes showed the next highest overlap with LA cluster 2 (Figure 4). It can also be seen from
Figure 4 that LA cluster 2 showed the least physical overlap with HA cluster 22 with only 4 nodes in common.
The results from functional similarity assessment showed
that 12 LA and HA clusters had significant functional
similarity overlap (Figure 5). Out of these 12 clusters, 7
clusters were from LA network and 5 clusters were from
HA network. The highest functional similarity (0.626) was
between clusters LA 1 and HA 10 (Figure 5). These clusters also showed the second highest physical similarity
(node overlap) (Figure 3). The second highest functional
similarity (0.603) was between clusters HA 3 and HA 17,
indicating that irrespective of having no physical overlap,
the clusters showed significant functional similarity. The
third highest functional similarity (0.586) was between
clusters LA 0 and HA 0, the clusters with highest physical
overlap (Figure 5, Figure 3). LA cluster 2 showed significant functional similarity with one LA cluster, LA 0 and 4
HA clusters: HA 0, HA 1, HA 3 and HA 17. Interestingly,
the four HA clusters with significant functional similarity
also showed significant physical similarity (node overlap)
with LA cluster 2 (Figure 4).
Sanity check
To test whether member genes of LA cluster 2 can be
retrieved from microarray datasets alone, we repeated
Sahadevan et al. BMC Genetics (2015) 16:21
Page 12 of 18
Figure 3 Physical overlap between clusters. Figure showing significant node overlap between LA and HA clusters. Legend: Green nodes indicate
LA clusters and red nodes indicates HA clusters. Grey forward slashed edges indicate significant physical overlap and edge labels indicate common
nodes between two clusters.
the experiment only on Duroc and Landrace (microarray)
datasets and compared the resulting significant clusters to
significant LA clusters. The clusters were compared using
a hypergeometric test as mentioned above and the results
are given in Table 6. The low androstenone microarray
clusters were termed LA Duroc Landrace clusters and
high androstenone clusters were termed HA Duroc Landrace clusters. The significance values for these clusters
are available in Additional file 6. The results show that one
microarray cluster, LA Duroc Landrace cluster 5 is highly
similar to LA cluster 2. Table 6 shows that LA Duroc Landrace cluster consisted of 90 genes and out of this 87 genes
were present in LA cluster 2. Since the number of genes
in microarray array cluster (LA Duroc Landrace 5) was
lower comparison to the number of genes in LA cluster
2, we performed GO enrichment analysis to understand
the functions of this microarray cluster. Table 7 shows
the results of GO enrichment analysis for LA Duroc Landrace cluster 5. The complete GO enrichment results for
microarray clusters are given in Additional file 7. GO
enrichment results of LA Duroc Landrace cluster 5 shows
that this cluster is functionally highly similar to LA cluster
2 although smaller in size. We assume that this difference
in the number of genes in LA cluster 2 and LA Duroc
Landrace cluster 5 is primarily due to the effect DuF2
(RNA-seq) correlation ranks on the clustering process.
This sanity check step leads to two important conclusions: (i) among the three datasets, the rank probabilities
from RNA-seq dataset DuF2 has a high effect on the
clustering process in comparison to the other microarray
datasets and (ii) despite the smaller size of LA Duroc Landrace cluster 5, this cluster remained functionally highly
similar to LA cluster 2, which shows that even after the
removal of one of the datasets, the genes with high coexpression in LA cluster 2 remained as a single cluster
and could be the functional core playing a major role in
androstenone metabolism in low androstenone animals.
Additional file 8 contains Cytoscape .xgmml network representation of the cluster LA Duroc Landrace 5 and each
edge in this cluster is annotated with correlation coefficients from the microarray datasets and joint cumulative
density probability calculated.
Sahadevan et al. BMC Genetics (2015) 16:21
Page 13 of 18
Figure 4 LA 2 cluster physical and functional overlap. Figure showing significant physical and functional overlap between LA 2 cluster and other
LA and HA clusters. Legend: Green nodes indicate LA clusters and red nodes indicates HA clusters. Grey forward slashed edges indicate significant
physical overlap and solid blue edges indicate functional similarity and edge labels denote the functional similarity (GO semantic similarity).
Figure 5 Cluster functional overlap. Figure showing significant functional overlap between LA and HA clusters. Legend: Green nodes indicate LA
clusters and red nodes indicates HA clusters. Solid blue edges indicate functional similarity and edge labels denote the functional similarity (GO
semantic similarity).
Sahadevan et al. BMC Genetics (2015) 16:21
Page 14 of 18
Table 6 LA and microarray cluster comparison
Cluster 1
Cluster 2
#Cluster 1
#Cluster 2
Common genes
Pval
LA 1
LA Duroc Landrace 1
316
539
287
0.0000
LA 2
LA Duroc Landrace 5
134
90
87
0.0000
LA 3
LA Duroc Landrace 1
116
539
86
0.0000
LA 4
LA Duroc Landrace 3
96
150
76
0.0000
LA 6
LA Duroc Landrace 2
86
215
67
0.0000
LA 6
LA Duroc Landrace 4
86
90
5
0.0403
LA 7
LA Duroc Landrace 6
87
70
60
0.0000
LA 7
LA Duroc Landrace 7
87
55
5
0.0059
LA 8
LA Duroc Landrace 4
72
90
60
0.0000
LA 9
LA Duroc Landrace 1
68
539
55
0.0000
LA 11
LA Duroc Landrace 2
61
215
43
0.0000
LA 11
LA Duroc Landrace 7
61
55
9
0.0000
LA 12
LA Duroc Landrace 3
40
150
32
0.0000
LA 14
LA Duroc Landrace 9
39
39
18
0.0000
LA 17
LA Duroc Landrace 3
21
150
6
0.0001
LA 17
LA Duroc Landrace 7
21
55
13
0.0000
LA 19
LA Duroc Landrace 9
20
39
17
0.0000
LA 21
LA Duroc Landrace 12
21
25
20
0.0000
LA 25
LA Duroc Landrace 13
10
11
7
0.0000
LA 1
HA Duroc Landrace 2
316
256
148
0.0000
LA 2
HA Duroc Landrace 1
134
331
47
0.0000
LA 2
HA Duroc Landrace 5
134
51
28
0.0000
LA 2
HA Duroc Landrace 8
134
27
5
0.0016
LA 2
HA Duroc Landrace 9
134
15
5
0.0001
LA 3
HA Duroc Landrace 2
116
256
29
0.0000
LA 4
HA Duroc Landrace 1
96
331
29
0.0000
LA 4
HA Duroc Landrace 3
96
96
7
0.0070
LA 4
HA Duroc Landrace 5
96
51
6
0.0011
LA 6
HA Duroc Landrace 1
86
331
41
0.0000
LA 6
HA Duroc Landrace 6
86
44
6
0.0003
LA 6
HA Duroc Landrace 9
86
15
3
0.0034
LA 8
HA Duroc Landrace 1
72
331
35
0.0000
LA 9
HA Duroc Landrace 1
68
331
23
0.0000
LA 9
HA Duroc Landrace 3
68
96
6
0.0049
LA 14
HA Duroc Landrace 7
39
32
16
0.0000
LA 18
HA Duroc Landrace 7
28
32
6
0.0000
LA 21
HA Duroc Landrace 6
21
44
13
0.0000
This table contains hypergeometric test results for LA cluster with microarray clusters.
Consolidating our analysis results, we propose that the
combined action of majority of the LA cluster 2 member
genes might be contributing to hepatic androstenone and
androgen metabolism in the LA porcine populations used
in our study. Since these results are based on gene expression data from three pig populations (datasets), we further
postulate that majority of the genes in this co-expression
cluster might be functioning in a similar manner in all
the three pig population used in our study. A drawback
with the current study is that the existence of this cluster is shown only in three pig population and in addition
this study was not able to provide concrete answers on
Sahadevan et al. BMC Genetics (2015) 16:21
Page 15 of 18
Table 7 LA duroc landrace cluster 5 GO enrichment
GO.ID
Term
#Enriched genes
Enrichment p-value
GO:0055114
Oxidation-reduction process
27
0.00000038
GO:0051289
Protein homotetramerization
5
0.000005
GO:0006805
Xenobiotic metabolic process
6
0.000096
GO:0009058
Biosynthetic process
31
0.00485
GO:0008203
Cholesterol metabolic process
7
0.00515
GO:0048869
Cellular developmental process
8
0.0079
GO:0042493
Response to drug
7
0.0085
GO:0046395
Carboxylic acid catabolic process
6
0.02004
GO:0006979
Response to oxidative stress
7
0.02135
GO:0006810
Transport
26
0.02311
GO:0019439
Aromatic compound catabolic process
9
0.03349
GO:0009166
Nucleotide catabolic process
6
0.03466
GO:0044255
Cellular lipid metabolic process
21
0.03936
GO:0044281
Small molecule metabolic process
35
0.04629
This table contains enriched GO biological process terms for LA cluster 2 genes.
hepatic androstenone metabolism in low androstenone
boars. Since the comparison test show that DuF2 (RNAseq) dataset has an effect on the clustering process, further large scale studies encompassing data from multiple
porcine population and additional experiments at the
genome, proteome and metabolome level are necessary to
prove the validity of this cluster.
Conclusions
Accumulation of androstenone and skatole are the major
factors contributing to boar taint. The major aim of
this work was to study the similarities in hepatic gene
expressions in three porcine populations with similar
androstenone phenotype and to identify the signature coexpression cluster(s) responsible for hepatic androstenone
metabolism in these population. For this purpose, we
merged metadata from three different porcine gene
expression studies on three different populations using
rank order statistics. The resulting networks were clustered using a state of the art clustering technique and
statistically significant co-expression clusters were identified from these networks. Based on the results from
enrichment analysis we hypothesize that LA cluster 2 in
our results might be a signature co-expression cluster for
androstenone metabolism in low androstenone animals.
Our cluster similarity assessments reveal that LA cluster 2 show moderate physical and functional similarity
with several HA clusters, but based on these results we
further postulate that the strong co-expression and cluster behavior exhibited by LA cluster 2 member genes
in low androstenone dataset might be lacking in high
androstenone dataset, thus making this cluster (LA cluster 2) a prime candidate for further detailed analysis.
Although the comparison test indicate that the RNA-seq
correlation ranks have a large effect on the clustering
process, the hypergeometric test and GO enrichment
LA Duroc Landrace cluster 5 showed that this cluster
was highly similar to LA cluster 2. The comparison test
showed that even after removing one of the datasets from
analysis, thus reducing the number of genes in the cluster,
the functional enrichment remained highly similar. This
shows that the co-expression of genes in this cluster is
not a random effect, but the correlation ranks from DuF2
dataset has a large effect on the clustering process. This
variation in the number of genes in the cluster indication
of the effect of technical variabilities in high throughput
results and shows the importance of validating this cluster
on additional datasets from multiple pig populations.
To our knowledge, this study is one of the first attempt
in porcine androstenone research community to understand population similarity in gene expression patterns
based on co-expression networks. With this study, we aim
to provide a baseline co-expression cluster focusing on
population similarity in gene expression patterns. This
cluster can further be expanded or challenged based on
analysis results from other porcine populations or breeds
with similar androstenone phenotypes. In order to understand the breed differences in androstenone metabolism,
as a first step it is crucial to know the breed similarities in
androstenone metabolism. By validating the existence of
majority of the genes in this cluster in various pig breeds
it would be possible to eliminate the breed specific genes
from the cluster and obtain a cluster of genes common
for all the pig population. Once we obtain such a common cluster, it would be possible to rank the genes in the
cluster based on either their correlation coefficients/joint
Sahadevan et al. BMC Genetics (2015) 16:21
CDF to other genes in the cluster or based on expression values from high-throughput results. In the final
step the ranking of these genes can be used as starting
point for screening the animals. To conclude, we propose our co-expression cluster as one of the first attempt
towards understanding gene expression similarities in
hepatic androstenone metabolism. It is necessary to further validate this cluster in additional porcine populations
(breeds) and to understand the potential roles of member
genes in androstenone metabolism. For this purpose large
scale experiments including data from multiple porcine
population combining data from genomic, proteomic and
metabolomic experiments are necessary.
Additional files
Additional file 1: Data density plots for DuF2, Duroc and Landrace
datasets. Additional file containing data density plots.
Additional file 2: Pictorial representation of analysis workflow used.
Legend: White parallelograms with grey outline: Input/output data and
results. White cylinders with red outline: data from external databases.
Rectangles with light blue shades: various tools and analysis processes
used in this workflow.
Additional file 3: LA GO and KEGG enrichment table. Additional table
containing GO and KEGG enrichment analysis results for LA clusters.
Additional file 4: HA GO and KEGG enrichment table. Additional table
containing GO and KEGG enrichment analysis results for HA clusters.
Additional file 5: LA cluster 2 network file. Cytoscape (.xgmml) file for
LA cluster 2. Each edge in the network is annotated with correlation
coefficients in all the three datasets and joint CDF calculated. This file can
be visualized in Cytoscape ( following the
manual for importing xgmml files into Cytoscape (oscape.
org/GettingStarted).
Additional file 6: Microarray cluster statistics. Additional table
containing statistics for microarray clusters.
Additional file 7: Microarray cluster GO enrichment. Additional table
containing GO enrichment results for microarray clusters.
Additional file 8: LA Duroc Landrace cluster 5 network file. Cytoscape
(.xgmml) file for LA Duroc Landrace cluster 5. Each edge in the network is
annotated with correlation coefficients in the microarray datasets and joint
CDF calculated. This file can be visualized in Cytoscape (http://www.
cytoscape.org/) following the manual for importing xgmml files into
Cytoscape ( />Competing interests
The authors declare that they have no competing interests.
Authors’ contributions
SS performed the experiments and wrote manuscript. ET and CG-B supervised
statistical analysis and revised the manuscript. CN supervised experiments and
revised manuscript. KS and MHA edited and revised the manuscript. MUC, AG,
DT and MH helped in initial data collection. All authors read and approved the
final manuscript.
Acknowledgements
This work was financially supported by the Federal Ministry of Food and
Agriculture, Germany (BMEL), the Federal Office for Agriculture and Food,
Germany (BLE) and State of North Rhine Westphalia with the programme USL
“Umweltverträgliche und Standortgerechte Landwirtschaft”.
Author details
1 Institute of Animal Science, University of Bonn, Endenicher Alle, 53115 Bonn,
Germany. 2 Fraunhofer Institute for Algorithms and Scientific Computing
Page 16 of 18
(SCAI), Schloss Birlinghoven, 53754 Sankt Augustin, Germany. 3 Department of
Animal Science, Faculty of Agriculture, Erciyes University, Kayseri, Turkey.
4 Department of Animal Production and Technology, Bogor Agricultural
University, Bogor, Indonesia.
Received: 18 July 2014 Accepted: 18 December 2014
References
1. Bonneau M. Compounds responsible for boar taint, with special
emphasis on androstenone: A review. Livestock Production Sci. 1982;9(6):
687–705. doi:10.1016/0301-6226(82)90017-3.
2. Bonneau M, Le Denmat M, Vaudelet JC, Veloso Nunes JR, Mortensen
AB, Mortensen HP. Contributions of fat androstenone and skatole to boar
taint: I. Sensory attributes of fat and pork meat. Livestock Production Sci.
1992;32(1):63–80. doi:10.1016/S0301-6226(12)80012-1.
3. Frieden L, Looft C, Tholen E. Breeding for reduced boar taint. Lohmann
Inf. 2011;46(1):21–7.
4. Sellier P, Roy PL, Fouilloux MN, Gruand J, Bonneau M. Responses to
restricted index selection and genetic parameters for fat androstenone
level and sexual maturity status of young boars. Livestock Production Sci.
2000;63(3):265–74. doi:10.1016/S0301-6226(99)00127-X.
5. Tajet H, Andresen O, Meuwissen THE. Estimation of genetic parameters
of boar taint; skatole and androstenone and their correlations with sexual
maturation. Acta Veterinaria Scandinavica. 2006;48(Suppl 1):9.
doi:10.1186/1751-0147-48-S1-S9.
6. Robic A, Larzul C, Bonneau M. Genetic and metabolic aspects of
androstenone and skatole deposition in pig adipose tissue. A review.
Genet Sel Evol. 2008;40(1):129. doi:10.1186/1297-9686-40-1-129.
7. Haugen J-E, Brunius C, Zamaratskaia G. Review of analytical methods to
measure boar taint compounds in porcine adipose tissue: the need for
harmonised methods. Meat Sci. 2012;90(1):9–19.
doi:10.1016/j.meatsci.2011.07.005.
8. Mörlein D, Grave A, Sharifi AR, Bücking M, Wicke M. Different scalding
techniques do not affect boar taint. Meat Sci. 2012;91(4):435–40.
doi:10.1016/j.meatsci.2012.02.028.
9. James Squires E. Metabolism of androstenone and skatole. In: Applied
Animal Endocrinology. 2nd edn. Cambridge: Cambridge University Press;
103. Chap. 1.2.
10. Gunawan A, Sahadevan S, Neuhoff C, Große-Brinkhaus C, Gad A,
Frieden L, et al. RNA deep sequencing reveals novel candiyear genes and
polymorphisms in boar testis and liver tissues with divergent
androstenone levels. PLoS ONE. 2013;8(5):63259.
doi:10.1371/journal.pone.0063259.
11. Moe M, Grindflek E, Doran O. Expression of 3beta-hydroxysteroid
dehydrogenase, cytochrome P450-c17, and sulfotransferase 2B1 proteins
in liver and testis of pigs of two breeds: relationship with adipose tissue
androstenone concentration. J Animal Sci. 2007;85(11):2924–31.
doi:10.2527/jas.2007-0283.
12. Boulliou-Robic A, Feve K, Larzul C, Billon Y, Van Son M, Liaubet L, et al.
Expression levels of 25 genes in liver and testis located in a QTL region for
androstenone on SSC7q1.2. Animal Genet. 2011;42(6):662–5.
doi:10.1111/j.1365-2052.2011.02195.x.
13. Doran E, Whittington FM, Wood JD, McGivan JD. Characterisation of
androstenone metabolism in pig liver microsomes. Chemico-Biol Interact.
2004;147(2):14114–9. doi:10.1016/j.cbi.2003.12.002.
14. Robic A, Fève K, Larzul C, Billon Y, van Son M, Liaubet L, et al. Expression
levels of 25 genes in liver and testis located in a QTL region for
androstenone on SSC7q1.2. Animal Genet. 2011;42(6):662–5.
15. Moe M, Lien S, Bendixen C, Hedegaard J, Hornshøj H, Berget I, et al.
Gene expression profiles in liver of pigs with extreme high and low levels
of androstenone. BMC Veterinary Res. 2008;4:29.
16. Cue R-A, Nicolau-Solano SI, McGivan JD, Wood JD, Doran O.
Breed-associated variations in the sequence of the pig
3beta-hydroxysteroid dehydrogenase gene. J Animal Sci. 2007;85(3):
571–6. doi:10.2527/jas.2006-366.
17. Xu C, Li CY-T, Kong A-NT. Induction of phase I, II and III drug
metabolism/transport by xenobiotics. Arch Pharmacal Res. 2005;28(3):
249–68.
18. Schänzer W. Metabolism of anabolic androgenic steroids. Clin Chem.
1996;42(7):1001–20.
Sahadevan et al. BMC Genetics (2015) 16:21
19. Xie W, Yeuh M-F, Radominska-Pandya A, Saini SPS, Negishi Y, Bottroff
BS, et al. Control of steroid, heme, and carcinogen metabolism by nuclear
pregnane X receptor and constitutive androstane receptor. Proc Nat
Acad Sci. 2003;100(7):4150–5. doi:10.1073/pnas.0438010100.
20. Handschin C, Meyer UA. Induction of drug metabolism: the role of nuclear
receptors. Pharmacol Rev. 2003;55(4):649–73. doi:10.1124/pr.55.4.2.
21. Nicolau-Solano SI, McGivan JD, Whittington FM, Nieuwhof GJ, Wood JD,
Doran O. Relationship between the expression of hepatic but not
testicular 3beta-hydroxysteroid dehydrogenase with androstenone
deposition in pig adipose tissue. J Animal Sci. 2006;84(10):2809–17.
doi:10.2527/jas.2005-595.
22. Sinclair PA, Hancock S, Gilmore WJ, Squires EJ. Metabolism of the
16-androstene steroids in primary cultured porcine hepatocytes. J Steroid
Biochem. 2005;96(1):79–87. doi:10.1016/j.jsbmb.2005.01.030.
23. Moe M, Meuwissen T, Lien S, Bendixen C, Wang X, Conley LN, et al.
Gene expression profiles in testis of pigs with extreme high and low
levels of androstenone. BMC Genomics. 2007;8(1):405.
24. Grindflek E, Berget I, Moe M, Oeth P, Lien S. r. Transcript profiling of
candiyear genes in testis of pigs exhibiting large differences in
androstenone levels. BMC Genet. 2010;11(1):4.
doi:10.1186/1471-2156-11-4.
25. Babraham Bioinformatics - FastQC A Quality Control tool for high
throughput sequence data. />projects/fastqc/ Accessed 17/06/13.
26. Trapnell C, Pachter L, Salzberg SL. TopHat: discovering splice junctions
with RNA-Seq. Bioinformatics. 2009;25(9):1105–11.
doi:10.1093/bioinformatics/btp120.
27. Quinlan AR, Hall IM. BEDTools: a flexible suite of utilities for comparing
genomic features. Bioinformatics. 2010;26(6):841–2.
doi:10.1093/bioinformatics/btq033.
28. Robinson MD, McCarthy DJ, Smyth GK. edgeR: a Bioconductor package
for differential expression analysis of digital gene expression data.
Bioinformatics. 2010;26(1):139–40. doi:10.1093/bioinformatics/btp616.
29. Law CW, Chen Y, Shi W, Smyth GK. Voom! Precision weights unlock
linear model analysis tools for RNA-seq read counts. Technical report,
Bioinformatics Division, Walter and Eliza Hall Institute of Medical Research.
Australia: Melbourne; 2013.
30. Smyth GK. Limma: linear models for microarray data. In: Bioinformatics
and Computational Biology Solutions Using {R} and Bioconductor. New
York: Springer; 2005. p. 397–420.
31. R Development Core Team RDC. R. A Language and Environment for
Statistical Computing. Vienna, Austria: Technical report, R Foundation for
Statistical Computing; 2013.
32. Davis S, Meltzer PS. GEOquery: a bridge between the Gene Expression
Omnibus (GEO) and BioConductor. Bioinformatics. 2007;23(14):1846–7.
doi:10.1093/bioinformatics/btm254.
33. Archibald AL, Bolund L, Churcher C, Fredholm M, Groenen MAM,
Harlizius B, et al. Pig genome sequence–analysis and publication strategy.
BMC Genomics. 2010;11(1):438. doi:10.1186/1471-2164-11-438.
34. Mount DW. Using the Basic Local Alignment Search Tool (BLAST). CSH
protocols. 2007;2007(7):17. doi:10.1101/pdb.top17.
35. Stuart JM, Segal E, Koller D, Kim SK. A gene-coexpression network for
global discovery of conserved genetic modules. Science. 2003;302(5643):
249–55. doi:10.1126/science.1087447.
36. Rosvall M, Axelsson D, Bergstrom CT. The map equation. Eur Phys J
Special Top. 2010;178(1):13–23. doi:10.1140/epjst/e2010-01179-1.
37. Lancichinetti A, Fortunato S. Community detection algorithms: A
comparative analysis. Physical Review E. 2009;80(5):12.
doi:10.1103/PhysRevE.80.056117.0908.1062.
38. Lancichinetti A, Radicchi F, Ramasco JJ, Fortunato S. Finding statistically
significant communities in networks. PLoS ONE. 2011;6(4):18961.
doi:10.1371/journal.pone.0018961.
39. Clauset A, Newman M, Moore C. Finding community structure in very
large networks. Phys Rev E. 2004;70(6):066111.
doi:10.1103/PhysRevE.70.066111.
40. Blondel VD, Guillaume J-L, Lambiotte R, Lefebvre E. Fast unfolding of
communities in large networks. J Stat Mech: Theory Exp. 2008;2008(10):
10008. doi:10.1088/1742-5468/2008/10/P10008.
41. Raghavan U, Albert R, Kumara S. Near linear time algorithm to detect
community structures in large-scale networks. Phys Rev E. 2007;76(3):
036106. doi:10.1103/PhysRevE.76.036106.
Page 17 of 18
42. Lancichinetti A, Fortunato S. Consensus clustering in complex networks.
Sci R. 2012;2:336. doi:10.1038/srep00336.
43. Goder A, Filkov V. Consensus Clustering Algorithms: Comparison and
Refinement. In: Proc. 9th Workshop on Algorithm Engineering and
Experiments (ALENEX’08). San Francisco, California, USA: SIAM; 2008.
p. 109–17.
44. Topchy A, Jain AK, Punch W. Clustering ensembles: models of consensus
and weak partitions. IEEE Trans Pattern Anal Machine Intelligence.
2005;27(12):1866–81. doi:10.1109/TPAMI.2005.237.
45. Strehl A, Ghosh J, Cardie C., Cluster Ensembles - A. Knowledge Reuse
Framework for Combining Multiple Partitions. J Machine Learning Res.
2002;3:583–617.
46. Alexa A, Rahnenfuhrer J. topGO: Enrichment analysis for Gene Ontology:
Technical report; 2010.
47. Alexa A, Rahnenführer J, Lengauer T. Improved scoring of functional
groups from gene expression data by decorrelating GO graph structure.
Bioinformatics. 2006;22(13):1600–7. doi:10.1093/bioinformatics/btl140.
48. Lord PW, Stevens RD, Brass A, Goble CA. Investigating semantic
similarity measures across the Gene Ontology: the relationship between
sequence and annotation. Bioinformatics. 2003;19(10):1275–83.
doi:10.1093/bioinformatics/btg153.
49. Schlicker A, Domingues FS, Rahnenführer J, Lengauer T. A new measure
for functional similarity of gene products based on Gene Ontology. BMC
Bioinf. 2006;7:302. doi:10.1186/1471-2105-7-302.
50. Wang JZ, Du Z, Payattakool R, Yu PS, Chen C-F. A new method to
measure the semantic similarity of GO terms. Bioinformatics. 2007;23(10):
1274–81. doi:10.1093/bioinformatics/btm087.
51. Resnik P. Semantic similarity in a taxonomy: An information-based
measure and its application to problems of ambiguity in natural
language. J Artif Intelligence Res. 1999;11:95–130.
52. Jiang JJ, Conrath DW. Semantic similarity based on corpus statistics and
lexical taxonomy. In: Proceedings of the International Conference on
Research in Computational Linguistics. Taipei: Computing Research
Repository; 1997. p. 19–33.
53. Lin D. An Information-Theoretic Definition of Similarity. In: ICML. Madison.
USA: Morgan Kaufmann; 1998. p. 296–304.
54. Yu G, Li F, Qin Y, Bo X, Wu Y, Wang S. GOSemSim: an R package for
measuring semantic similarity among GO terms and gene products.
Bioinformatics. 2010;26(7):976–8. doi:10.1093/bioinformatics/btq064.
55. Shannon P, Markiel A, Ozier O, Baliga NS, Wang JT, Ramage D, et al.
Cytoscape: A software environment for integrated models of
biomolecular interaction networks. Genome Res. 2003;13:2498–504.
56. Gibson GG, Skett P, Introduction to Drug Metabolism, illustrate edn.
Cheltenham, Great Britain: Nelson Thornes Publishers; 2001, p. 256.
57. Xie W. Nuclear Receptors in Drug Metabolism. New Jersey, USA: Wiley;
2008, p. 336.
58. de Montellano PRO. New York: Springer, p. 652.
59. Foye WO, Lemke TL, Williams DA. Foye’s Principles of Medicinal
Chemistry: Philadelphia: Lippincott Williams & Wilkins; 2008, p. 1377.
60. Jin Y, Penning TM. Steroid 5alpha-reductases and 3alpha-hydroxysteroid
dehydrogenases: key enzymes in androgen metabolism. Best Pract & Res
Clin Endocrinology & Metab. 2001;15(1):79–94.
doi:10.1053/beem.2001.0120.
61. Yoshida A, Rzhetsky A, Hsu LC, Chang C. Human aldehyde
dehydrogenase gene family. Eur J Biochem/FEBS. 1998;251(3):549–57.
62. Vasiliou V, Nebert DW. Analysis and upyear of the human aldehyde
dehydrogenase (ALDH) gene family. Human Genomics. 2005;2(2):138–43.
63. Mackenzie PI, Bock KW, Burchell B, Guillemette C, Ikushiro S-i, Iyanagi T,
et al. Nomenclature upyear for the mammalian UDP glycosyltransferase
(UGT) gene superfamily. Pharmacogenetics and Genomics. 2005;15(10):
677–85.
64. Coffman BL, King CD, Rios GR, Tephly TR. The Glucuronidation of
Opioids, Other Xenobiotics, and Androgens by Human UGT2B7Y(268)
and UGT2B7H(268). Drug Metab Dispos. 1998;26(1):73–7.
65. Ritter JK. Roles of glucuronidation and UDP-glucuronosyltransferases in
xenobiotic bioactivation reactions. Chemico-Biol Interact. 2000;129(1-2):
171–93. doi:10.1016/S0009-2797(00)00198-8.
66. Turgeon D. Glucuronidation activity of the UGT2B17 enzyme toward
xenobiotics. Drug Metab Dispos. 2003;31(5):670–6.
doi:10.1124/dmd.31.5.670.
Sahadevan et al. BMC Genetics (2015) 16:21
67. Jin Y, Duan L, Lee SH, Kloosterboer HJ, Blair IA, Penning TM. Human
cytosolic hydroxysteroid dehydrogenases of the aldo-ketoreductase
superfamily catalyze reduction of conjugated steroids: implications for
phase I and phase II steroid hormone metabolism. J Biol Chem.
2009;284(15):10013–22. doi:10.1074/jbc.M809465200.
68. Beaulieu M, Lévesque E, Barbier O, Turgeon D, Bélanger G, Hum DW,
et al. Isolation and characterization of a simian
UDP-glucuronosyltransferase UGT2B18 active on 3-hydroxyandrogens.
J Mol Biol. 1998;275(5):785–94. doi:10.1006/jmbi.1997.1486.
69. Kojima M, Degawa M. Sex Differences in the Constitutive Gene Expression
of Sulfotransferases and UDP-glucuronosyltransferases in the Pig Liver:
Androgen-Mediated Regulation. Drug Metab Pharmacokinetics [Epub].
2014;29(2):192–7. />70. Soars MG, Fettes M, O’Sullivan AC, Riley RJ, Ethell BT, Burchell B. Cloning
and characterisation of the first drug-metabolising canine
UDP-glucuronosyltransferase of the 2B subfamily. Biochem Pharmacol.
2003;65(8):1251–9. doi:10.1016/S0006-2952(03)00064-9.
71. Chen W, Thiboutot D, Zouboulis CC. Cutaneous androgen metabolism:
basic research and clinical perspectives. J Investigative Dermatology.
2002;119(5):992–1007. doi:10.1046/j.1523-1747.2002.00613.x.
72. de Launoit Y, Adamski J. Unique multifunctional HSD17B4 gene product:
17beta-hydroxysteroid dehydrogenase 4 and D-3-hydroxyacyl-coenzyme
A dehydrogenase/hydratase involved in Zellweger syndrome. J Mol
Endrocrinology. 1999;22(3):227–40.
73. Prough RA, Webb SJ, Wu HQ, Lapenson DP, Waxman DJ. Induction of
microsomal and peroxisomal enzymes by dehydroepiandrosterone and
its reduced metabolite in rats. Cancer Res. 1994;54(11):2878–86.
74. He XY, Merz G, Yang YZ, Mehta P, Schulz H, Yang SY. Characterization
and localization of human type10 17beta-hydroxysteroid dehydrogenase.
Eur J Biochem/FEBS. 2001;268(18):4899–907.
75. Skogsberg J, Lundström J, Kovacs A, Nilsson R, Noori P, Maleki S, et al.
Transcriptional profiling uncovers a network of cholesterol-responsive
atherosclerosis target genes. PLoS Genet. 2008;4(3):1000036.
doi:10.1371/journal.pgen.1000036.
76. Emami Riedmaier A, Nies AT, Schaeffeler E, Schwab M. Organic anion
transporters and their implications in pharmacotherapy. Pharmacol Rev.
2012;64(3):421–49. doi:10.1124/pr.111.004614.
77. Muzio G, Maggiora M, Paiuzzi E, Oraldi M, Canuto RA. Aldehyde
dehydrogenases and cell proliferation. Free Radical Biol Med. 2012;52(4):
735–46. doi:10.1016/j.freeradbiomed.2011.11.033.
78. Zhang Y, Dufort I, Rheault P, Luu-The V. Characterization of a human
20alpha-hydroxysteroid dehydrogenase. J Mol Endrocrinology.
2000;25(2):221–28.
79. Steckelbroeck S, Jin Y, Gopishetty S, Oyesanmi B, Penning TM. Human
cytosolic 3alpha-hydroxysteroid dehydrogenases of the aldo-keto
reductase superfamily display significant 3beta-hydroxysteroid
dehydrogenase activity: implications for steroid hormone metabolism
and action. J Biol Chem. 2004;279(11):10784–95.
doi:10.1074/jbc.M313308200.
80. Lou H, Du S, Ji Q, Stolz A. Induction of AKR1C2 by phase II inducers:
identification of a distal consensus antioxidant response element
regulated by NRF2. Mol Pharmacol. 2006;69(5):1662–72.
doi:10.1124/mol.105.019794.
81. Brooks SA, Harris A. Breast Cancer Research Protocols. Biomed Protoc.
New York: Humana Press; 2006, p. 517.
82. der Zee AHM, Daly AK. Pharmacogenetics and Individualized Therapy:
Wiley; 2012, p. 432.
83. Riegelhaupt JJ, Waase MP, Garbarino J, Cruz DE, Breslow JL. Targeted
disruption of steroidogenic acute regulatory protein D4 leads to modest
weight reduction and minor alterations in lipid metabolism. J Lipid Res.
2010;51(5):1134–43. doi:10.1194/jlr.M003095.
84. Rodriguez-Agudo D, Ren S, Wong E, Marques D, Redford K, Gil G, et al.
Intracellular cholesterol transporter StarD4 binds free cholesterol and
increases cholesteryl ester formation. J Lipid Res. 2008;49(7):1409–19.
doi:10.1194/jlr.M700537-JLR200.
85. Rodriguez-Agudo D, Calderon-Dominguez M, Ren S, Marques D,
Redford K, Medina-Torres MA, et al. Subcellular localization and
regulation of StarD4 protein in macrophages and fibroblasts. Biochim et
Biophysica Acta. 2011;1811(10):597–606. doi:10.1016/j.bbalip.2011.06.028.
Page 18 of 18
86. Mesmin B, Pipalia NH, Lund FW, Ramlall TF, Sokolov A, Eliezer D, et al.
STARD4 abundance regulates sterol transport and sensing. Mol Biol Cell.
2011;22(21):4004–15. doi:10.1091/mbc.E11-04-0372.
87. Plapp BV, Berst KB. Specificity of human alcohol dehydrogenase 1C*2
(gamma2gamma2) for steroids and simulation of the uncompetitive
inhibition of ethanol metabolism. Chemico-biol Interact.
2003;143-144:183–93.
88. Lösel RM, Besong D, Peluso JJ, Wehling M. Progesterone receptor
membrane component 1–many tasks for a versatile protein. Steroids.
2008;73(9-10):929–34. doi:10.1016/j.steroids.2007.12.017.
89. Venturini I, Zeneroli ML, Corsi L, Baraldi C, Ferrarese C, Pecora N, et al.
Diazepam binding inhibitor and total cholesterol plasma levels in
cirrhosis and hepatocellular carcinoma. Regul Peptides. 1998;74(1):31–4.
90. Rasmussen JT, Rosendal J, Knudsen J. Interaction of acyl-CoA binding
protein (ACBP) on processes for which acyl-CoA is a substrate, product or
inhibitor. Biochem J. 1993;292(Pt.3):907–13.
91. Taulan M, Paquet F, Maubert C, Delissen O, Demaille J, Romey M-C.
Renal toxicogenomic response to chronic uranyl nitrate insult in mice.
Environ Health Perspect. 2004;112(16):1628–35.
92. Stanley WA, Filipp FV, Kursula P, Schüller N, Erdmann R, Schliebs W, et
al. Recognition of a functional peroxisome type 1 target by the dynamic
import receptor Pex5p. Mol Cell. 2006;24(5):653–63.
doi:10.1016/j.molcel.2006.10.024.
93. Fuchs M, Hafer A, Münch C, Kannenberg F, Teichmann S, Scheibner J,
et al. Disruption of the sterol carrier protein 2 gene in mice impairs biliary
lipid and hepatic cholesterol metabolism. J Biol Chem. 2001;276(51):
48058–65. doi:10.1074/jbc.M106732200.
94. Garattini E, Fratelli M, Terao M. The mammalian aldehyde oxidase gene
family. Human Genomics. 2009;4(2):119–30.
95. Müller JM, Isele U, Metzger E, Rempel A, Moser M, Pscherer A, et al.
FHL2, a novel tissue-specific coactivator of the androgen receptor. EMBO
J. 2000;19(3):359–69. doi:10.1093/emboj/19.3.359.
96. Heemers HV, Regan KM, Dehm SM, Tindall DJ. Androgen induction of
the androgen receptor coactivator four and a half LIM domain protein-2:
evidence for a role for serum response factor in prostate cancer. Cancer
Res. 2007;67(21):10592–9. doi:10.1158/0008-5472.CAN-07-1917.
97. Kleiber K, Strebhardt K, Martin BT. The biological relevance of FHL2 in
tumour cells and its role as a putative cancer target. Anticancer Res.
2007;27(1A):55–61.
98. Draganov DI, Teiber JF, Speelman A, Osawa Y, Sunahara R, La Du BN.
Human paraoxonases (PON1, PON2, and PON3) are lactonases with
overlapping and distinct substrate specificities. J Lipid Res. 2005;46(6):
1239–47. doi:10.1194/jlr.M400511-JLR200.
Submit your next manuscript to BioMed Central
and take full advantage of:
• Convenient online submission
• Thorough peer review
• No space constraints or color figure charges
• Immediate publication on acceptance
• Inclusion in PubMed, CAS, Scopus and Google Scholar
• Research which is freely available for redistribution
Submit your manuscript at
www.biomedcentral.com/submit