Genome-wide detection and characterization of positive selection in Korean Native Black Pig from Jeju Island
Bạn đang xem bản rút gọn của tài liệu. Xem và tải ngay bản đầy đủ của tài liệu tại đây (1.34 MB, 9 trang )
Kim et al. BMC Genetics (2015) 16:3
DOI 10.1186/s12863-014-0160-1
RESEARCH ARTICLE
Open Access
Genome-wide detection and characterization of
positive selection in Korean Native Black Pig from
Jeju Island
Jaemin Kim1, Seoae Cho2, Kelsey Caetano-Anolles4, Heebal Kim1,2,3* and Youn-Chul Ryu5*
Abstract
Background: In the 1980s, Korean native black pigs from Jeju Island (Jeju black pigs) served as representative
sample of Korean native black pigs, and efforts were made to help the species rebound from the brink of
extinction, which occurred as a result of the introduction of Western pig breeds. Geographical separation of Jeju
Island from the Korean peninsula has allowed Jeju black pigs not only to acquire unique characteristics but also to
retain merits of rare Korean native black pigs.
Results: To further analyze the Jeju black pig genome, we performed whole-genome re-sequencing (average read
depth of 14×) of 8 Jeju black pig and 6 Korean pigs (which live on the Korean peninsula) to compare and identify
putative signatures of positive selection in Jeju black pig, the true and pure Korean native black pigs. The candidate
genes potentially under positive selection in Jeju black pig support previous reports of high marbling score, rare occurrence of pale, soft, exudative (PSE) meat, but low growth rate and carcass weight compared to Western breeds.
Conclusions: Several candidate genes potentially under positive selection were involved in fatty acid transport and
may have contributed to the unique characteristics of meat quality in JBP. Jeju black pigs can offer a unique
opportunity to investigate the true genetic resource of once endangered Korean native black pigs. Further
genome-wide analyses of Jeju black pigs on a larger population scale are required in order to define a conservation
strategy and improvement of native pig resources.
Keywords: Korean native black pig, Jeju black pig, Positive selection
Background
The Korean native black pig (KNBP) represents only a
minor proportion of the total pig population in Korea,
yet the demand for its meat product is exceptionally
high due to its higher fat content and redness compared
to that of other commercial breeds [1]. Although the
economic value of this breed is well appreciated, KNBP
shows a relatively slower growth rate and lighter carcass
weight [2], which has led to the introduction of improved breeds such as Hampshire and Berkshire pigs for
both growth and lean meat production since the 1970’s
[3]. This massive influx of industrial pig breeds has
* Correspondence: ;
1
Interdisciplinary Program in Bioinformatics, Seoul National University, Seoul
151-742, Korea
5
Division of Biotechnology, The Research Institute for Subtropical Agriculture
and Biotechnology, Jeju National University, Jeju 690-756, Republic of Korea
Full list of author information is available at the end of the article
resulted in a significant recession in the population of
native pig, as well as a loss of genetic resources. KNBP
has been reported to comprise only around 0.74% of a
total of 9.19 million pigs in Korea [1]; most black pigs in
Korea appear to be the crossbreds of untraceable origin
[4]. The National Livestock Research Institute in Korea
[5] selected Korean native black pigs from Jeju Island (or
Jeju black pig, JBP) as a representative sample of KNBP
and began attempts to restore and conserve genetic diversity of the native pig species in 1988. JBP has been
isolated from the main Korean peninsula, and this longterm isolation has resulted in unique genetic characteristics of the JBP in addition to its inherent characteristics
as KNBP.
JBP is considered as the rare representative of true
KNBP [4], of which genetic resources are of prime importance in industrial breeding programs. JBP is known
for higher marbling score than Western breeds [6] and
© 2015 Kim et al.; licensee Biomed Central. This is an Open Access article distributed under the terms of the Creative
Commons Attribution License ( which permits unrestricted use, distribution, and
reproduction in any medium, provided the original work is properly credited. The Creative Commons Public Domain
Dedication waiver ( applies to the data made available in this article,
unless otherwise stated.
Kim et al. BMC Genetics (2015) 16:3
desirable characteristics such as tenderness, juiciness,
redness and brightness [2], besides its strong disease tolerance [1]. It is also known that JBP rarely showed PSE
(pale, soft, exudative) appearance [2], where PSE describes a carcass quality condition characterized by the
dry meat and unattractive to consumers. However, the
biological basis for these characteristics of JBP has not
been clearly demonstrated.
Recently, several studies have identified loci under selection to unveil the selective pressures at the genomic
level to identify candidate genes associated with economic traits in pigs [7]. For example, Li et al. identified
the MC1R gene which has a key role to black coat color
in Chinese domestic pigs from selection signatures [8].
Rubin et al. searched for genetic variants showing allele
frequency differences between pig and wild boar populations to reveal some genomic regions that underlie
phenotypic evolution in European domestic pigs [9].
To better understand the genome-wide genetic structure of JBP population and search for signatures of positive selection, the whole genomes of 8 Jeju JBP and 6 KP
were sequenced. As mentioned earlier, most pigs in
Korea (KP) have been crossed with European pig breeds
and thus are not true representatives of Korean native
black pigs. Using KP as a comparable population to JBP,
we applied haplotype test to decipher regions under
positive selection in JBP of which genetic resources help
understand KNBP that are gradually rebounding from
the verge of extinction.
Methods
Page 2 of 9
achieved, and on average across all samples, the reads covered 98.60% of the genome (Additional file 1: Table S1).
Several open-source software packages were used for
downstream analyses and variant calling. Adopting the
“REMOVE_DUPLICATES = true” option in the “MarkDuplicates” command-line tool of Picard (http://picard.
sourceforge.net), potential PCR duplicates were excluded. We then used SAMtools [11] to construct index
files for reference and bam files. Relying on the arguments
such as “RealignerTargetCreator” and “IndelRealigner” arguments, genome analysis toolkit 1.4 (GATK) [12] was
used to perform local realignment of reads to correct misalignments due to the presence of insertions/deletions.
Further, the “UnifiedGenotyper” and “SelectVariants”
arguments of GATK were used for identifying candidate
SNPs. In order to minimize possible false positives, argument “VariantFiltration” of the same software was used to
filter variants with the following criteria: 1) phred-scaled
quality score < 30; 2) MQ0 (mapping quality zero, which is
total count across all samples of mapping quality zero
reads) > 4 and quality depth (unfiltered depth of nonreference samples; low scores are indicative of false positives and artifacts) < 5; and FS (Phred-scaled P-value using
Fisher’s exact test, which represents variation on either the
forward or the reverse strand, which are indicative of false
positive calls) > 200.
BEAGLE was used [13] to infer the haplotype phase
for the entire set of pig populations. A summary of the
total number of SNPs and a distribution plot of SNPs
along the genome are provided in Additional file 1:
Table S2 and Figure S1.
Samples and DNA re-sequencing data
Whole-blood samples (10 mL) were collected from 8
JBP and 6 KP according to the guidelines for the Care
and Use of Laboratory Animals of the Institutional Ethical
Committee of Jeju National University. Paired-end reads
were generated using Illumina HiSeq2000. DNA was
extracted from whole blood using a G-DEXTMIIb Genomic DNA Extraction Kit (iNtRoN Biotechnology, Seoul,
Korea). 3 μg of genomic DNA was randomly sheared
using the Covaris System to generate inserts of ~300 bp.
Using the TruSeq DNA Sample Preparation Kit, the DNA
fragments were end-repaired, A-tailed, adaptor ligated,
and amplified. Paired-end sequencing was performed by
NICEM (National Instrumentation Center for Environmental Management of Seoul National University) using
the Illumina HiSeq2000 platform with TruSeq SBS Kit v3HS (Illumina). Finally, sequence data was generated using
the Illumina HiSeq system.
The paired-end reads were then mapped against the Sus
scrofa reference genome (Sscrofa 10.2) using Bowtie2 [10].
We used default parameters (except the “–no-mixed” option) to eliminate unpaired alignments for paired reads.
An average read depth of 14.26× (9.89× ~ 16.98×) was
Detection of genomic regions with putative signals of
selection
Using whole SNP sets defined from both JBP and KP,
the method cross-population extended haplotype homozygosity (XP-EHH) was used to detect genome-wide selective sweep regions ( />[14]. XP-EHH defines two populations (A and B), a core
SNP, and a SNP X that are up to 1 Mb from the given core
SNP. A SNP X is selected such that its EHH with respect
to all chromosomes in both populations is as close as possible to 0.04. Next, the test focuses on the chromosomes
in each population to calculate EHH at all SNPs between
the core SNP and X; integrates it within these bounds (results are called IA and IB, respectively); finally defines an
XP-EHH log-ratio as ln(IA/IB) [15]. An XP-EHH score is
directional: an extreme positive score implies selection in
JBP, while a negative score suggests selection in the KP
population. The log ratios were standardized to have a
mean of 0 and variance of 1. An XP-EHH raw score distribution plot is provided in Additional file 1: Figure S2. We
then split the genome into non-overlapping segments of
50 kb to use the maximum XP-EHH score of all SNPs
Kim et al. BMC Genetics (2015) 16:3
within a window producing a summary statistic for each
window. To consider the SNP frequency, genomic windows were binned based on their numbers of SNPs in increments of 200 SNPs (combining all windows with more
than 600 SNPs into one bin). Within each bin, for each
window j, the fraction of windows with a value of the
statistic greater than that in j is defined as the empirical
P-value, according to the method previously introduced
[15,16]. The regions with P-values less than 0.01 (1%) were
considered strong signals in JBP. Throughout the paper,
the “P-values” indicate empirical P-values; in other words,
a low P-value implies that a locus is an outlier with respect
to the rest of the genome. As the loss of power incurred
by decreasing sample size is known to be modest with 20
chromosomes when size of second population is fixed
[15], minimum power loss in our study (16 JBP) can be
expected.
Additionally, the cross-population composite likelihood
ratio test (XP-CLR) for detecting selective sweeps that
involves jointly modeling the multilocus allele frequency
between two populations were performed [17]. XP-CLR
scores were calculated using scripts available at ( The
following parameters were used: non-overlapping sliding
windows of 50 kb, maximum number of SNPs allowed
within each window as 400, and correlation level of 0.95
to down-weight the pairs of SNPs in high LD. The regions with the XP-CLR values in the top 1% of the empirical distribution (XP-CLR > 79.39) were designated
candidate sweeps.
Minor allele frequency analysis and Tajima’s D statistic
For each population, the minor allele frequency (MAF)
was calculated at every position using VCFtools 4.0 [18].
The distribution of MAF along the genome is provided
in Additional file 1: Figure S3. The proportion of SNPs
with allele frequencies lower than threshold (MAF < 0.10)
was then calculated within sliding windows of 100 kb in
size every 20 kb, comprising a total of 127,888 bins. This
threshold was chosen to maximize sensitivity as suggested
by previous studies [19,20], and we also applied a minimum number of SNPs per window (at l�������������������������������������������������������������������������������������������������������������������������������������������������������������������������������������������������������������������������������������������������������������������������������������������������������������������������������������������������������������������������������������������������������������������������������������������������������������������������������������������������������������������������������������������������������������������������������������������������������������������������������������������������������������������������������������������������������������������������������������������������������������������������������������������������������������������������������������������������������������������������������������������������������������������������������������������������������������������������������������������������������������������������������������������������������������������������������������������������������������������������������������������������������������������������������������������������������������������������������������������������������������������������������������������������������������������������������������������������������������������������������������������������������������������������������������������������������������������������������������������������������������������������������������������������������������������������������������������������������������������������������������������������������������������������������������������������������������������������������������������������������������������������������������������������������������������������������������������������������������������������������������������������������������������������������������������������������������������������������������������������������������������������������������������������������������������������������������������������������������������������������������������������������������������������������������������������������������������������������������������������������������������������������������������������������������������������������������������������������������������������������������������������������������������������������������������������������������������������������������������������������������������������������������������������������������������������������������������������������������������������������������������������������������������������������������������������������������������������������������������������������������������������������������������������������������������������������������������������������������������������������������������������������������������������������������������������������������������������������������������������������������������������������������������������������������������������������������������������������������������������������������������������������������������������������������������������������������������������������������������������������������������������������������������������������������������������������������������������������������������������������������������������������������������������������������������������������������������������������������������������������������������������������������������������������������������������������������������������������������������������������������������������������������������������������������������������������������������������������������������������������������������������������������������������������������������������������������������������������������������������������������������������������������������������������������������������������������������������������������������������������������������������������������������������������������������������������������������������������������������������������������������������������������������������������������������������������������������������������������������������������������������������������������������������������������������������������������������������������������������������������������������������������������������������������������������������������������������������������������������������������������������������������������������������������������������������������������������������������������������������������������������������������������������������������������������������������������������������������������������������������������������������������������������������������������������������������������������������������������������������������������������������������������������������������������������������������������������������������������������������������������������������������������������������������������������������������������������������������������������������������������������������������������������������������������������������������������������������������������������������������������������������������������������������������������������������������������������������������������������������������������������������������������������������������������������������������������������������������������������������������������������������������������������������������������������������������������������������������������������������������������������������������������������������������������������������������������������������������������������������������������������������������������������������������������������������������������������������������������������������������������������������������������������������������������������������������������������������������������������������������������������������������������������������������������������������������������������������������������������������������������������������������������������������������������������������������������������������������������������������������������������������������������������������������������������������������������������������������������������������������������������������������������������������������������������������������������������������������������������������������������������������������������������������������������������������������������������������������������������������������������������������������������������������������������������������������������������������������������������������������������������������������������������������������������������������������������������������������������������������������������������������������������������������������������������������������������������������������������������������������������������������������������������������������������������������������������������������������������������������������������������������������������������������������������������������������������������������������������������������������������������������������������������������������������������������������������������������������������������������������������������������������������������������������������������������������������������������������������������������������������������������������������������������������������������������������������������������������������������������������������������������������������������������������������������������������������������������������������������������������������������������������������������������������������������������������������������������������������������������������������������������������������������������������������������������������������������������������������������������������������������������������������������������������������������������������������������������������������������������������������������������������������������������������������������������������������������������������������������������������������������������������������������������������������������������������������������������������������������������������������������������������������������������������������������������������������������������������������������������������������������������������� occur in stress-susceptible as well as growthselected animals, which might lead to the abnormality of
Ca2+ regulation and thus subject animals to the development of PSE meat [40]. Seven genes (FKBP1B, JAK2,
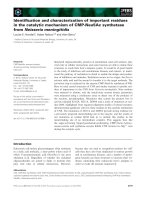
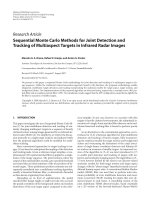
Figure 2 Gene ontology analysis of 392 putatively advantageous genes in JBP. Nodes represent gene ontology terms and imply that two
gene ontology terms share genes from the considered dataset. The most prominent gene ontology term for each group is highlighted in colors.
Kim et al. BMC Genetics (2015) 16:3
CD24, PTK2B, CACNA1I, CCR7, EPHX2) involved in calcium ion homeostasis (GO: 0055074) were also positively
selected in JBP.
Genes indicative of positive selection that are potentially
related to JBP meat quality
Fatty acids are involved in various “technological” aspects of meat quality. Variation in fatty acid composition
leads to different melting points and thus influences on
the firmness or softness of the fat in meat, especially
the subcutaneous, intermuscular (carcass fats) and the
intramuscular (marbling) fat [41]. JBP are known for a
high content of unsaturated fatty acid which contributes to the better meat quality. Therefore, we investigated genes involved in fatty acid composition based
on its gene function and gene ontology. Gene ontology
analysis revealed CD36 (P = 0.0036; XP-EHH = 4.67)
and ACE (XP-CLR = 122.14) in fatty acid transport
(GO: 0015908); ACSL6 (P = 0.0094; XP-EHH = 4.14)
and EPHX2 (XP-CLR = 96.97) in fatty acid metabolic
process (GO: 0006631). CD36 is a principal skeletal muscle fatty acid transporter, and the mRNA abundance of
this gene showed a strong positive correlation with intramuscular fat content, an important component of traits
that influence meat quality [42].
Page 6 of 9
In a previous study, genes in the PPAR signaling pathway were significantly associated with traits of porcine
meat quality, and KEGG pathway analysis identified two
genes enriched in this pathway (CD36 and ACSL6) [43].
Especially, long-chain acyl-CoA synthetase (ACSL) plays
an essential role in both lipid biosynthesis and fatty acid
degradation, and one of its subfamilies (ACSL4) is known
for its association with growth and meat quality traits
[44]. These candidate genes together may have contributed to the change in fatty acid composition and to the
unique features of meat quality in JBP. To further determine biological process at play, we used ClueGO, which
integrates gene ontology (GO) categories and creates a
functionally organized GO category networks based on
the overlap between the different GO categories [26].
The network showed the prominent gene ontology
term ‘plasma membrane long-chain fatty acid transport’
as enriched, which may have contributed to the change
in fatty acid composition and to the unique features of
meat quality in JBP (Figure 2).
Genes affecting height or body size and strong disease
tolerance
Korean native pigs show a slower growth rate and lighter
carcass weight [2]. ACE or angiotensin-converting enzyme
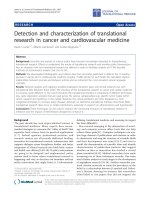
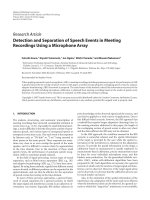
Figure 3 Minor allele frequency (top) and Tajima’s D analyses of ATP5V1H (A) and PPIL6 (B) gene regions. Plotted is the proportion of
SNPs with MAF < 0.10 within 100-kb sliding windows separated by 20-kb steps in Jeju native black pigs (green) and Korean pigs (orange). The
vertical dashed bar represents the candidate gene region of each candidate. In the same genomic region, Tajima’s D values in every 50 kb
window were plotted for both populations.
Kim et al. BMC Genetics (2015) 16:3
(XP-CLR = 122.14) inhibitors have been reported to reduce body weight in humans and mice [45,46]. We identified the genes known to be critical for human growth and
height from the online Mendelian Inheritance in Man
OMIM disease database [47]. The genes which intersected
with our selection scan include: ADCY3 (P = 0.0005; XPEHH = 5.12), DNMT3A (P = 0.0078; XP-EHH = 3.36),
DNAJC27 (P = 0.0085; XP-CLR = 4.20; XP-CLR = 314.97),
DTNB (P = 0.0044; XP-EHH = 4.59; XP-CLR = 144.73),
PPIL6, ZBTB24, and SMPD2 (XP-CLR = 114.20). We also
looked for genes related to immune system among genes
predicted to be under positive selection in JBP as they
exhibit abilities of strong disease tolerance [1]. There
was a significant overrepresentation of genes related to
‘positive regulation of immune response’ from XP-CLR
scan (GO:0050778, P = 0.036). Animal host defense mechanisms have been a function of the immune system, which
aims to detect and eliminate invading pathogens [48].
ATP6V1H (XP-CLR = 90.84) is related to defense response
to virus (GO: 0051607); DEFB1 (P = 0.0048; XP-EHH =
4.24) and TLR3 (P = 0.0028; XP-EHH = 4.54) are involved
in defense response to bacterium (GO: 0042742).
Page 7 of 9
selective maintenance of alleles within the JBP population compared to KP. Negative values of Tajima’s D indicate an excess of rare variation, consistent with either
population growth or positive selection, and we observed
a rapid drop of Tajima’s D value within regions of candidate gene under selection in JBP (Figure 3 and Additional
file 1: Figure S6).
Conclusions
JBP offer a rare opportunity to investigate the true genetic resource of once endangered KNBP. Many candidate genes putatively under positive selection were
identified, some of which could be crucial for understanding their unique characteristics. Further genomewide analyses of JBP on a population scale may help
conserve and improve native pig resources. Furthermore, as the pig is an exceptional biomedical model related to energy metabolism and obesity in humans,
analyzing the genetic basis of native pig breeds may be
extended to characterize the effect of putative candidate
genes for human [49].
Haplotype analysis of candidate gene region
Availability of supporting data
To further examine the putatively advantageous genes,
we analyzed extreme patterns of haplotype differentiation by performing haplotype analyses (Additional file 1:
Figure S4). JBP appears to exhibit longer LD patterns and
stronger LD blocks in CACNA1I and ZBTB24 gene regions. This suggested that an inherited functional constraint was present in this region; thus, they were retained
in JBP through selective sweep from their ancestor.
The whole genome sequence has been deposited at
GenBank under the Bioproject accession PRJNA254936.
Allele frequency threshold analysis and Tajima’s D
The distribution of minor allele frequencies (MAF) around
a given genomic region can also suggest particular selective pressures acting on it. An excess of low-frequency
alleles could reflect a recent selective sweep [20]. The proportion of SNPs with allele frequencies lower than a
threshold (MAF < 0.10) was calculated within sliding windows of 100 kb in size every 20 kb and plotted against
physical distance. We focused our attention to the regions
around the 9 major candidate genes defined from positive
selection scan that intersected with previous functional reports to validate the results. The proportion of SNPs with
MAF < 0.10 was plotted within multiple 100-kb sliding
windows along 1-Mb regions centered on each major
candidate gene for each population. Among genes of
interest, the distributions of ATP6V1H and PPIL6 genes
in JBP showed an excess of rare alleles within the genic
region compared to that in KP population (Figure 3
and Additional file 1: Figure S5).
In addition, analysis using Tajima’s D test also showed
significant departure from neutrality and indicated the
Additional files
Additional file 1: Table S1. Summary of resequencing statistics.
Table S2. Number of SNPs for each chromosome. Figure S1. Distribution
of SNPs along the genome. Figure S2. Distribution plots of XP-EHH raw
score. Figure S3. Distribution of Minor Allele Frequency (MAF) along the
genome. Figure S4. Haploview representation of pairwise linkage
disequilibria at the CACNA1I and ZBTB24 gene locus in JBP (above) and KP
(below) populations. Colors represent D’ values: dark red = high inter-SNP
D’; blue = statistically ambiguous D’; white – low-inter-SNP D’. Figure S5.
Minor allele frequency analysis of the candidate genes in JBP (green) and KP
(red) populations. Figure S6. Tajima’s D analysis of the candidate genes in
JBP (green) and KP (red) populations.
Additional file 2: Table S3. Summary of XP-EHH.
Additional file 3: Table S4. Summary of XP-CLR.
Competing interests
The authors declare that there are no competing financial interests. Also,
no conflict of interest exists in the submission of the manuscript, and
manuscript is approved by all authors for publication. The work described is
original research that has not been published elsewhere, and not under
consideration for publication, in whole or in part.
Authors’ contributions
JK designed the study, analyzed the data and wrote the manuscript. SC, KC,
HK and YCR conceived and designed the analysis. All authors read,
commented on, and approved the manuscript.
Acknowledgements
This study was supported by the grant (PJ009032) from the Next
Generation BioGreen 21 Program, Rural Development Administration,
Republic of Korea.
Kim et al. BMC Genetics (2015) 16:3
Author details
1
Interdisciplinary Program in Bioinformatics, Seoul National University, Seoul
151-742, Korea. 2CHO&KIM genomics, Main Bldg. #514, SNU Research Park,
Seoul National University Mt.4-2, NakSeoungDae, Gwanakgu, Seoul 151-919,
Republic of Korea. 3Department of Agricultural Biotechnology and Research
Institute of Population Genomics, Seoul National University, Seoul 151-742,
Republic of Korea. 4Department of Animal Sciences, University of Illinois,
Urbana, IL 61801, USA. 5Division of Biotechnology, The Research Institute for
Subtropical Agriculture and Biotechnology, Jeju National University, Jeju
690-756, Republic of Korea.
Received: 26 March 2014 Accepted: 30 December 2014
References
1. Kim D, Seong P, Cho S, Kim J, Lee J, Jo C, et al. Fatty acid composition and
meat quality traits of organically reared Korean native black pigs. Livest Sci.
2009;120(1):96–102.
2. Hwang I, Park B, Cho S, Kim J, Choi Y, Lee J. Identification of muscle
proteins related to objective meat quality in Korean native black pig. Asian
Australas J Anim Sci. 2004;17(11):1599–607.
3. Park B, Kim N, Lee C, Hwang I. Effect of fiber type on postmortem
proteolysis in longissimus muscle of Landrace and Korean native black pigs.
Meat Sci. 2007;77(4):482–91.
4. Han S-H, Shin K-Y, Lee S-S, Ko M-S, Jeong DK, Oh H-S, et al. SINE indel
polymorphism of AGL gene and association with growth and carcass traits
in Landrace× Jeju black pig F2 population. Mol Biol Rep. 2010;37(1):467–71.
5. Kim T, Kim K, Choi B, Yoon D, Jang G, Lee K, et al. Genetic structure of pig
breeds from Korea and China using microsatellite loci analysis. J Anim Sci.
2005;83(10):2255–63.
6. Cho I, Park H, Yoo C, Lee G, Lim H, Lee J, et al. QTL analysis of white blood
cell, platelet and red blood cell‐related traits in an F2 intercross between
Landrace and Korean native pigs. Anim Genet. 2011;42(6):621–6.
7. Yang S, Li X, Li K, Fan B, Tang Z. A genome-wide scan for signatures of
selection in Chinese indigenous and commercial pig breeds. BMC Genet.
2014;15(1):7.
8. Li J, Li HYJ, Li H, Ning T, Pan X, Shi P, et al. Artificial selection of the
melanocortin receptor 1 gene in Chinese domestic pigs during
domestication. Heredity. 2010;105(3):274–81.
9. Rubin C-J, Megens H-J, Barrio AM, Maqbool K, Sayyab S, Schwochow D,
et al. Strong signatures of selection in the domestic pig genome. Proc Natl
Acad Sci. 2012;109(48):19529–36.
10. Langmead B, Salzberg SL. Fast gapped-read alignment with Bowtie 2.
Nat Methods. 2012;9(4):357–9.
11. Li R, Fan W, Tian G, Zhu H, He L, Cai J, et al. The sequence and de novo
assembly of the giant panda genome. Nature. 2009;463(7279):311–7.
12. Nekrutenko A, Taylor J. Next-generation sequencing data interpretation:
enhancing reproducibility and accessibility. Nat Rev Genet. 2012;13(9):667–72.
13. Browning SR, Browning BL. Rapid and accurate haplotype phasing and
missing-data inference for whole-genome association studies by use of
localized haplotype clustering. Am J Hum Genet. 2007;81(5):1084.
14. Sabeti PC, Varilly P, Fry B, Lohmueller J, Hostetter E, Cotsapas C, et al.
Genome-wide detection and characterization of positive selection in human
populations. Nature. 2007;449(7164):913–8.
15. Pickrell JK, Coop G, Novembre J, Kudaravalli S, Li JZ, Absher D, et al. Signals
of recent positive selection in a worldwide sample of human populations.
Genome Res. 2009;19(5):826–37.
16. Granka JM, Henn BM, Gignoux CR, Kidd JM, Bustamante CD, Feldman MW.
Limited evidence for classic selective sweeps in African populations.
Genetics. 2012;192(3):1049–64.
17. Chen H, Patterson N, Reich D. Population differentiation as a test for
selective sweeps. Genome Res. 2010;20(3):393–402.
18. Danecek P, Auton A, Abecasis G, Albers CA, Banks E, DePristo MA, et al.
The variant call format and VCFtools. Bioinformatics. 2011;27(15):2156–8.
19. Walsh EC, Sabeti P, Hutcheson HB, Fry B, Schaffner SF, de Bakker PI, et al.
Searching for signals of evolutionary selection in 168 genes related to
immune function. Hum Genet. 2006;119(1–2):92–102.
20. Moreno-Estrada A, Tang K, Sikora M, Marquès-Bonet T, Casals F, Navarro A,
et al. Interrogating 11 fast-evolving genes for signatures of recent positive selection in worldwide human populations. Mol Biol Evol. 2009;26(10):2285–97.
Page 8 of 9
21. Excoffier L, Laval G, Schneider S. Arlequin (version 3.0): an integrated
software package for population genetics data analysis. Evol Bioinformatics
Online. 2005;1:47.
22. Purcell S, Neale B, Todd-Brown K, Thomas L, Ferreira MA, Bender D, et al.
PLINK: a tool set for whole-genome association and population-based
linkage analyses. Am J Hum Genet. 2007;81(3):559–75.
23. Hubisz MJ, Falush D, Stephens M, Pritchard JK. Inferring weak population
structure with the assistance of sample group information. Mol Ecol Resour.
2009;9(5):1322–32.
24. Barrett JC. Haploview: visualization and analysis of SNP genotype data.
Cold Spring Harb Protoc. 2009;2009(10):pdb. ip71.
25. Dennis Jr G, Sherman BT, Hosack DA, Yang J, Gao W, Lane HC, et al. DAVID:
database for annotation, visualization, and integrated discovery. Genome
Biol. 2003;4(5):3.
26. Bindea G, Mlecnik B, Hackl H, Charoentong P, Tosolini M, Kirilovsky A, et al.
ClueGO: a Cytoscape plug-in to decipher functionally grouped gene ontology
and pathway annotation networks. Bioinformatics. 2009;25(8):1091–3.
27. Shannon P, Markiel A, Ozier O, Baliga NS, Wang JT, Ramage D, et al.
Cytoscape: a software environment for integrated models of biomolecular
interaction networks. Genome Res. 2003;13(11):2498–504.
28. McKenna A, Hanna M, Banks E, Sivachenko A, Cibulskis K, Kernytsky A,
et al. The Genome Analysis Toolkit: a MapReduce framework for
analyzing next-generation DNA sequencing data. Genome Res.
2010;20(9):1297–303.
29. Li M, Tian S, Jin L, Zhou G, Li Y, Zhang Y, et al. Genomic analyses identify
distinct patterns of selection in domesticated pigs and Tibetan wild boars.
Nat Genet. 2013;45(12):1431–8.
30. Li M, Tian S, Yeung CK, Meng X, Tang Q, Niu L, et al. Whole-genome
sequencing of Berkshire (European native pig) provides insights into its
origin and domestication. Scientific reports. 2014;4:4678.
31. Amaral AJ, Megens H-J, Crooijmans RP, Heuven HC, Groenen MA. Linkage
disequilibrium decay and haplotype block structure in the pig. Genetics.
2008;179(1):569–79.
32. Grossman SR, Shylakhter I, Karlsson EK, Byrne EH, Morales S, Frieden G, et al.
A composite of multiple signals distinguishes causal variants in regions of
positive selection. Science. 2010;327(5967):883–6.
33. Cannon J, Morgan J, McKeith F, Smith G, Sonka S, Heavner J, et al. Pork
chain quality audit survey: quantification of pork quality characteristics1.
J Muscle Foods. 1996;7(1):29–44.
34. Cassens RG. Historical perspectives and current aspects of pork meat quality
in the USA. Food Chem. 2000;69(4):357–63.
35. Briskey E, Kastenchmidt L, Forrest J, Beecher G, Judge M, Cassens R, et al.
Biochemical aspects of post-mortem changes in porcine muscle. J Agric
Food Chem. 1966;14(3):201–7.
36. Nelson TE. Abnormality in calcium release from skeletal sarcoplasmic
reticulum of pigs susceptible to malignant hyperthermia. J Clin Invest.
1983;72(3):862.
37. Cheah K, Cheah A, Crosland A, Casey J, Webb A. Relationship between
Ca< sup> 2+</sup> release, sarcoplasmic Ca< sup> 2+</sup> glycolysis
and meat quality in halothane-sensitive and halothane-insensitive pigs.
Meat Sci. 1984;10(2):117–30.
38. Fujii J, Otsu K, Zorzato F, de Leon S, Khanna VK, Weiler JE, et al.
Identification of a mutation in porcine ryanodine receptor associated with
malignant hyperthermia. Science. 1991;253(5018):448–51.
39. Connelly TJ, El-Hayek R, Sukhareva M, Coronado R. L-thyroxine activates the
intracellular Ca2+ release channel of skeletal muscle sarcoplasmic reticulum.
Biochem Mol Biol Int. 1994;32(3):441–8.
40. Strasburg G, Chiang W. Pale, soft, exudative turkey—The role of ryanodine
receptor variation in meat quality. Poult Sci. 2009;88(7):1497–505.
41. Wood J, Richardson R, Nute G, Fisher A, Campo M, Kasapidou E, et al.
Effects of fatty acids on meat quality: a review. Meat Sci. 2004;66(1):21–32.
42. Jeong J, Kwon E, Im S, Seo K, Baik M. Expression of fat deposition and fat
removal genes is associated with intramuscular fat content in longissimus
dorsi muscle of Korean cattle steers. J Anim Sci. 2012;90(6):2044–53.
43. He K, Wang Q, Wang Z, Pan Y. Association study between gene
polymorphisms in PPAR signaling pathway and porcine meat quality traits.
Mamm Genome. 2013;24(7–8):322–31.
44. Mercade A, Estelle J, Pérez‐Enciso M, Varona L, Silio L, Noguera J, et al.
Characterization of the porcine acyl‐CoA synthetase long‐chain 4 gene
and its association with growth and meat quality traits. Anim Genet.
2006;37(3):219–24.
Kim et al. BMC Genetics (2015) 16:3
Page 9 of 9
45. Masuo K, Mikami H, Ogihara T, Tuck ML. Weight reduction and
pharmacologic treatment in obese hypertensives. Am J Hypertens.
2001;14(6):530–8.
46. Jayasooriya AP, Mathai ML, Walker LL, Begg DP, Denton DA, Cameron-Smith
D, et al. Mice lacking angiotensin-converting enzyme have increased energy
expenditure, with reduced fat mass and improved glucose clearance.
Proc Natl Acad Sci. 2008;105(18):6531–6.
47. Hamosh A, Scott AF, Amberger JS, Bocchini CA, McKusick VA. Online
Mendelian Inheritance in Man (OMIM), a knowledgebase of human genes
and genetic disorders. Nucleic Acids Res. 2005;33 suppl 1:D514–7.
48. Medzhitov R, Schneider DS, Soares MP. Disease tolerance as a defense
strategy. Science. 2012;335(6071):936–41.
49. Kim J, Lee T, Kim T-H, Lee K-T, Kim H. An integrated approach of
comparative genomics and heritability analysis of pig and human on
obesity trait: evidence for candidate genes on human chromosome 2.
BMC Genomics. 2012;13(1):711.
Submit your next manuscript to BioMed Central
and take full advantage of:
• Convenient online submission
• Thorough peer review
• No space constraints or color figure charges
• Immediate publication on acceptance
• Inclusion in PubMed, CAS, Scopus and Google Scholar
• Research which is freely available for redistribution
Submit your manuscript at
www.biomedcentral.com/submit