Association of TNF-alpha, IL-6 and IL-1beta gene polymorphisms with polycystic ovary syndrome: A meta-analysis
Bạn đang xem bản rút gọn của tài liệu. Xem và tải ngay bản đầy đủ của tài liệu tại đây (1.46 MB, 13 trang )
Guo et al. BMC Genetics (2015) 16:5
DOI 10.1186/s12863-015-0165-4
RESEARCH ARTICLE
Open Access
Association of TNF-alpha, IL-6 and IL-1beta gene
polymorphisms with polycystic ovary syndrome:
a meta-analysis
Renyong Guo1†, Ying Zheng2†, Jiezuan Yang3 and Nengneng Zheng2*
Abstract
Background: Several studies on the association of TNF-alpha (−308 G/A), IL-6 (−174 G/C) and IL-1beta (−511 C/T)
polymorphisms with polycystic ovary syndrome (PCOS) risk have reported conflicting results. The aim of the present
study was to assess these associations by meta-analysis.
Results: A total of 14 eligible articles (1665 cases/1687 controls) were included in this meta-analysis. The results
suggested that there was no obvious association between the TNF-alpha (−308 G/A) polymorphism and PCOS in
the overall population or subgroup analysis by ethnicity, Hardy–Weinberg equilibrium (HWE) in controls, genotyping
method, PCOS diagnosis criteria, and study sample size. Also, no obvious association was found between the
TNF-alpha (−308 G/A) polymorphism and obesity in patients with PCOS (body mass index [BMI] ≥ 25 kg/m2 vs.
BMI < 25 kg/m2). Regarding the IL-6 (−174 G/C) polymorphism, also no association was found in the overall
population in heterozygote comparison, dominant model, and recessive model. Even though an allelic model
(odds ratio [OR] = 0.63, 95% confidence interval [CI] = 0.41–0.96) and a homozygote comparison (OR = 0.52,
95% CI = 0.30–0.93) showed that the IL-6 (−174 G/C) polymorphism was marginally associated with PCOS.
Further subgroup analysis suggested that the effect size was not significant among HWE in controls (sample
size ≤ 200) and genotyping method of pyrosequencing under all genetic models. Similarly, there was no association
between the IL-1beta (−511 C/T) polymorphism and PCOS in the overall population or subgroup analysis under all
genetic models. Furthermore, no significant association was found between the IL-1beta (−511 C/T) polymorphism
and several clinical and biochemical parameters in patients with PCOS.
Conclusions: The results of this meta-analysis suggest that the TNF-alpha (−308 G/A), IL-6 (−174 G/C), and IL-1beta
(−511 C/T) polymorphisms may not be associated with PCOS risk. However, further case–control studies with
larger sample sizes are needed to confirm our results.
Keywords: Polycystic ovary syndrome, TNF-alpha, IL-6, IL-1beta, Polymorphism, Meta-analysis
Background
Polycystic ovary syndrome (PCOS) is a common and
complex endocrine disorder leading to reproductive dysfunction in females, with a prevalence of 5%–10% [1].
Hyperandrogenism, oligo/anovulation, polycystic ovaries,
hyperinsulinemia, and obesity are main manifestations of
PCOS with a subsequent increased risk for type 2 diabetes
[2]. Although the etiology of PCOS remains controversial,
* Correspondence:
†
Equal contributors
2
Department of Gynecology and Obstetrics, Tongde Hospital of Zhejiang
Province, Hangzhou, Zhejiang 310012, China
Full list of author information is available at the end of the article
interactions of hereditary and environmental factors are
reportedly associated with PCOS [3].
Recent studies have shown that chronic low grade inflammation is closely related to the incidence of PCOS
[4]. Pro-inflammatory cytokines, such as tumor necrosis
factor alpha (TNF-alpha), interleukin (IL)-6, and IL-1,
are prominent mediators of inflammation and have been
confirmed to be elevated in at least a subgroup of
women with PCOS [5-7]. The corpus luteum secretes
TNF-alpha and the levels of immunoreactive TNF-alpha
vary throughout the menstrual cycle [8]. TNF-alpha, IL-6,
and IL-1 are presumed to play pivotal roles in reproductive physiology, including regulation of ovarian steroid
© 2015 Guo et al.; licensee BioMed Central. This is an Open Access article distributed under the terms of the Creative
Commons Attribution License ( which permits unrestricted use, distribution, and
reproduction in any medium, provided the original work is properly credited. The Creative Commons Public Domain
Dedication waiver ( applies to the data made available in this article,
unless otherwise stated.
Guo et al. BMC Genetics (2015) 16:5
production, follicular maturation, and the processes of
ovulation, fertilization, and implantation– parameters all
affected in women with PCOS [9,10].
The TNF-alpha gene resides within the class III region
of the major histocompatibility complex and is located on
the short arm of chromosome 6 (6p21.3). A single nucleotide polymorphism (SNP) located at position −308 in the
promoter region of the TNF-alpha gene gives rise to a
G-A exchange, which has been associated with elevated
serum TNF-alpha concentrations in certain clinical states
[5,11]. The human IL-6 gene is located at chromosome
7p21-24 and has an upstream 303 bp promoter. A SNP,
which results in exchange of G-C at position −174 in the
promoter region of the IL-6 gene, has been found to
influence its transcription rate [12]. The IL-1 gene cluster
on chromosome 2q12-13 contains three related genes,
IL-1alpha, IL-1beta, and IL-1RN. A common C/T SNP of
the IL-1beta promoter at position −511 has been found to
correspond with altered IL-1beta protein expression both
in vitro and in vivo [13].
Recently, a number of research groups have evaluated the usefulness of the TNF-alpha (−308 G/A), IL-6
(−174 G/C), and IL-1beta (−511 C/T) polymorphisms as
potential susceptibility factors for PCOS. However, the results of published studies are inconclusive and even controversial [7,14-26], which could be due to differences in
the studied populations and limited sample sizes. Therefore, in this study, a meta-analysis of 14 eligible articles
was performed to clarify these inconsistences and provide
more conclusive results.
Methods
Page 2 of 13
between TNF-alpha (−308 G/A), IL-6 (−174 G/C) and
IL-1beta (−511 C/T) polymorphisms and susceptibility
to PCOS; (2) case–control studies based on unrelated individuals; (3) all patients met the diagnostic criteria for
PCOS; (4) must provide sufficient genotype data to calculate odds ratios (ORs) and 95% confidence intervals (CIs).
Articles that did not meet our inclusion criteria were excluded. When a study reported the results on different
ethnicities, we treated them independently.
Data extraction
Two authors independently extracted all data based on
the inclusion criteria listed above. Any disagreement was
subsequently resolved by consensus with a third author.
The following items were collected from each study: the
first author’s name, year of publication, source of publication, ethnicity of the population, sample size, PCOS
diagnostic criteria, genotyping method, genotype frequencies, and probability (p) value for the Hardy–Weinberg
equilibrium (HWE) in controls. If original genotype frequency data were unavailable in relevant articles, a request
for additional data was sent to the corresponding author.
Quality assessment
Two reviewers independently assessed the quality of every
included study according to the Newcastle-Ottawa Scale
(NOS) (www.ohri.ca/programs/clinical_epidemiology/oxford.
asp). This scale contains nine items (1 point for each) in
three parts relating to selection, comparability and ascertainment of exposure. A score of five or more was defined
as having high quality; otherwise, the study was regarded
as "low quality" [28].
Publication search and inclusion criteria
To identify all published reports on the association between
TNF-alpha (−308 G/A), IL-6 (−174 G/C), and IL-1beta
(−511 C/T) polymorphisms and PCOS risk, we performed
a systematic literature search of PubMed, ISI Web of
Science, Elsevier Science Direct, China Biology Medical
Literature Database, China National Knowledge Infrastructure,
and Wanfang online libraries using the terms “polymorphism or variant or mutation” and “polycystic ovary syndrome
or PCOS” and “tumor necrosis factor alpha or TNF-alpha
or interleukin-6 or IL-6 or interleukin-1beta or IL-1beta”
without any language restrictions. We also conducted a
manual search of references in the individual articles to
identify other potential publications. All clearly irrelevant
studies, case reports, editorials, and review articles were
excluded. The literature search was updated on September
15, 2014. This meta-analysis was conducted and reported
according to the Preferred Reporting Items for Systematic
Reviews and Meta-Analysis (PRISMA) Statement [27] (see
the checklist included in Additional file 1).
Eligible studies were selected according to the following
explicit inclusion criteria: (1) evaluated the association
Statistical analysis
Crude ORs with 95% CIs were used to assess the association between TNF-alpha (−308 G/A), IL-6 (−174 G/C)
and IL-1beta (−511 C/T) polymorphisms with PCOS
risk. Analysis of polymorphisms was conducted in at
least two studies. The pooled OR was calculated for the
allele model, homozygote comparison, heterozygote
comparison, dominant model, and recessive model. The
Z test was used to estimate the statistical significance of
pooled ORs and a p-value < 0.05 was considered statistically significant. Genotype frequencies of healthy controls
were tested for HWE using the χ2 test. The Cochran Q
test and I2 test were used to evaluate potential heterogeneity between studies. Significant heterogeneity was indicated by p < 0.10 for the Q test or I2 test of > 50% [29].
The pooled ORs were analyzed using the random effects
model [30]. Otherwise, the fixed effects model [31] was selected. Subgroup analyses were conducted to explore reasons for heterogeneity. In order to evaluate the influence
of single studies on the overall estimate, sensitivity analysis
was performed. Potential publication bias was diagnosed
Guo et al. BMC Genetics (2015) 16:5
Page 3 of 13
summarized in Table 1. Overall, six studies were conducted among Caucasians and eight among Asians. The
Rotterdam diagnostic criteria were used in 12 studies
and the NIH criteria in two. In 8 of 14 studies, DNA
was extracted from peripheral blood and analyzed with a
classic polymerase chain reaction–restriction fragment
length polymorphism (PCR–RFLP) assay. The NOS results showed that the median overall score was 6 (range,
4–8). Thirteen studies were considered high quality and
one as low quality. In addition, four studies reported a
deviation of the genotype distributions among the controls from the HWE [17,21,23,25].
statistically via the Begg’s test and Egger’s test. The presence of publication bias was indicated by a p-value < 0.05
[32,33]. Data management and analysis were performed
using STATA statistical software (version 12.0; Stata
Corporation, College Station, TX, USA).
Results
Characteristics of included studies
Identification
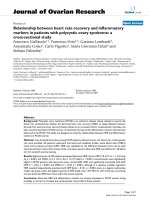
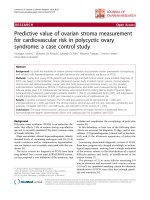
The literature search identified a total of 326 potentially
relevant papers. There were 272 potentially relevant papers after duplicates were removed. After review of the
titles and abstracts of all articles, 242 were excluded; full
texts were also reviewed and 16 articles were further excluded. Finally, a total of 14 eligible articles with a total
of 1665 PCOS patients and 1687 healthy subjects met
the inclusion criteria and were included in this metaanalysis [7,14-26], with one study that included both
TNF-alpha (−308 G/A) and IL-6 (−174 G/C) polymorphisms [22]. The flow chart in Figure 1 is a summary of
the literature review process. Study characteristics are
Records identified through
database searching
(n = 325)
Meta-analysis results
A total of 802 cases and 802 controls were assessed to
identify associations between the TNF-alpha (−308 G/A)
polymorphism and PCOS. The A allele was considered
as the risk variant. However, we found no association between the TNF-alpha (−308 G/A) polymorphism and
PCOS risk in the overall population (A vs. G: OR = 0.93,
Additional articles identified
through a manual searching
(n = 1)
Screening
Records after duplicates removed
(n = 272)
Records screened
(n = 272)
242 were excluded:
Irrelevant to research topics (n = 221);
Not human studies (n = 5);
Case reports, letters, reviews, metaanalysis (n = 16).
Eligibility
Full-text articles assessed
for eligibility
(n = 30 )
16 were excluded:
Included
Studies included in
qualitative synthesis
(n = 14)
Studies without sufficient data (n = 3);
Overlapped studies (n = 1);
Irrelevant to TNF-alpha (−308 G/A), IL-6
(−174 G/C) and IL-1beta (−511 C/T)
polymorphisms (n = 12).
TNF-alpha (−308 G/A)
(n = 7)
Figure 1 Flow diagram of the study selection process.
IL-6 (−174 G/C)
(n = 4)
IL-1beta (−511 C/T)
(n = 4)
Study name
Year
Country
Ethnicity
Age, years, mean ± SD
Sample size
Cases
Cases
Controls
Controls
PCOS diagnostic
criteria
Genotyping
method
NOS
score
Genotype (case/control)
11
12
PHWE b
22
Guo et al. BMC Genetics (2015) 16:5
Table 1 Characteristic of the studies included in this meta-analysis
TNF-alpha (−308 G/A)
Milner et al. [14]
1999
Australia
Caucasian
NA
NA
84
108
NIH criteria
PCR-SSCP
4
59/63
23/42
2/3
0.194
Mao et al. [15]
2000
China
Asian
28.0 ± 0.5
31.1 ± 1.1
118
54
NIH criteria
PCR-RFLP
6
88/37
29/13
1/4
0.089
Vural et al. [22]
2010
Turkey
Caucasian
25 (17–39)a
27 (18–39)a
97
95
Rotterdam criteria
PCR-RFLP
8
78/77
16/15
3/3
0.055
Zhang et al. [16]
2010
China
Asian
29.0 ± 1.5
30.0 ± 1.5
78
40
Rotterdam criteria
Microarray
7
72/36
6/4
0/0
0.739
Deepika et al. [17]
2013
India
Asian
NA
NA
283
306
Rotterdam criteria
ARMS PCR
6
10/10
270/293
3/3
<0.05
Wen et al. [18]
2013
China
Asian
26.86 ± 4.5
27.3 ± 3.71
103
59
Rotterdam criteria
PCR-RFLP
8
89/52
14/7
0/0
0.628
Grech et al. [19]
2014
Greece
Caucasian
22.5 ± 3.2
NA
39
140
Rotterdam criteria
PCR-RFLP
5
33/125
6/14
0/1
0.394
Walch et al. [20]
2004
Austria
Caucasian
28 (20–39)a
NA
62
94
Rotterdam criteria
Pyrosequencing
6
24/43
30/35
8/16
0.068
Erdogan et al. [21]
2009
Turkey
Caucasian
24.07 ± 1.32
25.01 ± 2.05
88
119
Rotterdam criteria
PCR-RFLP
8
57/32
26/75
5/12
<0.05
a
a
IL-6 (−174 G/C)
Vural et al. [22]
2010
Turkey
Caucasian
25 (17–39)
27 (18–39)
97
95
Rotterdam criteria
PCR-RFLP
8
59/46
34/42
4/7
0.536
Tumu et al. [23]
2013
India
Asian
26.35 ± 3.88
30.00 ± 5.17
104
156
Rotterdam criteria
Pyrosequencing
6
69/77
31/73
4/6
<0.05
Kolbus et al. [24]
2007
Austria
Caucasian
27.9 ± 5.0
28.8 ± 5.9
105
102
Rotterdam criteria
Pyrosequencing
7
43/40
47/48
15/14
0.947
Yang et al. [25]
2009
China
Asian
NA
NA
118
86
Rotterdam criteria
PCR-RFLP
5
30/34
56/26
32/26
<0.05
Mu et al. [26]
2010
China
Asian
26.91 ± 4.02
31.14 ± 4.22
200
177
Rotterdam criteria
PCR-RFLP
6
64/26
76/87
60/64
0.684
Xia et al. [7]
2013
China
Asian
29.75 ± 3.62
28.93 ± 3.91
59
56
Rotterdam criteria
PCR-RFLP
6
13/18
21/31
25/7
0.257
IL-1beta (−511 C/T)
For TNF-alpha (−308 G/A), 11 = GG, 12 = GA, 22 = AA; For IL-6 (−174 G/C), 11 = GG, 12 = GC, 22 = CC; For IL-1beta (−511 C/T), 11 = CC, 12 = CT, 22 = TT.
NA, not available; HWE, Hardy–Weinberg equilibrium; PCR-RFLP, polymerase chain reaction–restriction fragment length polymorphism; SSCP, single-strand conformational polymorphism; ARMS, amplification refractory
mutation system; NOS, Newcastle-Ottawa Scale; avalues are given as median (range); bp value for HWE in controls.
Page 4 of 13
Guo et al. BMC Genetics (2015) 16:5
Page 5 of 13
Table 2 Meta-analysis of TNF-alpha (−308 G/A) polymorphism and PCOS risk
AA vs. GGa
GA vs. GG
AA vs. GA + GGa
Comparison
No. of
studies
A vs. G
AA + GA vs. GG
OR (95% CI)
PH
OR (95% CI)
PH
OR (95% CI)
PH
OR (95% CI)
PH
OR (95% CI)
PH
Overall
7
0.93 (0.77-1.11)F
0.610
0.61 (0.26-1.41)F
0.519
0.89 (0.65-1.23)F
0.725
0.85 (0.63-1.16)F
0.741
0.66 (0.29-1.49)F
0.495
HWE in controls/
sample size ≤ 200
6
0.82 (0.61-1.10)F
0.634
0.53 (0.20-1.39)F
0.397
0.89 (0.63-1.25)F
0.603
0.84 (0.61-1.17)F
0.625
0.55 (0.21-1.44)F
0.389
PCR-RFLP
4
0.91 (0.63-1.32)F
0.469
0.47 (0.15-1.47)F
0.236
1.11 (0.72-1.71)F
0.864
1.00 (0.67-1.52)F
0.699
0.47 (0.15-1.46)F
0.245
4
0.95 (0.77-1.16)F
0.523
0.37 (0.10-1.36)F
0.124
0.96 (0.60-1.52)F
0.960
0.87 (0.55-1.37)F
0.893
0.39 (0.04-3.72)R
0.096
3
0.86 (0.59-1.24)
F
0.354
0.89 (0.29-2.78)
F
0.944
0.84 (0.54-1.30)
F
0.201
0.84 (0.55-1.28)
F
0.234
0.95 (0.31-2.95)F
0.984
NIH criteria
2
0.65 (0.44-1.02)F
0.869
0.31 (0.08-1.19)F
0.192
0.71 (0.44-1.13)F
0.345
0.65 (0.41-1.03)F
0.638
0.35 (0.09-1.30)F
0.154
Rotterdam criteria
5
1.01 (0.83-1.24)F
0.955
1.02 (0.33-3.19)F
0.991
1.08 (0.70-1.66)F
0.903
1.06 (0.70-1.62)F
0.930
1.05 (0.36-3.07)F
0.993
Ethnicity
Asian
Caucasian
PCOS diagnostic
criteria
OR, odds ratio; CI, confidence interval; No., number; vs.: versus; PH, p value of Q-test for heterogeneity test; random-effect model; fixed-effect model.
a
the studies by Zhang et al. and Wen et al. were not included since they presented 0 frequency of AA genotype in cases and controls.
R
95% CI = 0.77–1.11; AA vs. GG: OR = 0.61, 95% CI =
0.26–1.41; GA vs. GG: OR = 0.89, 95% CI = 0.65–1.23;
AA + GA vs. GG: OR = 0.85, 95% CI = 0.63–1.16; AA vs.
GA + GG: OR = 0.66, 95% CI = 0.29–1.49). After performing stratified analysis for HWE in controls, sample
size ≤ 200, PCR-RFLP, PCOS diagnosis criteria, and ethnicity separately, the association remained non-significant
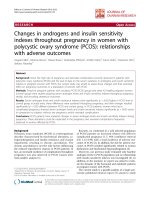
(Table 2, Figure 2). In addition, data on genotype distributions of the TNF-alpha (−308 G/A) polymorphism in
PCOS patients with a body mass index (BMI) ≥ 25 kg/m2
and BMI < 25 kg/m2 were available in three studies
[15-17]. The results showed no significant association of
the TNF-alpha (−308 G/A) polymorphism with obesity in
F
patients with PCOS (BMI ≥ 25 kg/m2 vs. BMI < 25 kg/m2)
(AA + GA vs. GG: OR = 0.94, 95% CI = 0.49–1.79; Figure 3).
Four studies (351 cases and 464 controls) investigated
the association of the IL-6 (−174 G/C) polymorphism
with PCOS risk and were included in the analysis. Overall, no obvious associations were found by heterozygote
comparison (GC vs. GG: OR = 0.54, 95% CI = 0.25–1.17)
or in the dominant model (CC + GC vs. GG: OR = 0.53,
95% CI = 0.26–1.08) and recessive models (CC vs. GC +
GG: OR = 0.67, 95% CI = 0.39–1.16) (Table 3, Figure 4).
However, the results indicated that the IL-6 (−174 G/C)
polymorphism was marginally associated with PCOS in
the allelic model (C vs. G: OR = 0.63, 95% CI = 0.41–
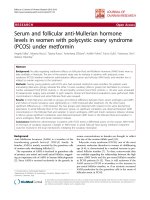
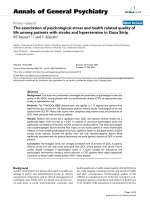
Figure 2 Meta-analysis for the association between the TNF-alpha (−308 G/A) polymorphism and risk of polycystic ovary syndrome
based on the dominant model (AA + GA vs. GG; stratified by ethnicity).
Guo et al. BMC Genetics (2015) 16:5
Page 6 of 13
Figure 3 A forest plot for the correlation of the TNF-alpha (−308 G/A) polymorphism with obesity in patients with polycystic ovary
syndrome (BMI ≥ 25 kg/m2 vs. BMI < 25 kg/m2) based on the dominant model (AA + GA vs. GG; stratified by country).
0.96) and by homozygote comparison (CC vs. GG: OR =
0.52, 95% CI = 0.30–0.93). In further subgroup analysis
based on study sample size, the IL-6 (−174 G/C) polymorphism was significantly associated with a decreased
PCOS risk among sample size > 200 in the allelic model
(C vs. G: OR = 0.47, 95% CI = 0.28–0.80) and dominant
model (CC + GC vs. GG: OR = 0.32, 95% CI = 0.13–0.78),
as well as by homozygote comparison (CC vs. GG: OR =
0.38, 95% CI = 0.17–0.89) and heterozygote comparison
(GC vs. GG: OR = 0.31, 95% CI = 0.13–0.74). Stratification
by the genotyping method indicated that the examined
SNP was associated with a decreased risk of PCOS among
genotyping method of PCR-RFLP in the allelic model (C
vs. G: OR = 0.49, 95% CI = 0.27–0.88) and by homozygote
comparison (CC vs. GG: OR = 0.31, 95% CI = 0.13–0.72).
Even so, the effect size was not significant among HWE in
controls (sample size ≤ 200) and genotyping method of pyrosequencing under all genetic models.
Under all genetic models, no obvious associations were
found between the IL-1beta (−511 C/T) polymorphism
and PCOS risk when all studies were pooled into the
meta-analysis (T vs. C: OR = 1.11, 95% CI = 0.67–1.84;
TT vs. CC: OR = 0.89, 95% CI = 0.62–1.27; TC vs. CC:
OR = 0.91, 95% CI = 0.40–2.11; TT + CT vs. CC: OR =
1.0, 95% CI = 0.45–2.19; TT vs. CT + CC: OR = 1.26, 95%
CI = 0.62–2.53). In the subgroup analysis by ethnicity,
HWE in controls, genotyping method, and study sample
size, still no obvious associations were found (Table 4,
Figure 5). Additionally, two studies [24,26] provided data
between the IL-1beta (−511 C/T) polymorphism and several clinical and biochemical parameters in patients with
PCOS. The results showed no significant association of
Table 3 Meta-analysis of IL-6 (−174 G/C) polymorphism and PCOS risk
Comparison
No. of
studies
C vs. G
OR (95% CI)
PH
OR (95% CI)
PH
OR (95% CI)
PH
OR (95% CI)
PH
OR (95% CI)
PH
Overall
4
0.63 (0.41-0.96)R
0.013
0.52 (0.30-0.93)F
0.329
0.54 (0.25-1.17)R
<0.01
0.53 (0.26-1.08)R
<0.01
0.67 (0.39-1.16)F
0.881
HWE in controls/
sample size ≤ 200
2
0.84 (0.60-1.16)F
0.157
0.69 (0.32-1.50)F
0.398
0.97 (0.40-2.31)R
0.057
0.88 (0.41-1.92)R
0.074
0.65 (0.31-1.37)F
0.716
Sample size > 200a
2
0.47 (0.28-0.80)R
0.091
0.38 (0.17-0.89)F
0.189
0.31 (0.13-0.74)R
0.033
0.32 (0.13-0.78)R
0.074
0.69 (0.30-1.59)F
0.469
3
0.63 (0.34-1.17)
R
<0.01
0.48 (0.26-0.91)
F
0.211
0.57 (0.18-1.78)
R
<0.01
0.54 (0.19-1.55)
R
<0.01
0.61 (0.33-1.13)F
0.897
2
0.49 (0.27-0.88)R
0.065
0.31 (0.13-0.72)F
0.461
0.35 (0.11-1.11)R
<0.01
0.35 (0.12-1.03)R
<0.01
0.54 (0.24-1.23)F
0.994
2
R
0.092
F
0.824
R
<0.01
R
0.019
0.81 (0.38-1.70)F
0.687
Caucasian
CC vs. GG
GC vs. GG
CC + GC vs. GG
CC vs. GC + GG
Genotyping
method
PCR-RFLP
Pyrosequencing
0.80 (0.47-1.37)
0.84 (0.38-1.84)
0.83 (0.26-2.64)
0.80 (0.30-2.10)
OR, odds ratio; CI, confidence interval; No., number; vs.: versus; PH, p value of Q-test for heterogeneity test; random-effect model; fixed-effect model; deviated
from HWE in controls.
R
F
a
Guo et al. BMC Genetics (2015) 16:5
Page 7 of 13
Figure 4 Meta-analysis for the association between the IL-6 (−174 G/C) polymorphism and the risk of polycystic ovary syndrome based
on the dominant model (CC + GC vs. GG; stratified by ethnicity).
the IL-1beta (−511 C/T) polymorphism (TT + CT vs. CC)
with menarche age (SMD = −0.01, 95% CI = −0.25–0.22),
BMI (SMD = 0.04, 95% CI = −0.20–0.27), and levels of
luteinizing hormone (LH) (SMD = −0.00, 95% CI = −0.24–
0.23), follicle-stimulating hormone (FSH) (SMD = −0.08,
95% CI = −0.32–0.16), total testosterone (SMD = 0.23,
95% CI = −0.01–0.47) and LH/FSH (SMD = 0.05, 95%
CI = −0.19–0.28) in patients with PCOS (Figure 6).
Heterogeneity test and sensitivity analysis
Regarding the TNF-alpha (−308 G/A) polymorphism and
PCOS, there was no heterogeneity among studies in overall comparisons (p > 0.10). For the IL-6 (−174 G/C) and
IL-1beta (−511 C/T) polymorphisms and PCOS, there was
statistical significance with between-study heterogeneity (p < 0.10). To explore sources of heterogeneity across
studies, subgroup analyses by ethnicity, HWE in controls, genotyping method, and study sample size were
conducted. However, none of these variables could explain
the heterogeneity. To evaluate the stability of the results
of the meta-analysis, sensitivity analyses of the omitted
individual studies were performed sequentially. This procedure confirmed that our results were reliable and robust
(Figure 7).
Publication bias
Publication bias was assessed by both the Begg’s test and
Egger’s test. The statistical results did not show any evidence of publication bias (p > 0.05), with the exception
of the IL-1beta (−511 C/T) polymorphism under the allelic model with the Egger's test (p = 0.023, Table 5). Sensitivity analysis using the trim and fill method was then
performed to assess the possibility of publication bias.
However, no trimming was performed and the data were
unchanged throughout the filled meta-analysis, which suggested the absence of publication bias for the IL-1beta
(−511 C/T) polymorphism under the allelic model.
Discussion
It is well known that PCOS is a proinflammatory state and
chronic low-grade inflammation was found to promote
the development of metabolic disruption and ovarian
Table 4 Meta-analysis of IL-1beta (−511 C/T) polymorphism and PCOS risk
Comparison
Overall
No. of T vs. C
studies
OR (95% CI)
4
TT vs. CC
PH
R
1.11 (0.67-1.84)
TC vs. CC
PH
OR (95% CI)
R
<0.01 0.89 (0.62-1.27)
TT + CT vs. CC
PH
OR (95% CI)
R
<0.01 0.91 (0.40-2.11)
TT vs. CT + CC
PH
OR (95% CI)
R
<0.01 1.00 (0.45-2.19)
PH
OR (95% CI)
R
<0.01 1.26 (0.62-2.53)
<0.01
HWE in controls 3
1.08 (0.54-2.14)R <0.01 1.16 (0.29-4.61)R <0.01 0.65 (0.33-1.28)R 0.041 0.79 (0.34-1.86)R <0.01 1.50 (0.53-4.25)R <0.01
Asian/PCR-RFLP 3
1.17 (0.57-2.42)R <0.01 1.29 (0.33-5.09)R <0.01 0.92 (0.27-3.18)R <0.01 1.03 (0.32-3.30)R <0.01 1.37 (0.53-3.54)R <0.01
Sample
size > 200
0.90 (0.58-1.37)R 0.014 0.70 (0.47-1.03)R 0.014 0.91 (0.31-2.67)R <0.01 0.86 (0.33-2.21)R <0.01 0.83 (0.60-1.14)F 0.769
3
OR, odds ratio; CI, confidence interval; No., number; vs.: versus; PH, p value of Q-test for heterogeneity test; Rrandom-effect model; Ffixed-effect model.
Guo et al. BMC Genetics (2015) 16:5
Page 8 of 13
Figure 5 Meta-analysis for the association between the IL-1beta (−511 C/T) polymorphism and the risk of polycystic ovary syndrome
based on the dominant model (TT + CT vs. CC; stratified by ethnicity).
Figure 6 A forest plot for the correlation of the IL-1beta (−511 C/T) polymorphism (TT + CT vs. CC) with several clinical and biochemical
parameters in patients with polycystic ovary syndrome.
Guo et al. BMC Genetics (2015) 16:5
Page 9 of 13
Figure 7 Sensitivity analysis of the summary odds ratio (OR) coefficients on the associations among the TNF-alpha (−308 G/A), IL-6
(−174 G/C) and IL-1beta (−511 C/T) polymorphisms with the risk of polycystic ovary syndrome based on the dominant model. (A), TNF-alpha
(−308 G/A); (B), IL-6 (−174 G/C); (C), IL-1beta (−511 C/T).
Guo et al. BMC Genetics (2015) 16:5
Page 10 of 13
Table 5 Statistical analyses of publication bias for TNF-alpha, IL-6 and IL-1beta gene polymorphisms
Category
Allele model
Homozygote comparison
Heterozygote comparison
Dominant model
Recessive model
Begg’s test
1.00
0.462
0.368
0.133
0.221
Egger’s test
0.704
0.732
0.190
0.180
0.616
Begg’s test
0.308
1.00
0.734
0.734
0.734
Egger’s test
0.496
0.729
0.583
0.665
0.906
Begg’s test
0.308
0.308
0.734
0.308
0.089
Egger’s test
0.023
0.089
0.532
0.346
0.178
TNF-alpha (−308 G/A)
IL-6 (−174 G/C)
IL-1beta (−511 C/T)
dysfunction in PCOS [34]. Moreover, variants in genes
encoding several proinflammatory cytokines and their receptors associated with obesity, insulin resistance, and diabetes have also been found to be associated with PCOS
[17,35]. As common multifunctional cytokines, TNF-alpha,
IL-6, and IL-1 have been proposed to influence the processes of ovulation, fertilization, and implantation, which
are also affected in women with PCOS [36]. However, no
significant difference was found by meta-analysis of serum
TNF-alpha and IL-6 concentrations in women with PCOS
and controls, although only nine studies of TNF-alpha and
10 studies of IL-6 were included [37]. The occurrence of
polymorphisms in the TNF-alpha, IL-6, and IL-1 genes in
women affected by PCOS has also been investigated over
the past few decades [22,24]. However, due to the relative
small sample size, no clear consensus has been reached.
The aim of the present study was to perform a metaanalysis of the best evidence available in an attempt to provide high-quality data on the linkage between TNF-alpha
(−308 G/A), IL-6 (−174 G/C), and IL-1beta (−511 C/T)
polymorphisms and PCOS risk.
To the best of our knowledge, this is the first meta-analysis
concerning TNF-alpha (−308 G/A), IL-6 (−174 G/C), and
IL-1beta (−511 C/T) polymorphisms and PCOS risk.
Based on our results, no significant association was found
between TNF-alpha (−308 G/A) and IL-1beta (−511 C/T)
polymorphisms and PCOS risk in the overall population
or subgroup analysis under all genetic models. For the
IL-6 (−174 G/C) polymorphism, however, variant C allele
was associated with a lower risk of PCOS in the allelic
model (C vs. G: OR = 0.63, 95% CI = 0.41–0.96) and by
homozygote comparison (CC vs. GG: OR = 0.52, 95%
CI = 0.30–0.93), even though the p-value (0.032 and
0.042, respectively) was marginal. Our results indicate that
the IL-6 (−174 G/C) polymorphism likely conveys a protective effect against PCOS. A possible explanation for this
finding is that the IL-6 C allele results in low IL-6 production, which may normalize ovarian function. However, the
results of this meta-analysis should be cautiously interpreted. First, in the subgroup analysis, no association was
found between the IL-6 (−174 G/C) polymorphism and
PCOS risk by the genotyping method of pyrosequencing
in any genetic model. Although the IL-6 (−174 G/C) polymorphism was associated with PCOS in Caucasian populations and in the subgroup analysis of PCR-RFLP genotyping
method, one study [21] showed deviations in genotype frequency from the HWE of controls. Second, after excluding two studies with deviations from the HWE in controls
[21,23], which had a sample size of > 200, the result
showed that the IL-6 (−174 G/C) polymorphism was no
longer associated with PCOS. Although the relatively limited study number (only two studies for IL-6 (−174 G/C)
polymorphism in the subgroup analysis specific to HWE
in controls and genotyping method of pyrosequencing)
and small sample size might have resulted in the null results, we could not rule out the possibility that the IL-6
(−174 G/C) polymorphism was actually not associated
with PCOS risk. Our overall positive results might be
dominated by the studies showing deviation from the
HWE in controls. No heterogeneity was observed for the
TNF-alpha (−308 G/A) polymorphism. For the IL-6
(−174 G/C) and IL-1beta (−511 C/T) polymorphisms,
however, there was significant heterogeneity in the overall
population and in the subgroup of HWE in controls, ethnicity, genotyping method, and sample size that might
have influenced the results. Sensitivity analysis was then
conducted, which confirmed the stability and reliability of
our results.
The pooled results also demonstrated that there was
no obvious association of the TNF-alpha (−308 G/A)
polymorphism with obesity, or between the IL-1beta
(−511 C/T) polymorphism with several clinical and biochemical parameters, in patients with PCOS. However,
It should be noted that not all studies evaluated the effect of interactions, with two studies [17,26] providing
complete data on different genetic models and three
[15,16,24] just presenting data on the dominant model.
Furthermore, other clinical and laboratory characteristics
(including metabolic parameters and androgen parameters)
according to the genotypes of TNF-alpha (−308 G/A), IL-6
Guo et al. BMC Genetics (2015) 16:5
(−174 G/C), and IL-1beta (−511 C/T) polymorphisms
in the PCOS patients and the control group could not
evaluated due to a lack of sufficient data. Therefore, our
results, which only presented data on the dominant model
of the TNF-alpha (−308 G/A) and IL-1beta (−511 C/T)
polymorphisms, should be interpreted with caution. Insulin resistance and hyperinsulinemia are the central features of the metabolic disturbances typical for PCOS [37].
The TNF-alpha (−308 G/A) polymorphism was reported
to be associated with altered responses to oral glucose
tolerance testing in the PCOS group [14]. TNF-alpha is
over-expressed in the adipose tissue of obese subjects
in proportion to the degree of insulin resistance [38]. The
IL-6 polymorphism investigated in this study was shown to
be associated with lipid abnormalities and impaired insulin
sensitivity [39,40]. IL-1beta was proposed as a promoter of
nitrogen (NO) generation and apoptosis of pancreatic islet
B cell, which also induced insulin resistance [26]. However,
a study by Puder et al. showed that an increase in both
low-grade chronic inflammation and insulin resistance in
PCOS patients is associated with increased central fat excess rather than PCOS status [41]. It remains to be established whether the proinflammatory state in PCOS is
primarily a result of genetic variation or simply inflamed
adipose tissue, because there is an increased prevalence of
abdominal adiposity in PCOS across all weight classes. In
fact, no differences were reported in levels of TNF-alpha,
IL-6, and markers of inflammation between obese women
with PCOS and obese controls [42]. A study by Mohlig
et al. also showed that plasma levels of IL-6 and C-reactive
protein were not increased in women with PCOS when
compared to controls matched by age and BMI [43]. Previous studies have proposed that polymorphisms to the
TNF-alpha (−308 G/A) and IL-1beta (−511 C/T) genes
might be the genetic basis for the increase in TNF-alpha
and IL-1beta serum levels in patients with PCOS [7,24].
Regarding the IL-6 (−174 G/C) polymorphism, however,
several investigations have reported that the homozygous
CC genotype was associated with higher serum IL-6 levels,
which is in contrast to studies indicating that the G
allele is associated with increased IL-6 secretion in subjects with PCOS, metabolic syndrome, and insulin resistance [12,22,39,44]. It appears that transcriptional control
of IL-6 is multifaceted and may be dependent on the impact of other sites of polymorphisms which may be in
linkage disequilibrium with the IL-6 gene locus [45]. Furthermore, it has been suggested that obesity-associated
genes, environmental factors, and gene–environment interactions, as well as dietary habits are also responsible for
the increasing prevalence of PCOS worldwide [17,46,47].
Several limitations to this study need to be taken into
account when interpreting our results. First, the number
of study and the sample sizes were relatively small for
analysis of each gene polymorphism thereby having
Page 11 of 13
insufficient power to detect any true difference between
cases and controls. Second, heterogeneity was detected in
the IL-1beta (−511 C/T) polymorphisms and the source of
heterogeneity could not be identified due to the limited
number of studies included in each pooled outcome.
Third, the results of our meta-analysis were not adjusted
for confounding factors, such as age and BMI, due to the
lack of sufficient data, which might have influenced the effect estimates. Finally, the etiology of PCOS has long been
described as multifactorial; however, it was difficult for us
to analyze interactions between genes, lifestyles, and certain environmental factors.
Conclusions
In summary, the results of this meta-analysis suggested
that variations of the TNF-alpha (−308 G/A), IL-6
(−174 G/C), and IL-1beta (−511 C/T) genes might not
represent genetic risk factors for PCOS. However, there is
a need for further larger-scale studies, including other loci
of the TNF-alpha, IL-6, and IL-1beta genes, to confirm
our results and elucidate the potential association and influence of cytokine gene polymorphisms, and gene–environment interactions on the development of PCOS.
Additional file
Additional file 1: Prisma checklist.
Abbreviations
BMI: Body mass index; CI: Confidence interval; HWE: Hardy–Weinberg
equilibrium; IL: Interleukin; OR: Odds ratio; p: Probability; PCOS: Polycystic
ovary syndrome; PRISMA: The preferred reporting items for systematic
reviews and meta-analysis; SNP: Single nucleotide polymorphism;
TNF-alpha: Tumor necrosis factor alpha; vs.: Versus.
Competing interests
The authors declare that they have no competing interests.
Authors’ contributions
RYG and NNZ conceived and designed the experiments. YZ and NNZ
extracted the data and conducted the experiment. YZ and ZZY assessed the
quality of studies and analyzed the data. RYG and YZ wrote the manuscript.
All authors read and approved the final manuscript.
Acknowledgements
This work was financially supported by grants from the Zhejiang Medical
Health Fund of China (grant No.: 2012RCA020) and the National
High-technology R&D Program of China (grant No.: 2013CB531406).
Author details
1
Department of Laboratory Medicine, First Affiliated Hospital, College of
Medicine, Zhejiang University, Hangzhou, Zhejiang 310003, China.
2
Department of Gynecology and Obstetrics, Tongde Hospital of Zhejiang
Province, Hangzhou, Zhejiang 310012, China. 3State Key Laboratory for
Diagnosis and Treatment of Infectious Disease, First Affiliated Hospital,
College of Medicine, Zhejiang University, Hangzhou 310003, China.
Received: 12 October 2014 Accepted: 16 January 2015
Guo et al. BMC Genetics (2015) 16:5
References
1. Azziz R, Woods KS, Reyna R, Key TJ, Knochenhauer ES, Yildiz BO. The
prevalence and features of the polycystic ovary syndrome in an unselected
population. J Clin Endocrinol Metab. 2004;89:2745–9.
2. Goodarzi MO, Dumesic DA, Chazenbalk G, Azziz R. Polycystic ovary
syndrome: etiology, pathogenesis and diagnosis. Nat Rev Endocrinol.
2011;7:219–31.
3. Diamanti-Kandarakis E, Piperi C, Spina J, Argyrakopoulou G, Papanastasiou L,
Bergiele A, et al. Polycystic ovary syndrome: the influence of environmental
and genetic factors. Hormones (Athens). 2006;5:17–34.
4. Deligeoroglou E, Vrachnis N, Athanasopoulos N, Iliodromiti Z, Sifakis S,
Iliodromiti S, et al. Mediators of chronic inflammation in polycystic ovarian
syndrome. Gynecol Endocrinol. 2012;28:974–8.
5. Escobar-Morreale HF, Calvo RM, Sancho J, San Millan JL. TNF-alpha and
hyperandrogenism: a clinical, biochemical, and molecular genetic study.
J Clin Endocrinol Metab. 2001;86:3761–7.
6. Vgontzas AN, Trakada G, Bixler EO, Lin HM, Pejovic S, Zoumakis E, et al.
Plasma interleukin 6 levels are elevated in polycystic ovary syndrome
independently of obesity or sleep apnea. Metabolism. 2006;55:1076–82.
7. Xia YH, Yao L, Zhang ZX. Correlation between IL-1β, IL-1Ra gene polymorphism
and occurrence of polycystic ovary syndrome infertility. Asian Pac J Trop Med.
2013;6:232–6.
8. Brannstrom M, Friden BE, Jasper M, Norman RJ. Variations in peripheral
blood levels of immunoreactive tumor necrosis factor alpha (TNFalpha)
throughout the menstrual cycle and secretion of TNFalpha from the human
corpus luteum. Eur J Obstet Gynecol Reprod Biol. 1999;83:213–7.
9. Deshpande RR, Chang MY, Chapman JC, Michael SD. Alteration of cytokine
production in follicular cystic ovaries induced in mice by neonatal estradiol
injection. Am J Reprod Immunol. 2000;44:80–8.
10. Sukhikh GT, Vanko LV. Interrelationships between Immune and
Reproductive Systems in Human. Russ J Immunol. 1999;4:312–4.
11. Baghel K, Srivastava RN, Chandra A, Goel SK, Agrawal J, Kazmi HR, et al.
TNF-alpha, IL-6, and IL-8 cytokines and their association with TNF-alpha-308
G/A polymorphism and postoperative sepsis. J Gastrointest Surg.
2014;18:1486–94.
12. Fishman D, Faulds G, Jeffery R, Mohamed-Ali V, Yudkin JS, Humphries S,
et al. The effect of novel polymorphisms in the interleukin-6 (IL-6) gene on
IL-6 transcription and plasma IL-6 levels, and an association with systemic-onset
juvenile chronic arthritis. J Clin Invest. 1998;102:1369–76.
13. Dundar NO, Aktekin B, Ekinci NC, Sahinturk D, Yavuzer U, Yegin O, et al.
Interleukin-1beta secretion in hippocampal sclerosis patients with mesial
temporal lobe epilepsy. Neurol Int. 2013;5:e17.
14. Milner CR, Craig JE, Hussey ND, Norman RJ. No association between the
−308 polymorphism in the tumour necrosis factor alpha (TNFalpha)
promoter region and polycystic ovaries. Mol Hum Reprod. 1999;5:5–9.
15. Mao WW, Yu L, Chen YJ, Zhang XW, Li MZ. Study on the relationship
between a polymorphism of tumor necrosis factor-α gene and the
pathogenesis of polycystic ovary syndrome. Chin J Obstet Gynecol.
2000;2000:536–9.
16. Zhang J, Liu Q. Association study of genetic polymorphisms in LEP and
TNFα genes with the pathogenesis of polycystic ovary syndrome. Chin J
Heath Lab Technol. 2010;20:3272–4.
17. Deepika ML, Reddy KR, Yashwanth A, Rani VU, Latha KP, Jahan P. TNF-alpha
haplotype association with polycystic ovary syndrome - a South Indian
study. J Assist Reprod Genet. 2013;30:1493–503.
18. Wen Q, Wu J, Wu LY, Liu LJ, Yang HB, Sun ZX, et al. Association of TNF-α
G-308A and G-238A gene polymorphisms with PCOS in women. Chin J Clin.
2013;7:3394–9.
19. Grech I, Giatrakos S, Damoraki G, Kaldrimidis P, Rigopoulos D, GiamarellosBourboulis EJ. Impact of TNF haplotypes in the physical course of acne
vulgaris. Dermatology. 2014;228:152–7.
20. Walch K, Grimm C, Zeillinger R, Huber JC, Nagele F, Hefler LA. A common
interleukin-6 gene promoter polymorphism influences the clinical
characteristics of women with polycystic ovary syndrome. Fertil Steril.
2004;81:1638–41.
21. Erdogan M, Karadeniz M, Berdeli A, Tamsel S, Yilmaz C. The relationship of
the interleukin-6–174 G > C gene polymorphism with cardiovascular risk
factors in Turkish polycystic ovary syndrome patients. Int J Immunogenet.
2009;36:283–8.
22. Vural P, Degirmencioglu S, Saral NY, Akgul C. Tumor necrosis factor alpha
(−308), interleukin-6 (−174) and interleukin-10 (−1082) gene polymorphisms
Page 12 of 13
23.
24.
25.
26.
27.
28.
29.
30.
31.
32.
33.
34.
35.
36.
37.
38.
39.
40.
41.
42.
43.
44.
45.
in polycystic ovary syndrome. Eur J Obstet Gynecol Reprod Biol.
2010;150:61–5.
Tumu VR, Govatati S, Guruvaiah P, Deenadayal M, Shivaji S, Bhanoori M. An
interleukin-6 gene promoter polymorphism is associated with polycystic
ovary syndrome in South Indian women. J Assist Reprod Genet.
2013;30:1541–6.
Kolbus A, Walch K, Nagele F, Wenzl R, Unfried G, Huber JC. Interleukin-1
alpha but not interleukin-1 beta gene polymorphism is associated with
polycystic ovary syndrome. J Reprod Immunol. 2007;73:188–93.
Yang Y, Qiao J, Tang RX, Li MZ. Genotype and haplotype determination of
interleukin (IL) 1 beta (g. -511C > T and g. +3954C > T) and IL-1RN in
polycystic ovary syndrome. Fertil Steril. 2010;94:384–6.
Mu Y, Liu J, Wang B, Wen Q, Wang J, Yan J, et al. Interleukin 1 beta
(IL-1beta) promoter C [−511] T polymorphism but not C [+3953] T
polymorphism is associated with polycystic ovary syndrome. Endocrine.
2010;37:71–5.
Moher D, Liberati A, Tetzlaff J, Altman DG, Group P. Preferred reporting
items for systematic reviews and meta-analyses: the PRISMA statement.
PLoS Med. 2009;6:e1000097.
Yang B, Fan S, Zhi X, Li Y, Liu Y, Wang D, et al. Associations of MTHFR gene
polymorphisms with hypertension and hypertension in pregnancy:
a meta-analysis from 114 studies with 15411 cases and 21970 controls.
PLoS One. 2014;9:e87497.
Higgins JP, Thompson SG, Deeks JJ, Altman DG. Measuring inconsistency in
meta-analyses. BMJ. 2003;327:557–60.
DerSimonian R, Laird N. Meta-analysis in clinical trials. Control Clin Trials.
1986;7:177–88.
Mantel N, Haenszel W. Statistical aspects of the analysis of data from
retrospective studies of disease. J Natl Cancer Inst. 1959;22:719–48.
Begg CB, Mazumdar M. Operating characteristics of a rank correlation test
for publication bias. Biometrics. 1994;50:1088–101.
Egger M, Davey Smith G, Schneider M, Minder C. Bias in meta-analysis
detected by a simple, graphical test. BMJ. 1997;315:629–34.
Gonzalez F, Rote NS, Minium J, Kirwan JP. Increased activation of nuclear
factor kappaB triggers inflammation and insulin resistance in polycystic
ovary syndrome. J Clin Endocrinol Metab. 2006;91:1508–12.
Repaci A, Gambineri A, Pasquali R. The role of low-grade inflammation in
the polycystic ovary syndrome. Mol Cell Endocrinol. 2011;335:30–41.
Gonzalez F. Inflammation in Polycystic Ovary Syndrome: underpinning
of insulin resistance and ovarian dysfunction. Steroids. 2012;77:300–5.
Escobar-Morreale HF, Luque-Ramirez M, Gonzalez F. Circulating inflammatory
markers in polycystic ovary syndrome: a systematic review and meta-analysis.
Fertil Steril. 2011;95:1048–58.
Kubaszek A, Pihlajamaki J, Komarovski V, Lindi V, Lindstrom J, Eriksson J,
et al. Promoter polymorphisms of the TNF-alpha (G-308A) and IL-6 (C-174G)
genes predict the conversion from impaired glucose tolerance to
type 2 diabetes: the Finnish Diabetes Prevention Study. Diabetes.
2003;52:1872–6.
Fernandez-Real JM, Broch M, Vendrell J, Richart C, Ricart W. Interleukin-6
gene polymorphism and lipid abnormalities in healthy subjects. J Clin
Endocrinol Metab. 2000;85:1334–9.
Fernandez-Real JM, Broch M, Vendrell J, Gutierrez C, Casamitjana R, Pugeat
M, et al. Interleukin-6 gene polymorphism and insulin sensitivity. Diabetes.
2000;49:517–20.
Puder JJ, Varga S, Kraenzlin M, De Geyter C, Keller U, Muller B. Central fat
excess in polycystic ovary syndrome: relation to low-grade inflammation
and insulin resistance. J Clin Endocrinol Metab. 2005;90:6014–21.
Sathyapalan T, Atkin SL. Mediators of inflammation in polycystic
ovary syndrome in relation to adiposity. Mediators Inflamm.
2010;2010:758656.
Mohlig M, Spranger J, Osterhoff M, Ristow M, Pfeiffer AF, Schill T, et al. The
polycystic ovary syndrome per se is not associated with increased chronic
inflammation. Eur J Endocrinol. 2004;150:525–32.
Jerrard-Dunne P, Sitzer M, Risley P, Steckel DA, Buehler A, von Kegler S,
et al. Interleukin-6 promoter polymorphism modulates the effects of
heavy alcohol consumption on early carotid artery atherosclerosis:
the Carotid Atherosclerosis Progression Study (CAPS). Stroke.
2003;34:402–7.
Terry CF, Loukaci V, Green FR. Cooperative influence of genetic
polymorphisms on interleukin 6 transcriptional regulation. J Biol Chem.
2000;275:18138–44.
Guo et al. BMC Genetics (2015) 16:5
Page 13 of 13
46. Carroll J, Saxena R, Welt CK. Environmental and genetic factors influence
age at menarche in women with polycystic ovary syndrome. J Pediatr
Endocrinol Metab. 2012;25:459–66.
47. Deligeoroglou E, Kouskouti C, Christopoulos P. The role of genes in the
polycystic ovary syndrome: predisposition and mechanisms. Gynecol
Endocrinol. 2009;25:603–9.
Submit your next manuscript to BioMed Central
and take full advantage of:
• Convenient online submission
• Thorough peer review
• No space constraints or color figure charges
• Immediate publication on acceptance
• Inclusion in PubMed, CAS, Scopus and Google Scholar
• Research which is freely available for redistribution
Submit your manuscript at
www.biomedcentral.com/submit