Distribution of miRNA genes in the pig genome
Bạn đang xem bản rút gọn của tài liệu. Xem và tải ngay bản đầy đủ của tài liệu tại đây (918.79 KB, 12 trang )
Paczynska et al. BMC Genetics (2015) 16:6
DOI 10.1186/s12863-015-0166-3
RESEARCH ARTICLE
Open Access
Distribution of miRNA genes in the pig genome
Paulina Paczynska, Adrian Grzemski and Maciej Szydlowski*
Abstract
Background: Recent completion of swine genome may simplify the production of swine as a large biomedical
model. Here we studied sequence and location of known swine miRNA genes, key regulators of protein-coding
genes at the level of RNA, and compared them to human and mouse data to prioritize future molecular studies.
Results: Distribution of miRNA genes in pig genome shows no particular relation to different genomic features
including protein coding genes - proportions of miRNA genes in intergenic regions, introns and exons roughly
agree with the size of these regions in the pig genome. Our analyses indicate that host genes harbouring intragenic
miRNAs are longer from other protein-coding genes, however, no important GO enrichment was found. Swine
mature miRNAs show high sequence similarity to their human and mouse orthologues. Location of miRNA genes
relative to protein-coding genes is also similar among studied species, however, there are differences in the precise
position in particular intergenic regions and within particular hosts. The most prominent difference between pig
and human miRNAs is a large group of pig-specific sequences (53% of swine miRNAs). We found no evidence that
this group of evolutionary new pig miRNAs is different from old miRNAs genes with respect to genomic location
except that they are less likely to be clustered.
Conclusions: There are differences in precise location of orthologues miRNA genes in particular intergenic regions
and within particular hosts, and their meaning for coexpression with protein-coding genes deserves experimental
studies. Functional studies of a large group of pig-specific sequences in future may reveal limits of the pig as a
model organism to study human gene expression.
Keywords: miRNA, Pig, Genomic location
Background
MicroRNAs (miRNAs) are short (~22 nt) RNA sequences which play important role in posttranscriptional
regulation of gene expression. Mature miRNA is part of
active protein complex RISC (RNA - induced silencing
complex) and inhibits translation of target transcript by
binding to its 3′ UTR. MiRNAs are different from other
classes of interfering RNA with its biogenesis, which was
intensively investigated in human and mouse [1]. They
are cut out from hairpin pre-miRNA (~70 nt) by enzyme
Dicer in cytoplasm. Pre-miRNA is excised in nucleus
from pri-miRNA - long transcript of miRNA gene - by
enzyme Drosha. An individual pri-miRNA sequence may
code multiple copies of pre-miRNA [2].
Human miRNA genes were found on all autosomes
and X chromosome. A few predicted miRNA genes may
be located on Y chromosome but they existence has not
* Correspondence:
Department of Genetics and Animal Breeding, Poznan University of Life
Sciences, Poland, Wolynska 33, 60-637 Poznan, Poland
been confirmed [3]. Known miRNA genes occur within
protein coding genes or within intergenic regions. Intragenic miRNAs are found within introns or exons. Location of miRNA genes in a genome can determine their
expression and function. For example, it is hypothesised
that an intragenic miRNA gene shares promoter sequence with its host gene [4]. MiRNA sequences exhibit
high level of similarity among mammals, although some
sequences in current nucleotide databases seem to be
species specific. Although conservatism of mature
miRNA sequences is well known, the conservatism in
the location of miRNA genes was not systematically
studied.
The pig (Sus scrofa) is one of the main sources of
meet in human diet and is considered as potential donor
of transplants. Due to its similarity to human in terms of
anatomy, physiology, metabolism, genome and diet, the
pig is important model organism [5]. Recent completion
of swine genome may simplify the production of swine
as a large biomedical model [6].
© 2015 Paczynska et al.; licensee BioMed Central. This is an Open Access article distributed under the terms of the Creative
Commons Attribution License ( which permits unrestricted use, distribution, and
reproduction in any medium, provided the original work is properly credited. The Creative Commons Public Domain
Dedication waiver ( applies to the data made available in this article,
unless otherwise stated.
Paczynska et al. BMC Genetics (2015) 16:6
Page 2 of 12
877 swine miRNA sequences in Ensembl (rel. 77) only
273 sequences were included in miRBase (rel. 21) [9].
Regulatory function of a miRNA depends on the sequence of miRNA gene itself and on regulation of
miRNA gene transcription. The regulation of a miRNA
gene may be linked to localization of the gene in genome, and particularly to its position relative to proteincoding genes and CpG landscapes. Considerable differences in the location of orthologues miRNA genes between species would suggest that two orthologues
miRNA, despite sharing high sequence similarity, may
play their regulatory roles differently. To understand the
limits of pig model and to direct future molecular studies in this paper we characterize location of swine
miRNA genes and compare it to human and mouse
data.
Intra- and intergenic miRNA genes
The numbers of intergenic, intronic and exonic miRNA
genes are presented in Table 1. In general, the proportions of different miRNAs are very similar in human and
mouse, and different in the pig. Only 33% of porcine
miRNA are intragenic vs 50% and 55% in human and
mouse. Other in silico studies on human, mouse and
chicken revealed that 41-47% of miRNAs overlap with
protein-coding genes [10]. This disparity between the
pig and other studied species may result from the lower
number of available porcine miRNA sequences rather
than being a particular feature of pig genome. However,
the question arises why the statistics are still so different
for the pig despite the fact that considerable number of
porcine miRNA genes are already available (N = 877).
First, it can be easily observed that the inclusion of different miRNA types in the database in period of time is
not in proportion to their actual occurrences, probably
being a result of particular alterations made in a pipeline
used to build newer releases. For example, Ensembl release 77 (October 2014) includes 306 more mouse intragenic sequences and only 53 more intergenic miRNA
when compared to release 70 (January 2013), whereas
the proportion of these types is estimated to be 1:1, approximately. Second, the pig miRNAs were identified
Results and discussion
The number of known pig miRNA genes is relatively
low when compared to human and mouse genomes (877
for pig vs. 4272 for human and 2009 for mouse, ver.
Ensembl release 77), probably due to incomplete swine
genome sequence and its annotation. The differences in
the genome annotations may reflect lower interests and
funding allocated so far for swine genome research. Recently, however, great progress has been made in comprehensive annotation of pig genome for noncoding
RNAs [7]. We expect that some miRNA showing agerelated activities (e.g. [8]) are not represented in pigs because older age groups are rarely sampled. Among the
Table 1 Number of miRNA and host genes (Ensembl, release 77)
Pig
Human
N
%
N
%
N
%
miRNA total
877
100.0
4272
100.0
2009
100.0
Intergenic
587
66.9
2132
49.9
900
44.8
290
33.1
50.1
100.0
1109
55.2
69.3
825
Intragenic
%
Mouse
%
%
100.0
2140
Host strand
186
64.1
1482
Intron
166
57.2
1282
59.5
710
64.0
Exon
20
6.9
200
9.3
115
10.4
Opposite strand
100.0
74.4
95
32.8
550
25.7
244
22.0
Intron
71
24.5
485
22.7
197
17.8
Exon
24
8.3
65
3
47
4.2
9
3.1
108
5
40
3.6
With multiple hosts
Hosts total
miRNA strand
272
100.0
173
63.6
With intronic miRNA
155
With exonic miRNA
18
Opposite strand
With intronic miRNA
82
With exonic miRNA
23
17
100.0
1201
63.6
89.6
1011
930
100.0
100.0
646
69.5
84.2
540
190
30.1
59
With multiple miRNAs
1887
100.0
100.0
449
72.0
385
237
83.6
106
23.8
64
6.3
100.0
100.0
216
85.7
175
23.2
81.0
41
12.6
68
100.0
7.3
Paczynska et al. BMC Genetics (2015) 16:6
only in a few experiments limited to several tissues and
age groups. In such case, some clusters of miRNAs having similar location and expression patterns can be
strongly overrepresented. In consequence, when a database is in early stage, like in case of swine miRNAs, such
comparisons between species must be treated with great
caution. Third, it is also possible that some intragenic
miRNA were misclassified as intergenic because of incomplete and imprecise annotation of protein-coding
genes based on the direct evidence from known transcripts. The number of known transcripts per protein
coding gene is only 1.2 in pig (average transcript length
31.3 kbp) compared to 6.9 in human (average 38.6 kbp).
We examined whether the number of intragenic
miRNA genes are proportional to the total relative size
of protein-coding genes in genome (% of total represented bp: pig 25%, human 39%, mouse 25%). The proportion of all intragenic miRNAs (including both host
oriented and opposite strand miRNAs: pig 33%, human
50%, mouse 55% of all miRNAs) was higher than percentage of genomic DNA occupied by all protein coding
genes. These numbers suggest that new miRNAs evolve
faster in introns or exons than within intergenic regions.
However, when we excluded all intragenic miRNAs
located on opposite strand, this tendency was not so obvious. In this case, the percentage of remaining hostoriented miRNAs among all miRNA genes (pig 21%,
human 35%, mouse 41%) was roughly what could be
expected given the relative size of protein-coding genes
in pig (21 vs 25%) and human (35 vs 39%), but it was
still high in mouse (41 vs 29%).
It is suggested that an intragenic host-oriented miRNA
may share host’s promoter, whereas miRNA on alternative strand is unlikely to utilize host’s regulatory mechanism [11]. Studies of mammals’ genomes showed
significant overrepresentation of miRNA genes in introns of protein coding genes and higher proportion of
intronic miRNA genes on the sense strand [12]. However, taking together these statistics we noticed that intragenic miRNAs that potentially utilize their hosts’
promoters do not emerge in genome more often than
miRNAs in intergenic regions. Therefore, the thesis that
intragenic region is a ‘sweet spot’ for the emergence of
novel miRNAs because the prior evolution of a new promoter unit is not required is not supported by our analysis of three mammal genomes. Moreover, if indeed the
lack of protein-coding promoters constitutes a limit for
new miRNAs to arise, the number of intergenic miRNAs
would be low. However, the number of intergenic miRNAs is close to that expected by chance. Roughly 10% of
intragenic miRNAs are located in exons. Again, this is
what can be expected by chance given that annotated
exons in database represent about 5% of protein-coding
genes in pig and 11% in human and mouse. The fact that
Page 3 of 12
exonic regions do not decrease the number of miRNAs
is intriguing because a miRNA sequence needs to be
self-complementary to form functional stem-and-loop
structure.
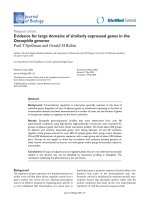
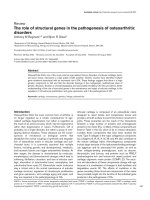
It was demonstrated that certain structured noncoding RNAs in the pig genome form clusters based on
genomic positions. With cutoff of 10,000 nt different
ncRNA genes form numerous clusters, mostly pairs [7].
Here, we observed that different types of porcine
miRNA genes show very similar tendency to occur in
clusters (Figure 1). This result is in contrast to human
genome, where intergenic miRNA genes show markedly
higher tendency to be clustered than intronic and exonic
miRNA genes. However, the cumulative distance distributions of intergenic miRNA genes are very similar in
these three species. Clustering of miRNA genes in human genome was characterized in detail by [13]. It was
found that ‘short-range’ clustering is strongly linked to
‘same-strand’ clustering, which in turn is more likely to
be linked to policistronic transcription. Our analysis
show that policistronic transcription may more likely
occur in intergenic miRNA genes than for intragenic
miRNA genes. On other hand, the increased probability
of policistronic transcription in intergenic regions may
be species-specific.
Host genes
The 290 known pig intragenic miRNA genes are localized in 272 protein-coding host genes (Table 1). The
hosts harbouring more than one miRNA sequence are
rare. We analysed all 182 porcine host genes that include
at least one host-oriented miRNA gene in intronic or exonic region. We observed that a random host gene is
usually much longer than a random protein coding gene
in a genome (2.6 - 4.3 fold longer) and contains more
exons (1.6 - 2 times more). Typically, exons occupy only
small portion of host gene: 1.9 - 5.6% of its length compared to 4.7 - 11% in random gene, therefore the difference between hosts and random genes are mainly due to
intronic regions. The increased number of exons, however, also translates to transcript size. The average length
of transcripts from a swine host gene was higher than
for a random gene: 75′839 nt (N = 401) in a host gene
and 31′216 nt in a random gene (N = 26′712), respectively. Similar results were obtained for human: the average length of transcripts from human host genes was
80′241 nt (N = 18′588) compared to 38′617 nt for random gene (N = 153′638).
The DAVID algorithm revealed that host genes in human genome (N = 1887) more often code for coiled-coil
protein structures than random genes (p-value = 1.7 × 10⁻⁸,
fold enrichment 1.5, 200 hosts involved). Among various
biological functions coiled-coil structures are involved in
gene regulation and form fibrous proteins, which are
Paczynska et al. BMC Genetics (2015) 16:6
Page 4 of 12
Figure 1 Cumulative distance distribution of miRNA genes in pig (A) and human (B). For each type of the described miRNA genes
(intergenic, intronic, exonic) the distances (in nucleotides) between every two same-chromosome same-strand successive miRNA genes were
obtained from Ensembl (ver. 77). Distance is drawn on a logarithmic scale.
expected to be longer. We observed that 259 hosts are
more often expressed in epithelium (p-value = 1.1 × 10⁻¹⁰,
fold enrichment 1.5). Therefore the enrichment for coiledcoil structure may be connected with increased length of
average host gene. Although the enrichment is significant
the two features constitute a minority within all host genes.
We also identified 90 transcription factors significantly
enriched in regulation of the set of human hosts. Next
we narrowed down our analysis of human hosts to
those that harbour miRNA in their exons on same
strand (N = 190 hosts). The DAVID indicated that this
set is enriched for RNA binding (p-value = 2.6 × 10⁻⁶,
fold enrichment 3.8, 18 hosts involved) and regulation
of transcription (p-value = 8.3 × 10⁻⁴, fold enrichment
1.8, 30 hosts involved). Other important gene-term enrichment included the coiled-coil and epithelium again.
There was no common feature shared by the majority
of this set of human hosts, except that 72 hosts were
described as phosphoproteins (p-value = 2.2 × 10⁻⁵, fold
enrichment 1.5). Eighteen transcription factors were
enriched.
The above enrichment analysis was performed for the
identified host genes in human genome with the tool designed for human genes. We found that location of intragenic miRNA is mostly conservative between pig and
human, and therefore, pig hosts often have their orthologues counterparts in the human genome. Consequently,
the enrichment analysis above should approximate the
situation in the pig. Nevertheless, with the increasing
importance of the pig as model organism, there is a need
for appropriate tools better suited for swine genome.
It must be noted, however, that we did not distinguish
between hosts that share their promoters with internal
miRNA and other hosts harbouring miRNAs that have
their own promoters. Such classification is not yet possible. In future it may be possible to distinguish between
these two types by the use of gene expression profiling.
For the current analysis we attempted to classify our
hosts based on phylogeny data on miRNAs. It was
shown that phylogenetically old intragenic miRNAs are
more coexpressed with their hosts than young ones [14].
This observation suggests that phylogenetically old miRNAs use their hosts’ promoters more often than phylogenetically young miRNAs. We identified 41 human
hosts harbouring conservative (old) miRNAs (information on evolutionary conservation status was downloaded from TargetScan, we considered only conservation
status of type II – highly conserved miRNAs). Again, this
group show enrichment for the coiled-coil structure
(p-value = 2.5 × 10⁻³, fold enrichment 2.8, 13 hosts involved) and also alternative splicing (p-value = 9.3 × 10⁻³,
fold enrichment 1.6, 24 hosts involved), which both may be
connected with gene length.
Assuming that an intragenic miRNA gene shares regulatory mechanism with its protein-coding host gene, we
further studied the distribution of CpG islands in the 5′
flanking regions of porcine hosts. High frequency of
CpG islands would indirectly suggest involvement of intragenic miRNA genes in the control of developmental
processes. However, we found no difference in the distribution of CpG islands within 5′ flanking region between
swine host and random gene. Twenty three percent of
host genes and 22% of all protein coding genes had at
least one predicted CpG island in 5′ flanking region and
the average number of CpG islands was 1.3. We calculated very similar statistics for human hosts (23% with
Paczynska et al. BMC Genetics (2015) 16:6
CpG, 1.3 CpG island per gene). We also observed that
porcine host genes have similar codon usage statistic to
random gene (average Nc statistics: 53).
In vertebrates CpG islands are properties of different
types of promoters [15]. It was observed that genes
showing tissue-specific expression in adult peripheral
tissues have mostly no CpG islands, whereas genes
showing broad expression through organismal cycle have
CpG islands. Large CpG islands are feature of promoters
of differentially regulated genes, regulators in multicellular development and differentiation. Our results on the
distribution of CpG islands in the close vicinity of genes
hosting miRNAs are in agreement with the general observation that intragenic miRNAs as other noncoding RNAs
play roles in a wide variety of biological mechanisms.
Our analysis suggests that a host protein-coding gene
harbouring a miRNA gene is not very different from
other protein-coding genes in the three studied mammalian genomes. Together with our observation on even
distribution of miRNAs in intronic, exonic and intergenic regions, the analyses of host genes support a view
that a protein-coding gene becomes a host gene by random acquisition of miRNA locus. The rate of acquisition
is independent of protein-coding gene, except that longer protein-coding genes have a higher chance of hosting a miRNA gene. The distribution of miRNAs in
mammalian genome is roughly random (except clusters
of miRNAs) with no genomic landscapes and clear connection to particular sets of protein-coding genes. We
can further speculate that if intragenic miRNAs are
coexpressed with host genes and this coexpression
model is correct, such mechanism of posttranscriptional
regulation would not be limited to particular metabolic
pathways. If there are functional links between intragenic miRNAs and their hosts, the current comparison
of hosts and random genes suggests that intragenic
miRNAs are players in regulatory mechanisms for genes
showing different pattern of expression.
As most porcine protein-coding genes, including 272
host genes, have their orthologues in the human genome, the analyses of human hosts genes described here
can be considered as an indirect examination of porcine host genes through their better annotated human orthologues.
Phylogeny evidence for miRNA genes
In general, the level of phylogeny evidence is markedly
lower for miRNA than for protein coding genes (Table 2).
Probability for a swine miRNA gene to have a human
ortholog (of any type) in the database is 45% compared
to 86% for a random protein-coding gene. It is possible that for many miRNA genes the existing orthologues sequences have not been detected yet. However,
when we compared better annotated genome of mouse
Page 5 of 12
Table 2 The level of phylogenic evidence for porcine
miRNA and protein-coding genes
Comparison
One-to-one Other type No ortholog
ortholog
ortholog
Pig to human
miRNA genes (N = 877, 100%) 32%
13%
55%
Protein-coding genes
(N = 21607, 100%)
59%
27%
14%
miRNA genes (N = 877, 100%) 27%
10%
63%
Protein-coding genes
(N = 21607, 100%)
28%
13%
miRNA genes (N = 2009, 100%) 15%
1%
84%
Protein-coding genes
(N = 22187, 100%)
12%
17%
Pig to mouse
58%
Mouse to human
71%
Percentage of the porcine genes in the Ensembl Compara database having
one-to-one or other type orthologs in human and mouse genomes. The
mouse-to-human phylogeny was included for comparison (Ensembl release 77).
(2009 miRNA genes) to human data we observed that
the proportion of orthologues pairs within miRNA genes
is even lower (16%). Hence, we can expect that after improving annotation of the genome of the pig in near future, still a significant part of the pig miRNA genes will
have no orthologs in human genome.
Current view is that miRNA genes are continuously
being added to metazoan genomes through geological
time [16]. It was observed that acquisition and fixation
of miRNAs in various animal groups correlates both
with the hierarchy of metazoan relationships and with
the non-random origination of metazoan morphological
innovations through geologic time [17]. Because phylogenetic distance between human and mouse is considered lower than between human and pig, the proportion
of shared miRNAs between human and pig should not
exceed that between human and mouse. Interestingly,
there are considerable differences in the number of
species-specific miRNA genes in the three genomes.
About 53% of the pig miRNA genes have no ortholog in
other species included in the Compara database (rel. 77),
whereas for human and mouse the percentage of unique
miRNA genes is higher (90% and 84%, respectively).
Considering swine miRNA genes having orthologs in
human genome, we observed that 71% of the shared
miRNAs genes were one-to-one orthologs. However,
similar level was calculated for protein-coding orthologs
(69%). Comparison between mouse and human also
showed that orthology between miRNA genes can be defined as good as for protein-coding genes (94% and 86%
pairs, respectively, are one-to-one type) despite large
difference in sequence length between miRNA and
protein-coding genes. It must be noted, however, that we
Paczynska et al. BMC Genetics (2015) 16:6
did not consider uncertainty in the topology of individual phylogenetic trees in the Compara database.
Conservatism of miRNA orthologs
We aligned 284 pig sequences coding for pre-miRNAs
(70-100 nt) with their human one-to-one orthologs.
Mean percentage of identity from local alignment was
93% (range 61% - 100%). Similar values were calculated
for pig-to-mouse (N = 235 pairs, identity 92%) and
mouse-to-human (N = 297 pairs, identity 92%) alignments. When we aligned only intragenic miRNA genes
located in hosts being one-to-one orthologues the mean
identity was not higher. However, sequence identity decreases when orthology status is less certain. For example, the percentage identity for ‘apparent’ one-to-one
orthologues is only 80% (65-100%) between pig and
human, 82% (55-100%) between pig and mouse and 76
(59-94%) between mouse and human.
Next we aligned sequences coding for mature miRNA
(~22 nt, we included all sequences having accession
number in miRBase). Our comparison confirmed high
conservatism among mature miRNA sequences [18].
The mean identity between pig and human was 97.8%
(range 78.3% - 100%, 178 pairs), between pig and mouse
was 96.8% (range 66.7% - 100%, 171 pairs), and between
mouse and human 97.8% (69.2% - 100%, 283 pairs).
Location of miRNA genes
We investigated whether there is any tendency in
localization of a miRNA in intergenic space. For each
intergenic miRNA in pig, human and mouse genomes we
searched 107 bp regions in both directions (5′ and 3′) for
existence of protein coding genes. The threshold of 107
was determined because in the human genome 100% of
the pairwise distances between same-strand proteincoding genes are below 107 nucleotides [13]. We chose
the closest gene in 5′ flanking region of miRNA sequence
and separately the nearest gene in 3′ flanking region (note,
miRNA having no flanking gene within this distance were
excluded). Average distance to 5′ flanking gene in pig genome was 0.464 Mb (mega base pairs) and average distance
to 3′ flanking gene was 0.504 Mb (in human genome:
0.633 Mb and 0.663 Mb respectively; in mouse genome:
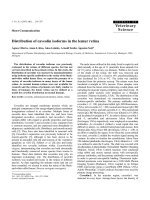
0.487 Mb and 0.514 Mb). Thus, these results show no tendency in positions of intergenic miRNA genes. To describe the positions of intergenic miRNAs in greater detail
we present bar plots showing number of miRNAs in
particular position in standardized intergenic space
(Figure 2A). Again, the plots show no clear tendency in
miRNA localization within intergenic space. For human
with the highest number of known miRNA genes the distribution is almost uniform. This lack of tendency in
miRNA position suggests that intergenic miRNA are regulated independently from their flanking protein coding
Page 6 of 12
genes. Whether this is true particularly for the miRNAs
that are most adjacent to protein coding genes must be further verified.
To visualize the location of intragenic miRNA genes
within their host protein-coding genes we present additional bar plots for the same three species (Figure 2B).
The plots show no consistent (common for all species)
tendency in intragenic miRNA localization. If we consider only human (with highest number of know miRNA
genes), we can observe small tendency towards location
of miRNA genes in both terminal fragments of host
gene. Similar tendency could be observed in pig.
Hinske et al. [19] found that 65.5% of human host
genes had miRNAs in the first five introns, however, this
observation does not necessarily mean a bias in miRNA
position toward 5′ end of host gene. Almost 93% of human host genes harbouring miRNAs sequences have at
least 5 introns, whereas only 84% includes 6 or more introns. Thus, a priori, the chance of finding miRNA genes
in a few first introns is higher than for subsequent introns. Interestingly, mouse and rat (Additional file 1:
Figure S1) seem to have alternative tendency of miRNAs
location, with most intragenic miRNAs genes localized
in a central part of host gene.
Conservatism of the location of miRNA genes
We defined a position of each miRNA gene in relation
to protein-coding genes and compared the positions between species. First, we checked whether pig intragenic
miRNA genes are harboured by same hosts as their
miRNA orthologs in human genome. As expected, for
most pig intragenic miRNA genes (72%) the comparison
to human genome was impossible due to missing or incomplete information on phylogenetic relation between
genes. Note that in order two compare positions between two species both porcine miRNA and host gene
need to have one-to-one orthologs in human genome.
Within the remaining 82 informative comparisons we
encountered 16 miRNA genes with different location between species. Six orthologs were intergenic in human
and other 10 were located in non-orthologues hosts
(Additional file 2: Data S1). These dissimilar locations
could be partly explained by the incorrect annotation of
protein-coding hosts, which may be longer than described based on available transcripts. The comparisons
between pig and mouse (64 pairs) and between mouse
and human (140 pairs) also revealed rare individual differences between species. In most such cases, an orthologues miRNA genes were found in non-orthologues
hosts (pig v. mouse: 2 cases; mouse v. human: 13 cases).
Next we compared positions of intergenic miRNA
genes between species. Again, most miRNA genes could
not be compared due to unknown or ambiguous phylogeny. Note that in order to detect dissimilar location of
Paczynska et al. BMC Genetics (2015) 16:6
Page 7 of 12
Figure 2 Distribution of location of miRNA genes in the genomes of pig, human and mouse. A) Positions of miRNA genes in intergenic
space. The space between flanking protein-coding genes was standardized to 1 and the position of each intergenic miRNA gene was mapped
on the standardized space. Value close to zero at x-axis indicates that miRNA is situated closer to 5′ flanking gene and values closer to 1 indicate
localization of miRNA close to 3′ flanking gene. B) Positions of intragenic miRNA genes in gene space. The space between start and end of a host
gene was standardized to 1 and the position of each intragenic miRNA gene was mapped on the standardized space. Value close to zero at
x-axis indicates that miRNA is situated closer to start of host gene and value closer to 1 indicates localization of miRNA close to end of this host
gene. The number of miRNA genes analyzed is given in parentheses.
miRNA between species the two protein coding genes
flanking the miRNA locus must both have orthologs in
other species. Within 55 informative cases in the pig-tohuman comparison we observed 12 dissimilar locations
(9 human orthologues miRNA genes were found in
different intergenic space, whereas 3 others were intragenic) (Additional file 2: Data S1). Further, within
54 informative cases in the pig-to-mouse comparison
we observed 6 dissimilar locations (4 in different intergenic region and 2 intragenic). The mouse-to-human
Paczynska et al. BMC Genetics (2015) 16:6
comparison (98 informative cases) revealed only 5 such
dislocations, therefore, it is possible that some of the
pig-human dissimilarities stem from incorrect genome
annotation.
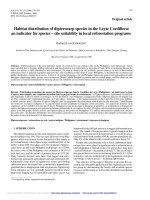
We also examined precise location of intergenic
miRNAs in intergenic space and of intragenic miRNA
genes within host genes (Figure 3). In this analysis we required that only miRNA genes are one-to-one orthologues whereas flanking genes and host genes were not
checked. The comparison revealed a considerable variation in miRNA position between species. The dissimilarities were present in all the three between-species
comparisons and were slightly greater for intergenic
miRNAs than for intragenic sequences. Some of the
differences may result from existence of sequence repeats.
We further analysed in greater detail the situations where
orthologues miRNA genes have different location in two
species (more than 0.25 in standardized space). In the pigto-human comparison we observed 31 swine intergenic
and 10 intragenic miRNA genes showing different position
than their human orthologs.
With respect to the 31 intergenic miRNA genes, 11 of
them also showed dissimilar location in pig-to-mouse
comparison. Whereas average intergenic space is ~1 Mb,
the 11 miRNA genes are located in much longer intergenic regions (average size ~4 Mb) and six of them are
clustered witin a single region of ~6 Mb. Interestingly, in mouse-to-human comparison dissimilar locations (difference = 0.1, 28 mouse miRNA genes) were
linked to shorter intergenic space (avg. ~ 0.6 Mb for 28
mice miRNA genes vs. ~1 Mb for random intergenic
miRNA genes).
Concerning the 10 intragenic miRNA genes with dissimilar locations in pig-to-human comparison we also
observed that 7 of them show dissimilar locations in pigto-mouse comparison as well. The 7 miRNA genes are
hosted in protein-coding genes that are not considerable
longer than random pig host gene. However, we noticed
that these dissimilar locations of intragenic miRNA
genes can be explained by variation in number and size of
introns in the two orthologues host genes, multiple transcription variants of protein coding gene, or by the fact that
some UTR sequences are identified in human genome but
not in the pig. Again, in mouse-to-human comparison dissimilar locations (difference = 0.1, 14 mouse miRNA genes)
were linked to shorter host genes (avg. ~ 64 kb for 14 hosts
vs. ~ 0.61 Mb for random hosts).
In conclusion, our comparisons suggest that positions
of miRNA genes, relative to protein-coding genes,
are conservative among studied mammal species. The
orthologues intergenic miRNA genes are usually located
within corresponding intergenic fragments being flanked
by orthologues protein-coding genes. Similarly, the
orthologues intragenic miRNA genes are hosted by
Page 8 of 12
protein-coding genes being orthologues as well. However, some number of dissimilar locations of orthologues
miRNA genes cannot be excluded. Despite this conservatism, there are however differences in precise location of
miRNAs in particular intergenic regions and within particular hosts.
Pig-specific miRNA genes
Next we examined 463 porcine miRNA genes that have
no orthologues in any of the genomes included in the
Compara database. Such miRNAs are probably pig specific, however, it is also possible that for some miRNAs
orthologues sequences exist but have not been discovered yet. Nevertheless this group of miRNA genes is
probably phylogenetically young and we were interested
in which part of the pig genome the new sequences
evolved. Within the pig-specific miRNA genes, 67% was
intergenic, 25% was intronic and 8% was exonic. These
proportions are very similar to those calculated for all
miRNA genes. This suggests that phylogenetically new
intragenic miRNA genes evolve with the same frequency
like phylogenetically old genes and that this proportion
does not change in evolutionary time.
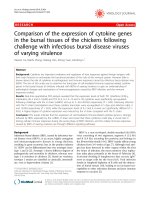
We observed, however, that pig-specific miRNA genes
(novel genes) are less likely to be clustered than conserved ones (Figure 4). We defined 3000 nt as the maximal distance for two same-chromosome same-strand
miRNA genes to be considered as clustered [13]. The
same definition was applied for inter- and intragenic
miRNA genes. By this definition, porcine miRNAs genes
are organized in 50 clusters, mostly pairs (34) and triplets (7). Within the pig-specific miRNA genes only 4%
were found in clusters, whereas within the conserved
genes up to 37% are organized in clusters. Similar tendency was observed for human-specific (9% and 37%,
respectively) and mouse-specific miRNA genes (14% and
43%). This implies that phylogenetically new miRNA
genes more like evolve in new chromosomal locations.
We considered all 95 pig-specific miRNA genes located within protein-coding genes on host strand. These
95 miRNAs genes were located in 94 protein-coding
hosts. We identified all 67 human ortologs of these hosts
(only one-to-one type was considered) and performed
gene enrichment analyses. For this set of 67 genes the
DAVID algorithm showed similar enrichment in geneterms as for all previously considered hosts in the human genome. We conclude that phylogenetically young
intragenic swine miRNA genes are not linked with any
particular biological process via their host genes.
In order to search for pig-specific miRNA genes that
are differentially expressed from other porcine miRNA
genes we utilized publically available GEO datasets
GSE28140. The data include miRNA expression evaluated
using RAKE coupled with a spike-in based quantization
Paczynska et al. BMC Genetics (2015) 16:6
Figure 3 (See legend on next page.)
Page 9 of 12
Paczynska et al. BMC Genetics (2015) 16:6
Page 10 of 12
(See figure on previous page.)
Figure 3 Comparison of the position of miRNA genes in the intergenic regions and host genes (number of gene pairs and linear
correlations are given in parantheses). A) Positions of miRNA genes in intergenic space. The space between flanking protein-coding genes
was standardized to 1 and the position of each intergenic miRNA gene was mapped on the standardized space. B) Positions of intragenic miRNA
genes in gene space. The space between start and end of a host gene was standardized to 1 and the position of each intragenic miRNA gene
was mapped on the standardized space.
method in 14 different swine tissues [20]. Within the group
of the 463 pig-specific miRNA genes we identified 16 genes
represented in the expression study, whereas the remaining
group was represented by 96 miRNA. The expression data
and the Mann–Whitney U test provided no evidence that
pig-specific miRNA genes are differentially expressed in
any of the tested porcine tissues. Across-tissue analysis revealed that transcript level of the pig-specific miRNA genes
is slightly lower (p-value = 0.035), the difference, however,
was very small and due to a few extreme values.
In previous studies striking positive correlation was
found between expression levels of miRNA families and
their age [12,21]. This observation concerns, however,
longer evolutionary distances, for example, when primatespecific miRNA gene families are contrasted with ancient
families. We found no evidence of differentially expressed
miRNAs when pig-specific miRNAs are contrasted with
the remaining genes. The comparison, however, included
small number of pig-specific miRNA genes (n = 16), therefore is not definitive.
Conclusions
Recent selective sweep analysis indicates that genes involved in RNA splicing and RNA processing may be
under positive selection in pig lineage [6]. Here we studied pig miRNA - other key regulators of genes at the
level of RNA. The distribution of miRNA genes in pig
genome shows no particular relation to protein coding
genes. Number of miRNA genes localized in intergenic
regions, introns and exons roughly agrees with the size
of these regions in pig genome. Similarly, a random distribution of miRNAs genes with no connection to the
localization of protein-coding genes was observed here
in human and mouse. The finding by other authors that
miRNAs are more often localized in intragenic regions is
true when both DNA strands are analysed together, but
not separately.
We showed in human data that host genes harbouring
intragenic miRNAs are not different from other proteincoding genes with respect to GO annotation. Similar result can be expected for the pig. Therefore we speculate
Figure 4 Cumulative distance distribution of miRNA genes in pig. Novel genes are pig-specyfic (based on Compara database). The distances
(in nucleotides) between every two same-chromosome same-strand successive miRNA genes were obtained from Ensembl (ver. 77). Distance is
drawn on a logarithmic scale.
Paczynska et al. BMC Genetics (2015) 16:6
that mechanism of posttranscriptional regulation of genes
by their intragenic miRNAs is not limited to particular
metabolic pathways and intragenic miRNAs are players in
regulatory mechanisms for genes showing different pattern of expression. We observed that regions coding for
pig pre-miRNAs have similar sequence to their human
and mouse orthologues. Our further analysis showed that
localization of pig miRNA genes and their orthologues in
human and mouse is also similar. There are, however, differences in precise location of miRNAs in particular intergenic regions and within particular hosts. Whether these
dissimilarities translates to dissimilar function or alters
coexpression with protein-coding genes remains unknown. The most prominent difference between swine
and human miRNAs is a large group of pig-specific sequences (53% of swine miRNAs). We found no evidence
that this group of evolutionary new swine miRNAs is different from old miRNAs genes with respect to localisation
in the pig genome except that they are less likely to be
clustered. Functional studies of these miRNAs in future
may reveal limits of the pig as a model organism to study
human gene expression.
Methods
The following species were included: pig (Sus scrofa),
mouse (Mus musculus) and human (Homo sapiens). Annotations of miRNA sequences and protein coding genes
were obtained from Ensembl genome databases, release
77 (October 2014) [22]. Ensembl release 77 included the
high-coverage Sscrofa10.2 assembly of the pig genome
(August 2011) produced by the Swine Genome Sequencing Consortium (SGSC). It consists of 20 chromosomes
(1–18, X and Y) and 4562 unplaced scaffolds (GenBank
assembly accession GCA_000003025.4). Data were retrieved and processed by the use of Ensembl Perl API
(Ensembl Core Perl API for release 77). Protein coding genes were retrieved by the annotation keyword
“protein_coding”, whereas miRNA sequences were retrieved by “miRNA” keyword.
To define inter- or intragenic miRNA location the variables strand (+/−), chromosome number, start and end
positions for protein coding genes and miRNA sequencing were retrieved from Ensembl Database. A miRNA
sequence was considered as intragenic when its entire
length was included between start and end position of a
protein coding gene, on the same chromosome. We observed two types of intragenic miRNA sequences: (a) located on same strand as host gene and (b) on opposite
strand. Non-intragenic miRNAs were treated as intergenic sequences. Total genome length was taken directly
from Ensembl summary of species genome. Proportion
of gene sequences was calculated as the total length of
all exons and introns (both strands) divided by total genome length in base pairs. The number of exons within a
Page 11 of 12
gene was obtained by a use of Ensembl Perl API function get_all_exons, which returns the number of all variants of each known exon. Therefore the total number of
exons can be higher than transcribed.
CpG islands were predicted within a 5′ flanking region
of 2 kbp. We use newcpgreport from Emboss package
[23]. By default, this program defines a CpG island as a
region where, over an average of 10 windows, the calculated % composition is over 50% and the calculated Obs/
Exp ratio is over 0.6 and the conditions hold for a minimum of 200 bases. Codon usage statistic was calculated
by programme chips from Emboss package (Nc statistics).
For sequence comparison orthologues pairs of miRNAs
were obtained from Ensembl database (by using Perl API
Compara). After defining orthology the mature miRNA sequences were retrieved from miRBase. Sequences were
aligned with the water (immature sequences) and needle
(mature sequences) programmes from Emboss package.
We applied the Database for Annotation, Visualization and
Integrated Discovery (DAVID) ver. 6.7 and to identify
enriched biological terms, including GO terms [24]. A
term was considered important when 3 criteria were met:
p-value (EASE) was below 0.01, percentage of user’s input
gene hitting a given term was above 15% (but no less than
10 genes), and fold enrichment was ≥1.5.
Additional files
Additional file 1: Figure S1. Distribution of location of intragenic
miRNA genes in the genome of rat. The space between start and end of
a host gene was standardized to 1 and the position of each intragenic
miRNA gene was mapped on the standardized space. The number of
miRNA genes analyzed are given in parentheses.
Additional file 2: Data S1. Pig miRNA genes showing dissimilar
locations in pig-to-human comparison.
Competing interests
The authors declare that they have no competing interests.
Authors’ contributions
PP and AG conducted most of bioinformatic analyses. MS designed the
research, developed some of the analysis software and conduct bioinformatics
analyses. PP and MS wrote the paper. All authors read and approved the final
manuscript.
Acknowledgements
Supported by the Polish Ministry of Science and Higher Education,
Grant no. N N311 029039.
Received: 13 August 2013 Accepted: 16 January 2015
References
1. Lagos-Quintana M. New microRNAs from mouse and human. RNA.
2003;9:175–9.
2. Bartel DP. MicroRNAs: genomics, biogenesis, mechanism, and function. Cell.
2004;116:281–97.
3. Kim VN, Nam JW. Genomics of microRNA. Trends Genet. 2006;22:165–73.
4. Baskerville S, Bartel. Microarray profiling of microRNAs reveals frequent
coexpression with neighboring miRNAs and host genes. RNA.
2005;11:241–7.
Paczynska et al. BMC Genetics (2015) 16:6
5.
6.
7.
8.
9.
10.
11.
12.
13.
14.
15.
16.
17.
18.
19.
20.
21.
22.
23.
24.
Page 12 of 12
de Almeida AM, Emøke B. Pig proteomics: a review of a species in the
crossroad between biomedical and food sciences. J Proteome.
2012;75:4296–314.
Groenen MA, Archibald AL, Uenishi H, Tuggle CK, Takeuchi Y, Rothschild MF,
et al. Analyses of pig genomes provide insight into porcine demography
and evolution. Nature. 2012;491:393–8.
Anthon C, Tafer H, Havgaard JH, Thomsen B, Hedegaard J, Seemann SE,
et al. Structured RNAs and synteny regions in the pig genome. BMC
Genomics. 2014;15:459–86.
Inukai S, de Lencastre A, Turner M, Slack F. Novel microRNAs differentially
expressed during aging in the mouse brain. PLoS One. 2012;7:e40028.
Kozomara A, Griffiths-Jones S. miRBase: annotating high confidence
microRNAs using deep sequencing data. Nucleic Acids Res. 2014;42:D68-D73.
Godnic I, Zorc M, Jevsinek Skok D, Calin GA, Horvat S, Dovc P, et al.
Genome-wide and species-wide in silico screening for intragenic
MicroRNAs in human, mouse and chicken. PLoS One. 2013;8(6):e65165.
Li SC, Tang P, Lin WC. Intronic MicroRNA: discovery and biological
implications. DNA Cell Biol. 2007;26:195–207.
Meunier J, Lemoine F, Soumillon M, Liechti A, Weier M, Guschanski K, et al.
Birth and expression evolution of mammalian microRNA genes. Genome
Res. 2013;23:34–45.
Altuvia Y, Landgraf P, Lithwick G, Elefant N, Pfeffer S, Aravin A, et al.
Clustering and conservation patterns of human microRNAs. Nucleic Acids
Res. 2005;33:2697–706.
He C, Li Z, Chen P, Huang H, Hurst LD, Chen J. Young intragenic miRNAs
are less coexpressed with host genes than old ones: implications of miRNAhost gene coevolution. Nucleic Acids Res. 2012;40:4002–12.
Akalin A, Fredman D, Arner E, Dong X, Bryne JC, Suzuki H, et al. Transcriptional
features of genomic regulatory blocks. Genome Biol. 2009;10:R38.
Campo-Paysaa F, Sémon M, Cameron RA, Peterson KJ, Schubert M.
microRNA complements in deuterostomes: origin and evolution of
microRNAs. Evol Dev. 2011;13:15–27.
Sempere LF, Cole CN, McPeek MA, Peterson KJ. The phylogenetic
distribution of metazoan microRNAs: insights into evolutionary complexity
and constraint. J Exp Zool B Mol Dev Evol. 2006;306B:575–88.
Jevsinek Skok D, Godnic I, Zorc M, Horvat S, Dovc P, Kovac M, et al.
Genome-wide in silico screening for microRNA genetic variability in
livestock species. Anim Genetics. 2013;44:669–77.
Hinske LC, Galante PA, Kuo WP, Ohno-Machado L. A potential role for
intragenic miRNAs on their hosts’ interactome. BMC Genomics.
2010;11:533.
Martini P, Sales G, Brugiolo M, Gandaglia A, Naso F, De Pittà C, et al. Tissuespecific expression and regulatory networks of pig microRNAome. PLoS
One. 2014;9(4):e89755.
Roux J, Gonzàlez-Porta M, Robinson-Rechavi M. Comparative analysis of
human and mouse expression data illuminates tissue-specific evolutionary
patterns of miRNAs. Nucleic Acids Res. 2012;40:5890–900.
Flicek P, Amode MR, Barrell D, Beal K, Billis K, Brent S, et al. Ensembl 2014.
Nucleic Acids Res. 2014;42(Database issue):D749–55.
Rice P, Longden I, Bleasby A. EMBOSS: The European Molecular Biology
Open Software Suite. Trends Genet. 2000;16:276–7.
Huang DW, Sherman BT, Lempicki RA. Systematic and integrative analysis of
large gene lists using DAVID bioinformatics resources. Nat Protoc.
2009;4:44–57.
Submit your next manuscript to BioMed Central
and take full advantage of:
• Convenient online submission
• Thorough peer review
• No space constraints or color figure charges
• Immediate publication on acceptance
• Inclusion in PubMed, CAS, Scopus and Google Scholar
• Research which is freely available for redistribution
Submit your manuscript at
www.biomedcentral.com/submit