Relative performance of gene- and pathway-level methods as secondary analyses for genome-wide association studies
Bạn đang xem bản rút gọn của tài liệu. Xem và tải ngay bản đầy đủ của tài liệu tại đây (505.64 KB, 9 trang )
Wojcik et al. BMC Genetics (2015) 16:34
DOI 10.1186/s12863-015-0191-2
RESEARCH ARTICLE
Open Access
Relative performance of gene- and pathway-level
methods as secondary analyses for genome-wide
association studies
Genevieve L Wojcik1,2*, WH Linda Kao1 and Priya Duggal1
Abstract
Background: Despite the success of genome-wide association studies (GWAS), there still remains “missing heritability”
for many traits. One contributing factor may be the result of examining one marker at a time as opposed to a group of
markers that are biologically meaningful in aggregate. To address this problem, a variety of gene- and pathway-level
methods have been developed to identify putative biologically relevant associations. A simulation was conducted to
systematically assess the performance of these methods. Using genetic data from 4,500 individuals in the Wellcome Trust
Case Control Consortium (WTCCC), case–control status was simulated based on an additive polygenic model.
We evaluated gene-level methods based on their sensitivity, specificity, and proportion of false positives. Pathway-level
methods were evaluated on the relationship between proportion of causal genes within the pathway and the strength
of association.
Results: The gene-level methods had low sensitivity (20-63%), high specificity (89-100%), and low proportion of false
positives (0.1-6%). The gene-level program VEGAS using only the top 10% of associated single nucleotide polymorphisms
(SNPs) within the gene had the highest sensitivity (28.6%) with less than 1% false positives. The performance of the
pathway-level methods depended on their reliance upon asymptotic distributions or if significance was estimated in a
competitive manner. The pathway-level programs GenGen, GSA-SNP and MAGENTA had the best performance while
accounting for potential confounders.
Conclusions: Novel genes and pathways can be identified using the gene and pathway-level methods. These
methods may provide valuable insight into the “missing heritability” of traits and provide biological interpretations to
GWAS findings.
Keywords: Genome-wide Association Studies, Gene Set, Biological Pathways
Background
In less than one decade after their advent, genome-wide association studies (GWAS) have been remarkably successful
and have elucidated many loci for diverse phenotypes [1].
However, there remains “missing heritability”, or the discrepancy between the low amounts of within-population
phenotypic variation explained by GWAS results and
the higher estimates of narrow-sense heritability [2]. One
explanation for this missing heritability is current studies
are underpowered to identify contributing genetic variants.
* Correspondence:
1
Department of Epidemiology, Johns Hopkins University Bloomberg School
of Public Health, Baltimore, MD, USA
2
Department of Genetics, Stanford University School of Medicine, Stanford,
CA, USA
The conservative adjustment of the significance threshold
(α) for the 1–2.5 million tests results in a p-value significance threshold of 5×10⁻⁷ [3], and biologically-relevant
genetic associations may lie below this threshold, but are
ignored in many traditional GWAS.
To improve power within a biologic context, a multitude
of gene- and pathway-level methods have been developed
for the secondary analyses of GWAS results. These
methods aggregate markers into biologically relevant units,
such as a gene or pathway, and test the associations within
that unit. These methods increase power by combining
multiple weak or moderate signals and allow for allelic
or locus heterogeneity. An additional motivation for geneor pathway-level methods is the potential for biologically
relevant interpretation as the genes or pathways can be
© 2015 Wojcik et al.; licensee BioMed Central. This is an Open Access article distributed under the terms of the Creative
Commons Attribution License ( which permits unrestricted use, distribution, and
reproduction in any medium, provided the original work is properly credited. The Creative Commons Public Domain
Dedication waiver ( applies to the data made available in this article,
unless otherwise stated.
Wojcik et al. BMC Genetics (2015) 16:34
selected based on prior knowledge, or in a genome-wide
manner. In comparing these programs, many of the issues
surrounding these analytical methods are similar, however
the underlying hypotheses and limitations may be distinct.
Gene-level methods look for the joint association of
independent signals within a gene. The framework
posits that genes contain multiple alleles that may be
associated with the outcome of interest, known as
allelic heterogeneity, which may only be detected
through an aggregate single nucleotide polymorphism
(SNP) test. Gene-level methods can be loosely categorized into three groups: classical, updated classical, and
novel methods. Classical methods, not specifically developed for genetic data, assume that independent statistics are combined. Updated classical methods use
these classical frameworks while accounting for linkage
disequilibrium between SNPs within the gene by reducing the dimensions to an effective number of independent SNPs. Novel methods directly estimate the
linkage disequilibrium in the genetic data and apply
these correlation matrices to statistical estimation. An
ideal gene-level method would have high sensitivity
and specificity with a low number of false positives. It
should also be able to distinguish between multiple independent signals and multiple associations due to
linkage disequilibrium.
A pathway, or gene set, is a related collection of genes
that can be grouped together based on their biological functions or previous knowledge of disease pathogenesis. The
goal of pathway-level methods is to determine if the genetic
associations from a GWAS are enriched within a set of
genes in a pathway. Most of these pathway methods ignore
multiple association signals due to allelic heterogeneity and
can be loosely categorized into two groups: competitive and
self-contained [4]. Competitive methods assess if strong associations cluster within the gene set at a higher proportion
compared to associations outside of the gene set. They depend on the overall distribution of the statistics for all genes
genome-wide. Therefore, competitive methods are not ideal
for candidate gene studies. Self-contained methods estimate
the joint association of the genes within a gene set and typically assume an asymptotic distribution to assess significance, allowing a candidate gene set analysis, but this may
be the incorrect distribution for the data.
With a wide variety of published methods, the field still
lacks a consensus as to the best practice [4,5]. To address
this knowledge gap, we evaluated 21 different methods with
readily available software through phenotypic simulation
using real genotypic data of 4,500 individuals from the
Wellcome Trust Case Control Consortium. We systematically evaluated the relative performance of gene- and
pathway-level methods for a case–control GWAS through
a simulation of over 17,000 genes and 20 pathways from
the Gene Ontology Biological Processes.
Page 2 of 9
Results
Gene-level analyses
A total of 11 methods were evaluated: Fisher’s Combination Test (FCT), Sidak’s Combination Test, Simes’ Test,
False Discovery Rate (FDR), Truncated Product Method
(TPM), GATES (weighted and unweighted), HYST
(weighted and unweighted), and VEGAS (using all SNPs
and only the top 10% of SNPs per gene). All gene-level
methods were able to detect genes with and without a
genome-wide statistically significant SNP (P < 5×10⁻⁷).
For example, the gene-level program VEGAS using only
the top 10% of associated SNPs identified 14 ‘true positive’ genes with P < 0.001. Of these 14 genes, only 5 had
a SNP with genome-wide significance at P < 5×10⁻⁷.
Of the 11 methods evaluated, Truncated Product
Method (TPM), an updated classical method, had the
highest sensitivity (63%) (Table 1). However, it also had
the second highest proportion of false positives (4.9%)
and the second lowest specificity (92.9%). Fisher’s Combination Test, the classical method, had similar results
with sensitivity of 59%, specificity of 88.6%, and a proportion of false positives of 5.9%. Sidak’s Combination
Test, another classical method, had the lowest sensitivity
(18.4%), and the lowest proportion of false positives
(0.11%). Newer methods all performed similarly. GATES
and HYST, updated classical methods, were nearly identical in their predictions with sensitivity of 24.49%, specificity of 98%, and false positive proportions of 0.17% and
0.16%, respectively. VEGAS, a novel method, had a similar performance with sensitivity of 20.41% and 100% specificity. The proportion of false positives was low at
0.16%. With the exception of Fisher’s Test, Simes’ Test,
and TPM, all methods had less than 1% false positives.
Agreement between programs
Pearson’s correlations were calculated to assess the pairwise P -value agreement for the 11 gene-level methods
across all 17,000 genes (range 33-98%) (Additional file 1:
Figure S5). The highest correlations were found within
the previously assigned groups (Table 1); the updated
classical methods had high correlation with each other
(>95%) with the exception of TPM; the novel methods,
the two VEGAS methods (all and top 10%), had similarly
high correlation in their P-values (88%). Surprisingly, the
lowest correlation was between the GATES-associated
methods and Simes’ Test (31-34%), considering that
GATES is an extended Simes procedure.
Stratified results
To examine the influence of effect size on the different
methods’ performances, sensitivity was estimated separately
for genes simulated to have a large effect size (OR = 2) and
genes with a smaller effect size (OR = 1.2) (Table 2). As expected, sensitivity was higher when the effect size was large
Wojcik et al. BMC Genetics (2015) 16:34
Page 3 of 9
Table 1 Performance of gene-level methods
Group
Method
Sensitivity (%)
Specificity (%)
False positives (%)
False negatives (%)
Classical
Fisher
59.18
88.64
5.89
40.82
Sidak
18.37
97.73
0.11
81.63
Simes
46.94
97.73
1.33
53.06
FDR
24.49
97.73
0.13
75.51
TPM
63.04
92.86
4.93
36.96
GATES
24.49
98.00
0.17
75.51
WGATES
26.53
98.00
0.16
73.47
HYST
24.49
98.00
0.16
75.51
WHYST
24.49
98.00
0.16
75.51
VEGAS
20.41
100.0
0.16
79.59
VEGAS [10%]
28.57
98.00
0.40
71.43
Updated Classical
Novel
compared to a smaller effect size, with the exception
of Sidak’s Combination Test. This is likely due to
Sidak’s test depending upon the minimum P-value
within the gene. The sensitivity for the larger effect
sizes (OR = 2) was also higher than the overall sensitivity from Table 1. This is consistent with the original
simulation framework, as the ‘true positive’ genes that
were simulated to have a larger effect size will have
smaller p-values on the SNP-level due to increased
power, which then translates to the gene-level analyses.
Genes were also stratified based on the number of
causal SNPs determined from the simulation (Table 2).
Of the 50 true positive genes, 8 genes were simulated
using 1 causal SNP, 22 had 2 causal SNPs, and 20 had 5
causal SNPs. Within the classical methods, the sensitivity
estimates remained relatively consistent across the causal
SNP categories, whereas for the newer methods, sensitivity
increased with the number of causal SNPs. This is
consistent with their methodology, derived to combine independent signals for a stronger joint association. Neither
version of the program VEGAS found genes with only one
causal SNP as significant. Within genes with five causal
SNPs, VEGAS’s sensitivity increased to 40% from the
original overall 28.57%.
Pathway-level analyses
A total of 10 pathway-level programs were evaluated: ALIGATOR, GenGen, GSA-SNP, GSEA-SNP, MAGENTA,
Modified Generalized Fisher Method (MGFM), SNP Ratio
Test (SRT), GRASS, HYST, and Plink Set Test (PST). Only
the 20 pathways that were simulated to be associated were
evaluated (Additional file 1: Table S3). The method with
the most significant P-values was HYST, with five pathways
having a P < 0.001. Pathways in which there were no
causal genes (all smaller pathways) did not have significant results by any method. Similarly, no pathways
Table 2 Stratified sensitivities by effect sizes and number of causal SNPs under simulation
Group
Method
Sensitivity
(OR* = 2)
Sensitivity
(OR* = 1.2)
Sensitivity
(1 SNP)
Sensitivity
(2 SNPs)
Sensitivity
(5 SNPs)
Classical
Fisher
66%
17%
50%
64%
60%
Sidak
18%
33%
12%
18%
20%
Simes
50%
17%
50%
50%
45%
FDR
27%
17%
25%
27%
25%
TPM
68%
20%
57%
63%
65%
GATES
25%
17%
12%
18%
35%
GATES [Weighted]
27%
17%
25%
18%
30%
HYST
25%
17%
12%
18%
40%
Weighted GATES/HYST
25%
17%
12%
18%
35%
VEGAS
23%
17%
0%
27%
25%
VEGAS [10%]
32%
17%
0%
32%
40%
Updated Classical
Novel
Sensitivity and specificity calculated using subset of 49 true positive and 50 true negative genes. False positive and false negative percentages calculated using
entire dataset of ~17,000 genes.
*OR = Odds Ratio.
Wojcik et al. BMC Genetics (2015) 16:34
Page 4 of 9
were significant that had less than 12% causal genes.
Pathway-level methods can be separated into two
groups: competitive (ALIGATOR, GenGen, GSA-SNP,
GSEA-SNP, MAGENTA, MGFM, SNP Ratio Test) and
self-contained (GRASS, HYST, Plink Set Test). Selfcontained tests had more ‘significant’ (P < 0.001) findings
than the competitive methods. Within the competitive
methods, only two pathways were significant and only by
GSA-SNP. However, within the five pathways with the
most causal genes (12-28%), at least one self-contained
method found each significant.
Performance of methods
Many of the methods are competitive, with individual
pathway’s results depending on the distribution of all evaluated genes. Because of this, the rankings of a pathway
may be more informative than the statistical significance.
Within each method the P-values for the sets were ranked
from smallest/strongest (1) to largest/weakest (10). For
each pathway, the mean ranking was calculated across the
10 methods for only the larger pathways. Overall, the larger
proportions of causal genes were correlated with the higher
rankings (correlation of −0.75) (Additional file 1: Figure
S6). Correlations between the individual methods’ rankings
and the proportion of associated genes ranged from −0.26
(Plink Set Test) to −0.64 (GenGen) (Table 3).
Correlation between methods
The correlation in P-values between the methods varied
from 0.07 (SRT and GRASS) to 0.81 (MAGENTA and
GSA-SNP). The SNP Ratio Test (SRT) had the lowest
correlations with all the methods. The correlations between a method’s ranking of pathways with the mean
ranking for that pathway across all methods varied, with
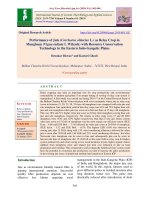
the strongest being MAGENTA (0.9). In a heatmap of
the results from the larger pathways, organized from the
gene sets with no associated genes to 33% of the genes
being associated on the right, three methods cluster
together based on their gene set rankings: GenGen,
GSA-SNP, and MAGENTA. (Figure 1) They exhibit
a trend of weaker P-values and higher rankings with
the smaller proportion-associated pathway, and stronger
signals in the pathways with more genes associated with
outcome (Additional file 1: Table S4).
Discussion
The goal of gene- and pathway-level methods is to assess
enrichment of signals within genes and pathways that
might otherwise have been underpowered in a traditional GWAS. The ideal method should be able to
detect genes and pathways with small to moderate effect
size SNP associations while emphasizing multiple independent signals as opposed to multiple dependent SNPs
in linkage disequilibrium. It should have high sensitivity
and specificity with a low proportion of false positives.
To determine the best method, the relative performance
of 11 gene-level and 10 pathway-level methods for GWAS
was evaluated through a simulation for 20 different gene
sets from Gene Ontology (GO) Biological Processes and
over 17,000 genes.
All gene-level methods identified loci that would have
otherwise been ignored by a traditional GWAS. The
highest sensitivity, or proportion of ‘true positive’ genes
that the method determined as associated, was found
using Truncated Product Method (63.04%), but this
method also had the second lowest specificity (92.86%)
and the second highest proportion of false positives
(4.93%). This is expected, as the original’s Fisher’s Combination Test (FCT) is prone to test statistic inflation because it combines P-values incorrectly assumed to be
independent, as linkage disequilibrium between genic
SNPs creates correlation structure. The Truncated Product
Table 3 Correlation for pathway-level results between rankings within each method and the proportion of associated
genes within the pathway using only the 10 larger pathways evaluated, as well as correlation with mean ranking
across all programs
Group
Method
Citation
Input
Correlation with causal proportion
(95% CI)
(95% CI)
Competitive
ALIGATOR
[24]
SNP P-values
−0.6 (−0.89, 0.05)
0.75 (0.22, 0.94)
GenGen
[25]
SNP P-values
−0.64 (−0.91, −0.02)
0.82 (0.41, 0.96)
Self-Contained
Correlation with mean ranking
GSA-SNP
[21]
SNP P-values
−0.59 (−0.89, 0.06)
0.78 (0.28, 0.94)
GSEA-SNP
[22]
Raw Genotypes
−0.6 (−0.89, 0.04)
0.73 (0.18, 0.93)
MAGENTA
[20]
SNP P-values
−0.63 (−0.9, 0)
0.9 (0.62, 0.98)
MGFM
[26]
SNP P-values
−0.53 (−0.87, 0.15)
0.7 (0.13, 0.92)
SRT
[27]
Raw Genotypes
−0.43 (−0.84, 0.27)
0.55 (−0.12, 0.88)
GRASS
[23]
Raw Genotypes
−0.49 (−0.86, 0.2)
0.53 (−0.15, 0.87)
HYST
[18]
SNP P-values
−0.57 (−0.88, 0.09)
0.84 (0.46, 0.96)
PST
[11]
Raw Genotypes
−0.26 (−0.76, 0.44)
0.55 (−0.12, 0.88)
Wojcik et al. BMC Genetics (2015) 16:34
Figure 1 Heatmap of results for pathway-level methods by the
proportion of associated genes within the gene sets. The results
are P-values for all pathways using the methods for a complete
assessment of performance. Pathways with similar performances will
cluster together along the y-axis, as indicated by the dendrogram.
Proportion of associated genes (at least one SNP with P < 0.01) is
indicated along the x-axis from left (0%) to right (33%). Intensity of
color refers to stronger signals (lower P-values), which increases with
the proportion of associated genes for most methods.
Method (TPM) is an adaptation of FCT, only considering
P-values under a certain threshold (0.1 in this case) and
combining them in a similar manner. This generalized
inflation leads to the highest sensitivity, paired with
the second highest proportion of false positives next to
FCT. The highest specificity was found with VEGAS, a
more conservative approach with a sensitivity of
20.41%. VEGAS adjusts for linkage disequilibrium directly by estimating the correlation structure with HapMap data, or the raw genotype data from the GWAS,
and integrating it into the statistics. This may be a
conservative procedure, as VEGAS also has the highest
level of false negatives among methods with similar
false positive proportions, especially when it comes to
smaller effect sizes. An additional option is to use
VEGAS with only the top 10% of SNPs within a gene,
resulting in higher sensitivity (29%) while maintaining
high specificity (98%) and a low proportion of false
positives (0.40%).
Analyses stratified by the simulated effect sizes or the
number of causal SNPs reinforces the framework underlying genome-wide association studies assuming a polygenic model. Smaller effect sizes are underrepresented in
SNPs with P < 0.01. The original 226 genes were divided
evenly between the two effect sizes (OR = 1.2 vs OR = 2.0)
within the simulation. However, only 6 of the 49 true
positive genes had the smaller effect size (OR = 1.2). This
is consistent with larger effect sizes having increased
power compared to smaller effect sizes within the GWAS
model [6]. Because true positive genes required at least one
SNP with P < 0.01, the underpowered smaller effect sizes
were not represented well in this group. Sensitivity was
Page 5 of 9
increased for all methods within the stronger effect genes.
The number of independent causal SNPs also had a large
effect on the method’s sensitivity. For most methods, sensitivity increased with the number of causal SNPs or independent signals. VEGAS, using either all of the SNPs
within the gene or just the top 10% of associated SNPs, did
not detect genes which had only one causal SNP while sensitivity was increased within genes with 2 or 5 independent
causal SNPs. If the underlying hypothesis is that there are
multiple causal SNPs within a gene that could be contributing to the outcome, as is the case with allelic heterogeneity, then VEGAS will help to differentiate between genes
that have multiple signals due to linkage disequilibrium or
multiple independent signals.
All methods had a small amount of bias in regards to
physical gene size, with the absolute number of SNPs in the
gene having more of an effect (Additional file 1: Figure S9).
Consistent with violating the underlying assumption of independence between association signals within FCT, an increase in the number of SNPs resulted in a less accurate
analysis. The proportion of causal SNPs to the total number
of SNPs in the gene influenced the accuracy of VEGAS
using the top 10% SNPs, increasing the accuracy with the
higher proportion of causal SNPs. This is consistent with
the aim of gene-level methods to elucidate genes with multiple independent signals that would otherwise be ignored
in a traditional GWAS.
When choosing a gene-level method for the secondary
analysis of GWAS, it is important to take into consideration how the results will be used. If the goal of the investigator is to generate an all-inclusive list for low cost
follow-up, the sensitivity should be maximized with less
regard to the specificity or proportion of false positives,
such as with the Truncated Product Method. If instead
the goal of the investigator is to follow-up with a highcost experiment, it may be more important to minimize
false positives with Sidak’s Combination Test. However,
for the average investigator seeking to elucidate loci that
are below a genome-wide significance threshold but biologically relevant, it is likely that a balance of sensitivity
and specificity will be most useful. Of the gene-level
methods evaluated, VEGAS using only the top 10% of
SNPs within the gene region offers high sensitivity
(28.6%) with less than 1% false positives, while being
able to distinguish between multiple independent causal
loci and multiple signals due to linkage disequilibrium.
For the pathway-level programs, the underlying hypothesis for these methods is that multiple genes will be
associated with the phenotype, a true polygenic model,
and that these associated genes will be clustered in sets
of genes that have a biological relationship with one another. As hypothesized, these pathway methods found
enriched gene sets with a higher proportion of associated genes as compared to gene sets with a lower
Wojcik et al. BMC Genetics (2015) 16:34
proportion of associated genes. The methods that ignored genic architecture and collapsed all SNPs within
the genes into a single pathway unit (SRT, PST) had the
lowest correlations with the proportion of causal genes.
These methods test for the joint association of SNPs
within the gene set and not necessarily the enrichment
of associated genes within a gene set. However, these
methods and the Modified Generalized Fisher’s Method
(MFGM) are the only methods suited to handle allelic
heterogeneity. Other methods assign the gene-level Pvalue as the minimum SNP P-value found in the genic
region, ignoring the relevance of additional independent
signals within this region.
Three methods clustered together based on their results (GSA-SNP, GenGen, and MAGENTA), showing
high correlation between the proportion of causal genes
and the ranking of gene sets. As they are all competitive
methods that do not depend upon a pre-defined distribution, but rather the relative enrichment of the gene
set compared to all other genes evaluated, the rankings
may be more important than the absolute P-value. It is
important to note that when interpreting results, users
should not disregard results strictly based on a significance threshold but also examine rankings.
There are limitations with this analysis. The list of
programs evaluated is not exhaustive as it was curated
to reflect methods with publically available software
designed explicitly for GWAS. Therefore, it does not
include computationally intensive methods that would
be more appropriate for a smaller number of candidate
genes or gene sets, such as Gamma Method (GM) approaches [7] for self-contained gene sets and other
principal components-based approaches [8] for genes.
The evaluated methods were all scalable to genomewide datasets, provided the researcher has access to
high-performance computing resources. An additional
limitation inherent in all simulation studies is that the
results are dependent upon the model and its assumptions. Additional repeated simulations were conducted
to assess the stability of the simulation model, as well
as the influence of significance thresholds. Estimates
were found to be stable across different simulations
(Additional file 1: Figures S7 and S8) and the relative
performance of methods was consistent using a range
of significance thresholds (Additional file 1: Tables S6–S8).
Another possible limitation is that the simulation model
assumes SNP associations will be independent from one
another and will follow a polygenic additive model. While
this is simplistic, an additive model is commonly assumed
when evaluating SNP associations in case–control GWAS
through regression. The gene-level methods’ results do not
depend on the overall distribution of associations, therefore
the extent of polygenicity is irrelevant. On the other hand,
the presence of polygenicity is vital to the use of pathway-
Page 6 of 9
level methods, which seeks numerous associated genes
within a pathway. In short, although the model is simplistic
and may not be entirely reflective of the true pathogenesis
of some complex traits, it is valid and should not influence
the relative performance of both gene- and pathway level
analyses for GWAS.
It is also important to keep in mind the respective limitations of the analytical methods themselves. Gene-level
methods seek to aggregate independent signals within a
gene. Their utility will depend upon the underlying genetic
architecture of specific diseases. If there is only one causal
SNP within the gene, these methods will not have increased power compared to a traditional GWAS. On the
other hand, if the hypothesis is that there are numerous independent moderate effect risk loci within a gene, these
methods will be able to aggregate them for statistical enrichment. Pathway-level methods for GWAS do not evaluate gene-gene interactions or pinpoint the downstream
effects of polymorphisms in a gene. Instead, these methods
offer a visualization of the data that did not reach genomewide significance but may be suggestive and biologically
relevant to the phenotype of interest. By determining
which pathways are enriched for signal within a GWAS,
candidate genes and regions are highlighted and may identify relationships between seemingly disparate phenotypes
that have a similar pathogenesis.
Conclusions
Gene- and pathway-level methods for genome-wide association studies remain useful tools for conceptualizing
GWAS results beyond the traditional SNP-level results
that require a strict significance threshold. Gene-level
methods will help elucidate multiple independent statistical signals in an easily interpretable manner by
highlighting specific genes. By examining the relative importance of different gene sets with the results, pathwaylevel methods may generate hypotheses for biological
processes involved in the phenotype of interest. Both
classes of methods offer researchers a more complete
understanding of their genome-wide association study
within a biological context.
Methods
Genotypic data
For the simulation we used the common controls from the
Wellcome Trust Case–control Consortium 2 (WTCCC2),
as per the WTCCC2 Data Access Agreement. Data from
the 1958 Birth Cohort (N = 2,930) and the National Blood
Service (N = 2,737) were previously genotyped using a custom Illumina 1.2 M SNP array [9]. Standard quality control
measures were used: genotyping missingness <5%, individual missingness <5%, minor allele frequency (MAF) > 1%,
Hardy-Weinberg equilibrium P-value > 10−5. Individuals were screened for cryptic relatedness and first-
Wojcik et al. BMC Genetics (2015) 16:34
Page 7 of 9
degree relatives were removed. The inbreeding coefficient F was estimated and individuals more than 5
standard deviations away from the mean were removed. Principal components analysis (PCA) was conducted to ensure a homogenous sample without
outliers using EIGENSTRAT [10]. PCA was conducted
using a subset of markers that were selected to be independent (maximum r2 cutoff of 0.05) using the program Plink [11]. Regions known to be ancestryinformative were removed (e.g. lactase, MHC) for
PCA. After employing quality control measures, the
final data set consisted of a total of 4,500 individuals
and 906,298 SNPs.
Genome-wide association analysis
Gene and pathway selection
Gene-level methods
Pathways were downloaded from the Molecular Signature
Database (MSigDB) for the Gene Ontology Biological Processes [12]. There were 825 processes identified and from
these a subset of 20 “pathways” were selected: 10 with
greater than the median size of 28 genes and 10 with less
than the median. From each selected pathway, a subset of
genes were categorized as causal. Within each group: 4
pathways had only 1 causal gene, 4 pathways had 20% of
their genes designated causal and 2 pathways had 50%
causal genes. Genes were removed from the causal gene
list if they were in numerous pathways. The number of
causal SNPs and the effect size was varied by gene. Causal
SNPs were selected by identifying independent SNPs
(maximum pairwise r2 of 0.2) within the genic region
and the 20 kilobase (kb) flanking regions using the
program Tagger [13]. From these independent SNPs in
these gene regions, a subset of 1, 2, or 5 causal SNPs
were selected. A 20 kb flanking region was used to define
the gene region based on prior evidence that only 5% of
eQTLs lie further than 20 kb away from the transcription
start site (TSS) [14]. All SNPs within a gene were assigned
the same effect size: an odds ratio (OR) of 1.2 (small) or
2.0 (larger). This resulted in 602 causal SNPs from 226
genes in 20 pathways (Additional file 1: Figure S1).
Phenotype simulation
The genotypes for the 602 causal SNPs were converted to
an additive format by the number of minor alleles per person. The allele dosage was then multiplied by the logtransformed odds ratio assigned to a particular gene to be
consistent with logistic regression assuming an additive
model. Genotypic scores were summed across all locations
per individual to generate a liability score, which was then
standardized. This liability score represented the additive
effects from all causal SNPs. From these liability scores an
individual was assigned case/control status using a binomial distribution (Additional file 1: Figure S2). The simulation was designed to have an equal number of cases and
controls (n = 2,250).
The test of association was performed for an additive
model using an unadjusted logistic regression in Plink
[11]. The genome-wide threshold for significance was
a P-value < 5×10⁻⁷ (Additional file 1: Figures S3 and
S4). To evaluate the performance of methods in a
smaller sample size (n = 500), a random subset of individuals was selected and analyzed. Additionally, we
evaluated the efficiency of the model by simulating
the phenotype 100 times for a subset of 20 “causal”
SNPs to create a distribution of simulated effect sizes
(Additional file 1: Figure S7). The original simulation
was consistent with this distribution.
A total of 11 methods from three categories were evaluated
in the gene-level simulation. For the Classical Methods we
evaluated the Fisher’s Combination Test (FCT), Sidak’s
Combination Test (SCT), Simes’ Test (ST) and the False
Discovery Rate (FDR) Correction [15]. For the Updated
Classical Methods we evaluated a Truncated Product
Method (TPM) [16], as well as the GATES (weighted and
unweighted) and HYST (weighted and unweighted)
methods [17,18]. For the Novel methods we evaluated
VEGAS using all SNPs and using only the top 10% of associated SNPs [19]. Detailed descriptions of these methods
are in the Additional file 1.
Pathway-level methods
We evaluated 10 pathway-level methods: Meta-Analysis
Gene-set Enrichment of variaNT Analysis (MAGENTA)
[20], Plink Set Test [11], Gene Set Analysis for SNPs
(GSA-SNP) [21], Gene Set Enrichment Analysis for SNP
data (GSEA-SNP) [22], Gene Set Ridge Regression in
Association Studies (GRASS) [23], Association List Go
AnnoTatOr (ALIGATOR) [24], GenGen [25], Hybrid
Set-Based Test for Genome-wide Association Studies
(HYST) [18], a Modified Generalized Fisher’s Method
(MGFM) [26], and SNP Ratio Test (SRT) [27]. Detailed
descriptions of these methods are in the Additional
file 1. Methods were divided into two categories: competitive (ALIGATOR, MAGENTA, GSA-SNP, GSEA-SNP,
GenGen, MGFM, and SRT) and self-contained (GRASS,
HYST, PST). All methods allow the user to define the assignment of SNPs to genes, which were assigned to the
translated region and 20 kb flanking regions.
Evaluation
Gene
For gene-level analyses, a p-value threshold of 0.001 was
used to determine statistical significance for all analyses.
True positive genes were genes on the original causal
gene list within the simulation, and had at least one SNP
Wojcik et al. BMC Genetics (2015) 16:34
with a P-value < 0.01 to ensure that true positive genes
had signal on a SNP-level. Due to the stochastic element
of the simulation, not all genes contributed equally to
the liability score. The true negative genes were those
not within 50 kb of any causal genes. This resulted in 49
true positive and over 17,000 true negative genes that
were used to measure the proportion of false negatives
and false positive results. This differs from a type I error
(false positive) rate because only one simulation was
conducted, preventing repeated testing of the same null
hypothesis. Sensitivity and specificity were measured
using the 49 true positive genes and a randomly selected
subset of 50 true negative genes to prevent inflation of
cell size. Sensitivity was calculated as the proportion of
“true positive” genes with P < 0.001. Specificity was calculated as the proportion of the “true negative” genes
with P > 0.001. A number of thresholds were used to calculate sensitivity, specificity, and proportion of false positives, ranging from a baseline of 0.001 to a stringent
Bonferroni correction of 0.05/17,000 (2.9E-0.6). The relative
performance of methods remained consistent across different P-value thresholds. (Additional file 1: Tables S6–S8).
For a subset of gene-level programs (VEGAS, Fisher’s Combination Test), the entire simulation was conducted 10
times to assess the stability of the simulation. The proportion of false positives and the specificity were found to be
extremely stable (Additional file 1: Figure S8). To address
potential biases, sensitivity was recalculated with genes
stratified by their simulated effect sizes or by the number of
causal SNPs within a gene. The effect of gene size, SNP
density, the proportion of causal SNPs to all SNPs in a
gene, the number of causal SNPs, and the proportion of
causal SNPs to the physical gene size were all evaluated
regressing the accuracy of results with being true negatives
or positives on these factors.
Pathway
For the pathway-level analyses, there were a small number
of evaluated pathways with causal genes. While pathways
were simulated to have a certain percentage of causal
genes, the true causal genes were genes within the pathways that had at least one SNP with a P-value <0.01.
Therefore, 5 out of the 20 pathways had no causal genes
and are annotated as such (Additional file 1: Table S3). A
qualitative analysis was conducted examining the relationship between % causal genes and statistical significance as
evaluated by the P-values from the analysis. Because many
of the methods are competitive, the relationship between
the percentage of causal genes and the rankings of the
pathways was evaluated. Only the 10 larger pathways were
used for the estimation of correlation with the percentage
of causal genes to avoid an overrepresentation of pathways
without any causal genes (null gene sets). All correlations
were estimated using Pearson’s correlation. While only the
Page 8 of 9
results for a subset of the pathways are presented, the entire MSigDB Gene Ontology Biological Processes set was
evaluated for all competitive methods.
Sensitivity to model selection
The simulation schematic assumes a normally distributed
underlying liability score within the general population. By
sampling 1:1 cases and controls, it assumes a 50% phenotypic prevalence. Because this may not be realistic for many
GWAS, additional phenotypic simulations were conducted
to compare the relative performance of a population with
14% prevalence (fewer cases than controls) both in a casecohort (633 cases compared to 3,867 controls) as well as
case–control (633 cases, 633 controls) study design. Fisher’s
combination test (FCT) and VEGAS using the top 10% of
SNPs were used to evaluate the data for consistency. Relative performance was found to be similar to the original
analysis with 50% prevalence (Additional file 1: Table S5).
Additional file
Additional file 1: Supplementary Tables and Figures.
Abbreviations
SNP: Single Nucleotide Polymorphism; GWAS: Genome-wide Association Study.
Competing interests
The authors declare that they have no competing interests.
Authors’ contributions
GW and PD conceived of the study. GW, PD, and WK participated in its
design and coordination. GW conducted all analyses. GW, PD, and WK were
involved in the drafting of the manuscript. All authors read and approved
the final manuscript.
Acknowledgements
We acknowledge funding and support from the Bill and Melinda Gates
Foundation (PD) and the National Institutes of Health, EYE02-1531 (PD). This
study makes use of data generated by the Wellcome Trust Case–control
Consortium. A full list of investigators who contributed to the generation of
the data is available from www.wtccc.org.uk. Funding for the project was
provided by the Wellcome Trust under award 076113, 085475, and 090355 [9].
Received: 28 October 2014 Accepted: 19 March 2015
References
1. Hindorff LA, Sethupathy P, Junkins HA, Ramos EM, Mehta JP, Collins FS, et al.
Potential etiologic and functional implications of genome-wide association loci
for human diseases and traits. PNAS. 2009;106:9362–7.
2. Vineis P, Pearce N. Missing heritability in genome-wide association study
research. Nat Rev Genet. 2010;11:1.
3. McCarthy MI, Abecasis GR, Cardon LR, Goldstein DB, Little J, Ioannidis JPA,
et al. Genome-wide association studies for complex traits: consensus, uncertainty
and challenges. Nat Rev Genet. 2008;9:356–69.
4. Fridley BL, Biernacka JM. Gene set analysis of SNP data: benefits, challenges,
and future directions. Eur J Hum Genet. 2011;19:837–43.
5. la Cruz DO, Wen X, Ke B, Song M, Nicolae DL. Gene, region and pathway
level analyses in whole-genome studies. Genet Epidemiol. 2010;34:222–31.
6. Stranger BE, Stahl EA, Raj T. Progress and promise of genome-wide association
studies for human complex trait genetics. Genetics. 2011;187:367–83.
7. Biernacka JM, Jenkins GD, Wang L, Moyer AM, Fridley BL. Use of the gamma
method for self-contained gene-set analysis of SNP data. European Journal
of Human Genetics. 2011;20:565–71.
Wojcik et al. BMC Genetics (2015) 16:34
8.
9.
10.
11.
12.
13.
14.
15.
16.
17.
18.
19.
20.
21.
22.
23.
24.
25.
26.
27.
Page 9 of 9
Gauderman WJ, Murcray C, Gilliland F, Conti DV. Testing association
between disease and multiple SNPs in a candidate gene. Genet Epidemiol.
2007;31:383–95.
Burton PR, Clayton DG, Cardon LR, Craddock N, Deloukas P, Duncanson A,
et al. Genome-wide association study of 14,000 cases of seven common
diseases and 3,000 shared controls. Nature. 2007;447:661–78.
Price AL, Patterson NJ, Plenge RM, Weinblatt ME, Shadick NA, Reich D.
Principal components analysis corrects for stratification in genome-wide
association studies. Nat Genet. 2006;38:904–9.
Purcell S, Neale B, Todd-Brown K, Thomas L, Ferreira MAR, Bender D, et al.
PLINK: A Tool Set for Whole-Genome Association and Population-Based
Linkage Analyses. Am J Hum Genet. 2007;81:559–75.
Subramanian A, Tamayo P, Mootha VK, Mukherjee S, Ebert BL, Gillette MA, et al.
Gene set enrichment analysis: a knowledge-based approach for interpreting
genome-wide expression profiles. Proc Natl Acad Sci. 2005;102:15545–50.
de Bakker PIW, Yelensky R, Pe’er I, Gabriel SB, Daly MJ, Altshuler D. Efficiency
and power in genetic association studies. Nat Genet. 2005;37:1217–23.
Veyrieras J-B, Kudaravalli S, Kim SY, Dermitzakis ET, Gilad Y, Stephens M,
et al. High-resolution mapping of expression-QTLs yields insight into human
gene regulation. PLoS Genet. 2008;4:e1000214.
Peng G, Luo L, Siu H, Zhu Y, Hu P, Hong S, et al. Gene and pathway-based
second-wave analysis of genome-wide association studies. Eur J Hum
Genet. 2010;18:111–7.
Zaykin DV, Zhivotovsky LA, Westfall PH, Weir BS. Truncated product method
for combining P-values. Genet Epidemiol. 2002;22:170–85.
Li M-X, Gui H-S, Kwan JSH, Sham PC. GATES: a rapid and powerful genebased association test using extended Simes procedure. Am J Hum Genet.
2011;88:283–93.
Li MX, Kwan J, Sham PC. HYST: a hybrid set-based test for genome-wide
association studies, with application to protein-protein interaction-based
association analysis. Am J Hum Gen. 2012;7;91(3):478–88. doi:10.1016/j.
ajhg.2012.08.004.
Liu JZ, Mcrae AF, Nyholt DR, Medland SE, Wray NR, Brown KM, et al. A
versatile gene-based test for genome-wide association studies. Am J Hum
Genet. 2010;87:139–45.
Segrè AV, Groop L, Mootha VK, Daly MJ, Altshuler D. Common Inherited
Variation in Mitochondrial Genes Is Not Enriched for Associations with Type
2 Diabetes or Related Glycemic Traits. PLoS Genet. 2010;6(8):e1001058.
doi: 10.1371/journal.pgen.1001058.
Nam D, Kim J, Kim SY, Kim S. GSA-SNP: a general approach for gene set
analysis of polymorphisms. Nucleic Acids Res. 2010;38(Web Server):W749–54.
Holden M, Deng S, Wojnowski L, Kulle B. GSEA-SNP: applying gene set
enrichment analysis to SNP data from genome-wide association studies.
Bioinformatics. 2008;24:2784–5.
Chen LS, Hutter CM, Potter JD, Liu Y, Prentice RL, Peters U, et al. AR
TICLEInsights into Colon Cancer Etiology via a Regularized Approachto
Gene Set Analysis of GWAS Data. Am J Hum Genet. 2010;86:860–71.
Holmans P, Green EK, Pahwa JS, Ferreira MAR, Purcell SM, Sklar P, et al. AR
TICLEGene Ontology Analysis of GWA Study Data Sets Provides Insights into
the Biology of Bipolar Disorder. Am J Hum Genet. 2009;85:13–24.
Wang K, Li M, Bućan M. Pathway-based approaches for analysis of genomewide
association studies. Am J Hum Genet. 2007;81:1278–83.
Dai H. A modified generalized Fisher method for combining probabilities
from dependent tests. Frontiers in Genetics. 2014;5:1–10. Article 32.
O’Dushlaine C, Kenny E, Heron EA, Segurado R, Gill M, Morris DW, et al. The
SNP ratio test: pathway analysis of genome-wide association datasets.
Bioinformatics. 2009;25:2762–3.
Submit your next manuscript to BioMed Central
and take full advantage of:
• Convenient online submission
• Thorough peer review
• No space constraints or color figure charges
• Immediate publication on acceptance
• Inclusion in PubMed, CAS, Scopus and Google Scholar
• Research which is freely available for redistribution
Submit your manuscript at
www.biomedcentral.com/submit