Understanding rice adaptation to varying agro-ecosystems: Trait interactions and quantitative trait loci
Bạn đang xem bản rút gọn của tài liệu. Xem và tải ngay bản đầy đủ của tài liệu tại đây (2.13 MB, 14 trang )
Dixit et al. BMC Genetics (2015) 16:86
DOI 10.1186/s12863-015-0249-1
RESEARCH ARTICLE
Open Access
Understanding rice adaptation to varying
agro-ecosystems: trait interactions and
quantitative trait loci
Shalabh Dixit1, Alexandre Grondin1,3, Cheng-Ruei Lee2,4, Amelia Henry1, Thomas-Mitchell Olds2
and Arvind Kumar1*
Abstract
Background: Interaction and genetic control for traits influencing the adaptation of the rice crop to varying
environments was studied in a mapping population derived from parents (Moroberekan and Swarna) contrasting
for drought tolerance, yield potential, lodging resistance, and adaptation to dry direct seeding. A BC2F3-derived
mapping population for traits related to these four trait groups was phenotyped to understand the interactions
among traits and to map and align QTLs using composite interval mapping (CIM). The study also aimed to identify
QTLs for the four trait groups as composite traits using multivariate least square interval mapping (MLSIM) to further
understand the genetic control of these traits.
Results: Significant correlations between drought- and yield-related traits at seedling and reproductive stages
respectively with traits for adaptation to dry direct-seeded conditions were observed. CIM and MLSIM methods
were applied to identify QTLs for univariate and composite traits. QTL clusters showing alignment of QTLs for
several traits within and across trait groups were detected at chromosomes 3, 4, and 7 through CIM. The largest
number of QTLs related to traits belonging to all four trait groups were identified on chromosome 3 close to the
qDTY3.2 locus. These included QTLs for traits such as bleeding rate, shoot biomass, stem strength, and spikelet
fertility. Multivariate QTLs were identified at loci supported by univariate QTLs such as on chromosomes 3 and 4 as
well as at distinctly different loci on chromosome 8 which were undetected through CIM.
Conclusion: Rice requires better adaptation across a wide range of environments and cultivation practices to adjust
to climate change. Understanding the genetics and trade-offs related to each of these environments and
cultivation practices thus becomes highly important to develop varieties with stability of yield across them. This
study provides a wider picture of the genetics and physiology of adaptation of rice to wide range of environments.
With a complete understanding of the processes and relationships between traits and trait groups, marker-assisted
breeding can be used more efficiently to develop plant types that can combine all or most of the beneficial traits
and show high stability across environments, ecosystems, and cultivation practices.
Keywords: Rice, Drought, Yield, Lodging, Direct seeding, QTL
* Correspondence:
1
International Rice Research Institute, DAPO Box 7777, Metro Manila,
Philippines
Full list of author information is available at the end of the article
© 2015 Dixit et al. This is an Open Access article distributed under the terms of the Creative Commons Attribution License
( which permits unrestricted use, distribution, and reproduction in any medium,
provided the original work is properly credited. The Creative Commons Public Domain Dedication waiver (http://
creativecommons.org/publicdomain/zero/1.0/) applies to the data made available in this article, unless otherwise stated.
Dixit et al. BMC Genetics (2015) 16:86
Background
Rice growing environments are highly diverse and are affected by fluctuations in environmental conditions during crop growth. Water shortages due to climate change,
increased competition for fresh water from industries
and domestic usage, and increasing labor and fertilizer
costs threaten the sustainability of the transplanted system of rice cultivation [1–3]. With reduced water availability, rice cannot be kept flooded for its entire duration
and field conditions vary frequently from anaerobic to
aerobic across the season. Such situations demand a better adaptation of rice to variable conditions. In a slow
but steady manner, rice is moving towards adaptation to
new cultivation practices such as direct seeding (in nonpuddled and puddled soil), alternate wetting and drying,
and non-puddled transplanted rice cultivation systems
which are likely to be predominant in the future. While
such water-saving technologies have their benefits, there
are several associated risks. For example, shifting rice
cultivation from continuous flooding to variable anaerobic to aerobic cycles affects yield. This is primarily due
to the exposure of the crop to mild water stress [4] and
due to the reduced nutrient uptake under non-flooded
aerobic conditions [2]. Rice varieties specifically developed for flooded transplanted conditions show variable
degrees of yield decline, depending upon the period during which they are exposed to non-flooded aerobic conditions. Apart from this, aerobic conditions lead to other
problems such as non-uniform establishment and increased weed pressure. Irregular shifts from anaerobic to
aerobic conditions require rice roots to adapt quickly to
maintain water and nutrient uptake and utilization.
Under such frequently changing conditions, traits related
to early and uniform establishment, maintenance of
growth rate at vegetative stage, and efficiency to successfully complete the reproductive and grain-filling phase
determine the yield stability. Along with this, traits such
as yield potential and resistance to lodging also play a
role in determining yield stability by ensuring higher
yield and minimum yield loss.
To adapt to such variable conditions, ideally the plant
should possess a combination of morpho-physiological
traits such as high yield potential, early and uniform
emergence, better weed competitiveness, and lodging resistance [2]. Apart from this, root traits leading to better
water and nutrient uptake, tolerance to mild to moderate drought, and resistance/tolerance to prevalent biotic
stresses also play a crucial role. Recent studies have
examined the adaptation of rice to aerobic conditions
[5–9], yield and yield-related traits [10–13], and lodging
resistance [14, 15]. These studies provide detailed accounts of targeted traits, and the majority of them target
the trait groups separately. However, understanding the
genetic control of adaptability and productivity of rice
Page 2 of 14
across variable environments and cultivation practices
demands a more elaborate approach. Morphological
characteristics that may appear unrelated at the phenotypic level may be affected by the same or related
physiological response or may have related genetic control. Studying a wide range of factors affecting different
morphological and adaptive characteristics can provide
better insight into these interactions. Genomic regions,
particularly those that affect a wide range of traits, also
need to be identified for use in marker-assisted breeding.
To address these aspects collectively, this study was conducted to describe the relation and the genetic basis of
four diverse trait groups: drought tolerance, yield potential, lodging resistance, and adaptation to direct seeding,
their interactions and the genetics behind them on a
mapping population derived from two parents that are
contrasting in all four trait groups. Component traits
were studied individually and as composite traits to provide a clearer understanding of the genetic control of
rice adaptation to varying environments. The study identified major QTLs and QTL clusters related to these
traits using composite interval mapping (CIM) and
multivariate least square interval mapping (MLSIM) to
identify loci that affect the four trait groups as composite traits and determine the proportion of effect of each
component trait to the multivariate QTLs.
Results
Parental diversity
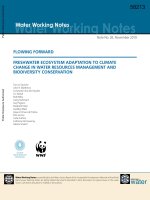
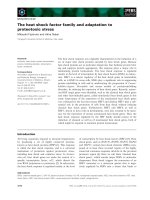
The cultivars Moroberekan and Swarna showed high
contrast for plant type and other key traits that determine performance in terms of the four trait groups
considered in this study (Fig. 1). Additional file 1 presents the differences between Moroberekan and Swarna
for some of the key traits that determine the morphology and yield of rice under varying environmental
conditions. Swarna, being the high-yielding parent,
showed higher values for yield and for traits related to
yield potential such as tiller and panicle number in all
three environmental conditions (well-watered, drought,
and direct-seeded). However, the higher tolerance of
Moroberekan to drought allowed it to maintain higher
spikelet fertility compared to Swarna under severe
drought stress. The yield decline under drought stress
(compared to the non-stress treatment) in Swarna was
much higher as compared to Moroberekan, showing the
higher susceptibility of Swarna to drought. Swarna
showed quicker emergence and a higher number of
nodal roots while Moroberekan showed a higher percentage of deep roots under lowland drought at maturity. However, Swarna showed higher root mass density
at shallow depths and Moroberekan showed higher stem
diameter and sturdiness.
Dixit et al. BMC Genetics (2015) 16:86
Page 3 of 14
S
S
M
A
S
M
C
B
S
S
M
M
S
M
M
S
M
D
E
F
Fig. 1 Morphological differences between rice cultivars Swarna (S) and Moroberekan (M). a Plant type, tiller and panicle number; b Stem
diameter (first to fourth internode from the bottom); c Root architecture at seedling stage; d Flag leaf length and width. e Panicle architecture
and grains per panicle; f Grain type and size
Phenotypic variation within the progeny
The phenotypic variation among the parents was transferred to the progeny and significant genetic variation
for a large proportion of traits studied under each trait
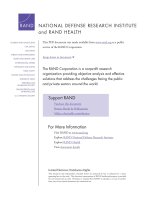
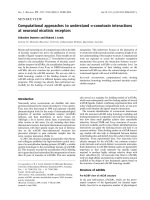
group was observed. Significant differences among the
progeny for 64–100 % of the traits were observed for the
different trait groups (Fig. 2). Additional files 2, 3, 4 and
5 present the results of the analysis of variance
(ANOVA) conducted for all experiments. In the three
experiments conducted under lowland drought, a higher
yield decline for parents and progenies was observed in
Experiment 1A as compared to 1B and 1C. The progenies showed significant variation for all traits except for
Normalized Difference Vegetation Index (NDVI), reduction of NDVI, root mass density, and percentage deep
roots for which consistency in significance was not observed across the three maturity groups (Additional file 2).
The progeny means ranged between the parent means or
were equal to one of the parents for most traits except for
some traits such as bleeding rate (in Experiment 1A and
1B), root mass density at 15–30 cm (in Experiment 1A),
and days to flowering (in the three experiments). Under
well-watered lowland conditions (Experiment 2), significant variation for all traits except spikelet fertility was observed (Additional file 3). The specificity of significance of
variation for spikelet fertility under drought stress showed
the higher level of tolerance to drought of Moroberekan
over Swarna. Similar to the stress conditions, the progeny
mean of the majority of the traits ranged between the
two parents or were equal to one of the parents with the
exception of days to flowering which stayed lower than
both parents (Additional file 3). For lodging-related
traits, significant differences were observed for all traits
under both lowland and upland well-watered conditions
(Additional files 3 and 4). The progeny means were
intermediate for traits such as plant height, stem diameter, and stem strength with Moroberekan on the higher
and Swarna on the lower side. These three traits played
a crucial role in determining the resistance to lodging of
the progeny with dwarf plant stature, larger stem
Dixit et al. BMC Genetics (2015) 16:86
Page 4 of 14
Percentage of traits showing significant variation
120
100
100
89
85
80
64
60
40
20
0
Drought tolerance
Yield potential
Lodging resistance
Trait Groups
DSR adaptation
Fig. 2 Percentage of traits showing significant variation in ANOVA across the four trait groups
diameter, and higher stem strength leading to higher resistance to lodging. The population was also screened
under upland dry direct-seeded conditions to determine
their adaptation to direct seeding (Experiments 3 and 4).
Under well-watered upland conditions, significant variations for all traits except spikelet fertility were observed
(Additional file 4). However, under seedling stage drought
conditions, significant differences for early and uniform
establishment were not observed (Additional file 5).
Trait correlations and interaction between trait groups
Correlations among the traits belonging to the four different trait groups are presented in Additional file 6. The
analysis showed higher levels of correlations within trait
groups as compared to those across trait groups. In general, higher levels of correlation were observed between
traits related to yield potential, lodging resistance, and
adaptation to direct seeding while drought tolerancerelated traits showed lower correlation with the other
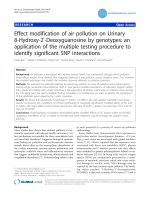
three trait groups. The multidimensional scaling (MDS)
analysis divided the traits into three distinct clusters based
on the correlations between them (Fig. 3). Cluster 1 specifically constituted of drought-related traits, cluster 2
contained most of the lodging-related traits and some
traits related to yield potential and adaptation to direct
seeding, and cluster 3 contained correlated traits across all
four trait groups. Most of the traits related to adaptation
to direct seeding belonged to this cluster. Interestingly,
some of the root-related traits measured under drought
stress grouped with cluster 3, showing the importance of
these traits under direct-seeded conditions. Principal
component analysis (PCA) was conducted to further
examine the relationships among traits. The first two
components together explained 22.7 % of the genetic trait
variation, showing a mild level of genetic correlation
among the traits (Fig. 4). Components 1–8 together explained 50.1 % of the variation while components 1–20
explained 75.5 % of the variation (Additional file 7). This
can be attributed to the large number and diversity of
traits. The PCA may explain higher percentage variations
if traits belonging to each trait group are analyzed separately. However, analyzing them together allowed us to
view the pattern of arrangement for all four trait groups
simultaneously on PC1 and PC2. The PCA further resolved the trait groups along the two axes, and a clearer
grouping of traits within each trait group was observed.
The progenies were distributed almost evenly across the
four quadrants; however, a large difference in the positioning of parents Moroberekan and Swarna was observed,
where Moroberekan was at the positive side of the two
axes and Swarna was at the negative side. In order to further understand the effect of the individual traits on yield
stability across lowland drought stress and non-stress and
direct-seeded non-stress conditions, we calculated the percentage difference for each trait for 25 lines with highest
mean yield and 25 with lowest mean yield across the three
experiments (Additional file 8). Differences ranged from
positive to negative in the trait groups except for traits related to yield potential where high-yielding lines had
higher means for all traits. The analysis also showed the
magnitude and direction of effect of different traits on
yield stability across ecosystems. While the two groups of
Dixit et al. BMC Genetics (2015) 16:86
Page 5 of 14
0.4
Cluster 2
Cluster 1
0.3
0.2
MDS 2
0.1
0
-0.1
Cluster 3
-0.2
Traits related to drought tolerance
Traits related to yield potential
Traits related to lodging resistance
Traits related to adaptation to direct seeding
-0.3
-0.4
-0.5
-0.4
-0.3
-0.2
-0.1
0
MDS 1
0.1
0.2
0.3
0.4
0.5
Fig. 3 Multi-dimensional scaling (MDS) analysis conducted using the correlation matrix of 66 traits belonging to the four different trait groups
30.0
25.0
20.0
15.0
PC2 (10.1%)
10.0
5.0
0.0
-5.0
-10.0
Moroberekan
-15.0
Swarna
-20.0
Traits related to yield potential
Traits related to drought tolerance
-25.0
-30.0
-25.0
Traits related to lodging resistance
Traits related to adaptation to direct seeding
-20.0
-15.0
-10.0
-5.0
0.0
PC1(12.6%)
5.0
10.0
15.0
20.0
25.0
Fig. 4 PCA on trait correlations in parents and progeny for the four trait groups. Gray dots represent the genetic means of each progeny; Red
and green circles represent means for Swarna and Moroberekan, respectively. Crosses (color coded as presented in the legend) indicate the
loadings for each trait along the first two components, which comprise 22.7 % of the total genetic variation for all traits
Dixit et al. BMC Genetics (2015) 16:86
lines were highly contrasting for some drought-related
traits such as bleeding rate, reduction of NDVI, and leaf:
stem ratio, they showed very little difference for the other
traits such as stem strength and stem diameter. However,
a large proportion of traits across these trait groups
showed intermediate level differences, indicating their importance in determining yield stability along with the traits
that showed larger differences.
Genetic analysis
CIM analysis with individual traits
A total of 49 QTLs were identified through CIM analysis
for the four trait groups (Additional file 9). The QTLs
were distributed across nearly all chromosomes with the
highest densities observed on chromosomes 3, 4, and 7
(Fig. 5). In particular, QTLs for traits across all four trait
groups were identified on chromosome 3 close to the
qDTY3.2 region. For the drought tolerance trait group,
QTLs were seen for traits related to drought and grain
yield. However, higher numbers of QTLs were identified
for drought-related traits as compared to yield-related
traits. QTL clusters were observed at chromosome 3 at
the qDTY3.2 region, including a QTL for grain yield
under drought. However, the yield-enhancing allele in
this case came from the susceptible parent. While this
QTL is known to affect the flowering time along with its
effect on grain yield under drought, the staggered seeding of the progeny from different maturity groups may
explain Swarna’s contribution of the yield-enhancing
allele at this locus. The advantage of having the
Moroberekan allele at this locus can be seen through its
effect on several other drought-related traits affecting
plant function (Additional file 9). Apart from chromosome 3, another QTL cluster was observed at chromosome 7 where root mass, sap from the root system, and
canopy temperature-related QTLs were identified
(Additional file 9, Fig. 5). Other QTLs on chromosome
1, 4, and 9 were identified for root mass density, nodal
root number, and panicle length at harvest. Similar to
drought tolerance, QTLs for traits related to yield potential were contributed by both parents. However,
QTLs for grain yield per se were not identified. The highyielding parent Swarna contributed to QTLs for number
of panicles and tillers at harvest on chromosomes 3 and 4,
respectively. It also contributed to two QTLs on chromosomes 3 and 12 for plant height. The donor parent Moroberekan also contributed to several QTLs related to yield
potential, including QTLs for shoot biomass, harvest
index, and panicle length. Two major QTL clusters were
identified on chromosomes 3 and 4 for traits related to
lodging resistance. QTLs for the two major lodgingrelated traits – stem strength and diameter – were also located in these QTL clusters. The QTLs on chromosome 3
were contributed by Swarna while those on chromosome
Page 6 of 14
4 were contributed by Moroberekan. Both QTL clusters
showed consistent effects on lodging- related traits under
upland direct-seeded and lowland transplanted conditions.
QTLs were also identified for traits related to adaptation
to direct seeding. In particular, QTLs for seedling emergence contributed by Moroberekan and Swarna were observed on chromosomes 1 and 3, respectively. Apart
from this, some of the yield-related QTLs identified
under transplanted lowland conditions also showed an
effect under direct-seeded conditions. These included
QTLs related to flowering time, plant height, and panicle length. A QTL for grain weight was also identified
on chromosome 10.
MLSIM analysis with composite traits
Unlike CIM, MLSIM allowed the identification of QTLs
for composite traits representing a group of individual
traits such as drought tolerance, yield potential, lodging resistance, and adaptation to direct seeding. A total of 3, 15,
8, and 12 multivariate QTLs (MVQTLs) were identified for
the four trait groups, respectively (Additional file 10). This
method identified QTLs in some of the locations identified
through CIM. For example, MVQTLs were identified on
chromosome 3 for almost all trait groups, close to the positions where QTL clusters were identified through CIM at
this locus. Similarly, chromosome 4 showed the presence
of MVQTLs for lodging resistance close to the QTL cluster
identified for the component traits at this locus. Furthermore, several other MVQTLs were observed for the four
trait groups at the locations where the QTLs were not
detected through CIM analysis (Fig. 5). In particular
MVQTL8.1 and/or MVQTL8.4 were observed consistently
across the four trait groups. However, the CIM analysis did
not detect these two loci with such high consistency. The
contribution of different traits to different MVQTLS was
also assessed through this analysis which can help select
these QTLs based on the traits affected for further
utilization in breeding programs (Fig. 6, Additional file 11).
This helped in the classification of QTLs into two specific
classes: (1) those influencing the majority of the traits (such
as MVQTL3.1 for drought tolerance and MVQTL3.1 and
MVQTL4.1 for lodging resistance), and (2) those influencing few specific traits (such as MVQTL2.1 for drought and
MVQTL2.2 for lodging resistance). While class 1 MVQTLs
were observed for the trait groups on drought tolerance
and lodging resistance, class 2 MVQTLs were observed
for the trait groups on yield potential and adaptation to
direct seeding.
Epistatic interactions
In addition to beneficial alleles contributed by both parents, epistatic interactions among loci may also be the
cause of transgressive segregation in the progeny. In this
study, epistasis was observed for all four trait groups,
Dixit et al. BMC Genetics (2015) 16:86
Page 7 of 14
Fig. 5 Circle plot showing the location of QTLs affecting single and composite traits identified through CIM and MLSIM analysis respectively.
Colored bars showing the twelve rice chromosomes form the outermost circle, marker names (starting with the term ‘id/wd/ud’ followed by the
number) and positions (cM) are presented along the chromosomes. Colored concentric circles sequentially from the center represent the QTLs
for drought tolerance (CIM), QTLs for drought tolerance (MLSIM), QTLs for yield potential (CIM), QTLs for yield potential (MLSIM), QTLs for lodging
resistance (CIM), QTLs for lodging resistance (MLSIM), QTLs for adaptation to direct seeding (CIM) and QTLs for adaptation to direct seeding
(MLSIM). Horizontal bars within the rings represent the QTL span while vertical lines represent the peak position. The intensity of color of QTL
bars shows the amount of variance explained by the QTL with color intensity increasing with QTL effect
particularly for traits related to lodging resistance and
adaptation to direct seeding. Interactions were seen for
stem diameter and shoot dry weight per plant for lodging resistance, and panicle length and first emergence
for adaptation to direct seeding. Epistatic interactions
were also observed for bleeding rate and biomass for
drought and yield potential, respectively. eQTL1.1,
eQTL3.1, and eQTL3.2 were the three most consistent loci
showing epistatic interactions with different loci across
the genome (Additional file 12).
Discussion
We studied traits related to drought tolerance, yield potential, lodging resistance and adaptation to direct
Dixit et al. BMC Genetics (2015) 16:86
Page 8 of 14
Drought tolerance
Yield potential
Lodging resistance
Adaptation to direct seeding
Fig. 6 Heat maps showing the relative contribution of univariate traits to major MVQTLs identified for the four composite traits
seeding to understand trait interaction, and mapping
and aligning QTLs. Traits were targeted individually and
in groups for statistical and genetic analysis with the aim
of understanding the basis of the rice crop’s adaptation
to varying environmental conditions to which it can be
exposed. The parents Moroberekan and Swarna proved
to be specifically suitable for studying such a wide range
of traits (Fig. 1). The high contrast among these two cultivars allowed us to achieve high variation in the mapping population for the majority of the traits (Fig. 2).
Rice is cultivated in a much wider range of environments compared to any other cereal crop. This has
allowed high genetic variation to develop in rice cultivars for a wide range of traits. Our study provides further evidence for this, where crossing two cultivars
provided substantial genetic variation in the population
for a wide range of related and unrelated traits.
The traits in this study grouped into three specific
clusters in MDS analysis based on their correlations
within and across trait groups (Fig. 3). PCA confirmed
these results, with Moroberekan and Swarna showing
high contrast and the four trait groups showing similar
patterns of arrangements as seen in the MDS analysis
along PC1 and PC2, indicating the correlation within
and across trait groups (Fig. 4). For example, traits related to adaptation to direct seeding showed correlations
with several yield potential-related traits, as well as some
traits related to drought tolerance. Such correlations indicate the interactions of plant type, phenology, yield potential, and drought tolerance to be affecting adaptation
to direct seeding. The most direct evidence to this was
the high positive correlation of grain yield under transplanted and direct-seeded non-stress conditions, and the
correlation of seedling emergence and relative growth
Dixit et al. BMC Genetics (2015) 16:86
rate under direct-seeded conditions with root and shoot
mass under drought. This pattern signifies that the specificity of traits required for efficient adaptation to direct
seeding varies at different growth stages of the crop. Further evidence of this comes from several recentlydeveloped drought-tolerant varieties that show better
adaptation to direct seeding compared to high-yielding
varieties developed specifically for irrigated conditions
[16]. While these varieties were developed through selection for yield under drought, combined with semi-dwarf
plant type and high yield, the effect of selection for traits
such as emergence and growth rate on adaptation to direct seeding is clear. Similarly, lodging-related traits
showed correlations with plant type and other yieldrelated traits under direct-seeded and transplanted nonstress conditions. This indicates the role of a much
wider range of traits in determining adaptation to lodging than traits that directly relate to it.
The trait interactions observed in the phenotypic analysis were also apparent in the QTL mapping. A QTL
cluster was detected for drought-related traits on
chromosome 3 which showed effects on a wide range of
traits across the four trait groups (Fig. 5). Independent
studies have shown the effect of this locus on traits such
as grain yield under drought, lodging resistance, and
yield- related traits [14, 17–19]. The locus also collocates
with HD9 which is a major gene for days to flowering.
In this study, QTLs for lodging-related traits like stem
diameter or stem strength and for drought tolerance
such as NDVI, canopy temperature and bleeding rate
were observed at this locus. Interestingly, grain yield correlated positively with NDVI but showed negative correlation with canopy temperature (Additional file 6).
Better maintenance of canopy cover (high NDVI) and
transpiration (related to low canopy temperature) are expected to be beneficial under drought and these traits
collocated with qDTY3.2 may indicate better ability to access soil water. Although no QTLs for root traits were
identified in this region, a positive correlation between
grain yield and root mass density at the soil depth of 45
to 60 cm was observed. In addition, a negative correlation was observed between grain yield and bleeding rate
which confirms earlier observations that droughttolerant rice lines generally display low bleeding rate
[20]. Apart from this, QTLs related to traits affecting
adaptation to direct seeding were also observed, confirming the effect of this locus on a number of traits.
Further, QTLs were contributed by both parents at this
locus for different traits, indicating the linkage of
drought-related genes at this locus. A high diversity of
genes related to plant function under biotic and abiotic
stresses has also been reported previously at this locus
[17, 18, 21]. Another QTL cluster, including a QTL for
root mass density at depth, canopy temperature, and
Page 9 of 14
absolute amount of sap, was detected on chromosome 7.
QTLs for root-related traits such as root thickness and
maximum root length have been reported previously
close to this locus [22, 23]. Similarly, a QTL cluster close
to a previously reported QTL for lodging resistance [14]
was detected on chromosome 4. These QTL clusters
could play an important role in improving rice for a
wide range of traits through targeted alleleic introgression using marker-assisted selection. Our study also included some important and relatively newly researched
traits related to drought such as canopy temperature
and NDVI. While these traits are being increasingly used
for high throughput phenotyping for drought tolerance
[24], knowing the QTLs underlying them can be important in understanding their genetic control. Similarly,
QTLs for new traits such as early and uniform emergence can be useful in improving crop establishment
under direct-seeded conditions.
We employed the composite trait approach for identification of QTLs affecting trait groups through MLSIM
analysis. This approach has been used successfully to
identify multivariate QTLs controlling root architecture
in rice [25]. Some of these QTLs co-localized with the
QTLs identified for individual traits through the CIM
analysis while some others were identified at distinct
new positions (Fig. 5). For example, MVQTLs for all
four composite traits were identified on chromosome 8
while few QTLs for individual traits were observed on
this chromosome. Hence the analysis allowed us to better explain the genetic control of these traits through
identification of regions that were undetected by singletrait-based approaches. In addition, the analysis also
allowed us to understand the effect of different traits on
different MVQTLs (Fig. 6). The distinct pattern of correlation of these QTLs with the underlying traits helps
in understanding their possible utilization in breeding
programs. Some of these QTLs that affect the majority
of the underlying traits need to be carefully used based
on the allelic influences on different underlying traits,
while the other QTLs with effects on specific traits can
be incorporated in breeding programs more easily for
marker-assisted selection. While transgressive segregants
were observed in the progeny, the presence of epistatic
interaction is apparent. Epistatic interactions were observed for traits related to all four trait groups in this
study. Epistasis has been reported previously for complex traits such as yield under drought stress [9, 17, 26]
and non-stress conditions [12], however those for
lodging-related traits (stem diameter in this case) have
not been reported in rice to the best of our knowledge.
The phenotypic and genetic analysis of our study focused not only on individual traits but also on trait
groups as a whole which enabled us to better understand
the basis of yield stability of the rice crop across different
Dixit et al. BMC Genetics (2015) 16:86
ecosystems. Alignment of QTLs for a wide range of traits
can also be achieved through meta-analysis; however most
studies of this nature have been dealing with traits related
to a particular target [21, 23, 27, 28]. Both the CIM and
MLSIM QTL mapping methods have allowed us to identify and align QTLs with effects on a wide range of traits
related to adaptation to multiple establishment and
growth conditions, which can provide an advantage to the
breeding programs targeting varying environments. This
study also allowed us to understand the interactions between traits belonging to four very distinct and important
trait groups that play crucial roles in the adaptation of rice
plants to varying environments. Results from this study
have allowed us to further understand the genetic and
physiological basis of adaptation of rice to a wide range
of environments.
Conclusion
Our study targeted traits belonging to four diverse trait
groups to understand correlations among these traits as
well as to detect and align QTLs for them. Significant
correlations between traits within and across trait groups
were observed. The study identified component traits
leading to better performance of genotypes under varying ecosystems and cultivation practices, and successfully identified and aligned QTLs on the rice genome
belonging to four trait groups and their component
traits. The highest numbers of QTLs were located on
chromosome 3. The QTLs identified in this study can be
used for targeted trait improvement following marker
assisted breeding to develop rice lines with wider
adaptation and yield stability across environments and
cultivation practices.
Methods
Plant materials
A mapping population of 250 BC2F3-derived lines developed from the cross Moroberekan/3* Swarna was used
in this study. Moroberekan, the tolerant donor, is an upland- adapted tropical japonica [29] landrace from New
Guinea. It is a long-duration cultivar with sturdy plant
type, deep roots, and is tolerant to drought and rice
blast. However, this variety has poor yield potential because of its low tillering ability and lower number of
grains per panicle. On the other hand, Swarna (MTU
7029), the drought-susceptible recipient parent, is a
lowland-adapted high-yielding indica variety [30, 31] derived from the cross Vashishtha X Mahsuri. It is a longduration semi-dwarf variety with high tillering ability
and grain yield. This variety is grown on a large area in
rainfed and irrigated ecologies across India, Nepal, and
Bangladesh and is regarded as a mega-variety of rice.
Page 10 of 14
Experimental conditions and field management
Four field experiments were conducted in upland and
lowland conditions at the experiment station of the
International Rice Research Institute (IRRI), Los Baños,
Laguna, Philippines (14°11′N, 121° 15′E) in the dry season
(DS) and wet season (WS) of 2013 (Additional file 13).
Throughout the study, the term ‘upland’ is used for field
experiments conducted under direct-seeded, non-flooded,
aerobic conditions while the term ‘lowland’ refers to field
experiments conducted under flooded, puddled, transplanted and anaerobic conditions. Experiment 1 (1A, 1B,
and 1C) was conducted under reproductive-stage drought
stress conditions with early-, medium-, and late-maturing
lines, respectively, due to heterogeneity in maturity duration in the population and with the aim of applying
drought stress at the reproductive stage. Experiments 2
and 3 were conducted under non-stress conditions in lowland and upland, respectively, and Experiment 4 was conducted under upland seedling-stage drought stress.
Experiments 2–4 were conducted with the full set of 250
lines and had no groupings based on maturity. All experiments were conducted in an α lattice design with three
replicates each for Experiments 1 and 2 and two replicates
each for Experiments 3 and 4 (Additional file 13).
In the lowland experiments, lines were grown in a wet
bed nursery for 21 days before being transplanted in
fields that were kept well-watered up to a month after
transplanting. A spacing of 20 and 25 cm was maintained between plants and rows, respectively, with two
to three seedlings transplanted per hill. In the upland
experiments, lines were direct seeded in non-puddled
soil at a density of 2.0–2.5 g m−1 and a depth of approximately 3 cm with a row spacing of 25 cm. Fields
were sprinkler-irrigated to initiate seed germination and
were surface-irrigated starting at one week after seedling emergence to maintain lowland-like conditions. All
control treatments were irrigated 2–3 times per week
throughout the crop duration. The stress experiments
were also irrigated 2–3 times per week during crop establishment and early vegetative growth, and the
drought stress treatment was initiated by withholding
irrigation starting from 45 to 75 days after sowing
(DAS), depending on the maturity group (Additional
file 13). In Experiment 4, no irrigation was provided up
to 21 DAS, after which full emergence was observed in
all plots. The field was then re-irrigated and maintained
well-watered until crop maturity. Complete fertilizer
(14-14-14) was applied 13 days after transplanting in
Experiments 1 and 2 (both the stress and control treatments) at a rate of 45 kg NPK ha−1, and a second application as topdressing was made before panicle initiation
using ammonium sulfate at a rate of 45 kg N ha−1. Experiment 3 received 45 kg NPK ha−1 at 7 DAS, followed
by topdressings of 45 kg N ha−1 on 34 and 38 DAS. No
Dixit et al. BMC Genetics (2015) 16:86
fertilizer was applied to Experiment 4. Manual weeding
was done regularly in all experiments.
Phenotypic data collection
Traits related to drought tolerance (27 traits), yield potential (9 traits), lodging resistance (8 traits), and adaptation to
direct seeding (22 traits) were recorded (Additional file 14).
Trait group 1: drought tolerance
Traits related to the ability to maintain shoot and root
growth, water uptake, flowering, and grain yield under
drought were classified in Trait group 1: Drought tolerance. These traits were recorded under lowland reproductive stage drought-stress conditions (Experiments 1A–C).
Shoot growth and groundcover dynamics were monitored according to NDVI measured around mid-day
using a Greenseeker Hand-held Sensor (NTech Industries, CA, USA). Canopy temperature was measured at
three locations per plot using a hand-held data-logging
infrared (IR) sensor (Apogee Instruments, Logan UT,
USA) after stress initiation. The increase in canopy
temperature throughout the stress period was calculated
as the slope (X) of the following equation:
CT ẳ ICT X d ị ỵ b
where, CT is the canopy temperature, ICT is the increase in canopy temperature, d is the days after stress
initiation, and b is the y intercept.
Root samples were taken 2–3 days after re-watering
following severe stress symptoms at the grain-filling
stage using a 4 cm-diameter core sampler (fabricated at
IRRI, Los Baños, Philippines) to a depth of 60 cm. Soil
cores were divided into 15-cm segments, and roots were
washed by repeatedly mixing the soil with water in a
container, and pouring the root-water suspension over a
1-mm plastic sieve. Only roots identified as living rice
roots were retained for measurement. All samples were
dried and weighed. Root mass density was calculated as
the root mass per 15-cm soil core segment divided by
the volume of the soil core segment. Percentage of deep
roots was calculated as the mass of roots in the core
below 30 cm divided by the total mass of roots inside
the core. Bleeding rate measurements were carried out
as described by Morita and Abe [32] and measured at
mid-stress when soil water tension fell below −30 kPa.
Sap exuded from the root zone was quantified in one hill
per plot in both control and drought treatments. Starting at 7:00 am, shoots were cut at ~15 cm from the soil
surface, and cut stems connected to the undisturbed
root system were wrapped in a 625 cm2 cotton towel,
then covered with a polyethylene bag, sealed at the base
with a rubber band, and left for 4 h to absorb xylem sap
that flowed from the cut stems. The towel, bag, and
Page 11 of 14
rubber band used for each hill were weighed before use.
After 4 h, the bags and towels were removed from the
stems, sealed, and immediately weighed to quantify the
bleeding rate from the intact root system. Leaves from
each hill were collected and kept inside a cold box for
leaf area measurement. Tiller number was counted and
leaves were separated from the stem and were dried and
weighed to determine the biomass and leaf:stem ratio at
mid-stress. In order to account for variation in plant size
within and among genotypes, all sap exudation values
were normalized by the dry shoot biomass of the hill
from which sap was collected to calculate the bleeding
rate. Specific leaf area was calculated as the leaf area,
measured using a roller-belt-type leaf area meter (LiCor, Model LI-3100C, Li-Cor, Lincoln, NE, USA) divided
by the leaf dry weight. Days to flowering (DTF) was recorded when about 50 % of the plants in the plot had
flowered. Plant height (PH) of three plants from each
plot was measured at maturity from ground level to the
tip of the tallest tiller and averaged to get the mean PH
for analysis. At physiological maturity, three hills were
sampled in each plot for the measurements of the yield
components including number of tillers and panicle,
panicle length (cm), spikelet fertility (%), 1000-grain
weight (gm) and rachis-stem-leaf dry weight (gm). Grain
yield was measured from a sampled area of 1.5 m2 and
dried to 14 % moisture content. The weight of grains
was then used to calculate the kg ha−1 yield for each plot
for further analysis.
Trait group 2: yield potential
Grain yield (kg ha−1) and yield-related traits such as
number of panicles and tillers at harvest, spikelet fertility
percentage (by weight), panicle length (cm), biomass
(kg ha−1), DTF and plant height (cm) were classified in
Trait group 2: Yield potential. These traits were recorded under lowland well-watered conditions (Experiment 2). The harvested area for grain yield was 1.5 m2.
Trait group 3: lodging resistance
Traits related to lodging resistance were measured under
lowland and upland non-stress conditions (Experiments
2 and 3, respectively). These included stem strength,
stem thickness, and fresh and dry weight per plant. Stem
strength was measured using the prostrate tester (Daiki
Rika Kogyou Co., Tokyo). All data were recorded from
three plants from each plot. At physiological maturity,
plants were cut off at 40 cm height, with the prostrate
tester set perpendicularly at the middle (20 cm), and the
pushing resistance of the lower part of the plant was
measured by pushing the plants to the point at which
the stem broke and the scale displacement (mm) due to
pushing resistance was recorded. The stem diameter was
measured from the same three plants at a height of
Dixit et al. BMC Genetics (2015) 16:86
40 cm using a screw gauge. The plants were then harvested from the base to measure fresh weight per plant
and then oven dried for three days at 70 °C and weighed
to estimate the dry weight per plant. Average values for all
parameters were calculated and used for further analysis.
Trait group 4: adaptation to direct seeding
Visual observations of the time (DAS) to first emergence
(when the first seedlings of a plot emerged) and full
emergence (most of the seedlings in each plot had
emerged) were recorded in the seed bed nursery of Experiment 1 and of the direct-seeded experiments (3 and
4). Shoots from five seedlings per plot were sampled at a
two-week interval (18 DAS and 32 DAS) to determine
the relative growth rate (RGR) in Experiment 2. Shoots
were dried and weighed to determine the biomass for
each sampling date and the RGR was calculated as:
RGR ẳ
ẵ lnB2ị lnB1ị
D2D1ị
Where, B2 is the shoot biomass on date 2, B1 is the
shoot biomass on date 1, D2 is date 2 and D1 is date 1.
In addition, grain yield and traits related to yield potential and phenology under direct-seeded conditions
such as DTF, panicle number at harvest, tiller number at
harvest, spikelet fertility, 1000-grain weight, and panicle
length were recorded in Experiment 3. The harvested
area for grain yield in Experiment 3 and 4 was 1 and
0.25 m2, respectively.
Statistical analysis
Statistical analysis for the computation of means and
standard error of difference (SED) were conducted using
CROPSTAT version 7.2.3. A mixed model analysis of
data from individual years was carried out using the
model:
À
yijk ẳ ỵ g i ỵ r j ỵ bk r j ỵ eijk
where yijk is the measurement recorded in a plot, μ is
the overall mean, gi is the effect of the ith genotype, rj is
the effect of the jth replicate, bk(rj) is the effect of the kth
block within the jth replicate, and eijk is the error. Genotypic effects were considered fixed and the replicates
and block effects were random.
Correlations between the traits were estimated using
the ‘cor’ function in R 3.1.0 [33]. For better visualization,
the distance matrix was calculated using the correlation
values between the traits and were used to conduct a
MDS analysis using STAR (version 2.0.1). To perform
PCA, all traits were first standardized to a mean of zero
and standard deviation of one, and missing values were
filled with zero (population mean). PCA was calculated
with the prcomp function in R [33].
Page 12 of 14
Genotypic data
Fresh leaves for all lines were collected and freeze-dried.
DNA was extracted from the freeze-dried leaf samples
by a modified CTAB method in deep-well plates. The
DNA was then quantified and purified and lines were genotyped using KASPar SNP assays. These SNPs were selected
as subsets from the set of 1536 and 44 K SNP chips [34,
35], converted to SNP assays and made available through
the integrated breeding platform (egrated
breeding.net/482/communities/genomics-crop-info/crop-in
formation/gcp-kaspar-snpmarkers). A total of 2015 SNP
markers were screened for polymorphism between the two
parents. Out of these 2015 SNPs, 591 polymorphic SNP
loci were identified. The genotypic data from a set of 193
polymorphic SNP markers was used to generate the genotypic profile of the population.
Genetic analysis
Composite interval mapping (CIM) was conducted
using QTL Network 2.1 [36] based on a mapping
methodology outlined by Yang et al. [37]. Putative regions within the QTLs were identified with this software based on a one-dimensional genome scan taking
selected candidate intervals as cofactors. A mixed linear model framework was used to perform the mapping procedure with an F-statistic based on Henderson
method III for hypothesis testing. A total of 1,000 permutation tests were used to minimize the genome-wise
type I error and to calculate the critical F-value. Apart
from the CIM analysis, MLSIM analysis using the procedure detailed in Anderson et al. [38] was also conducted to identify putative QTLs controlling multiple
traits simultaneously. Briefly, the QTL allele frequency
(Pqm) conditional on the flanking marker genotypes
for each point in the genome of each line was calculated. These Pqm values were then used as predictors
[39] for multivariate analysis of variance (MANOVA)
across the genome. Statistical significance was determined with randomization tests using 1,000 permutations. The identification of multiple QTLs was
conducted sequentially, each conditional on all previously identified QTLs until no further significant QTL
was found. To further understand QTL effects, a onedimensional ‘composite trait’ was also calculated for
each QTL by identifying the linear trait combination
best explained by QTL genotypes with discriminant
function analysis. Circle plot showing the chromosome
map and QTLs was developed using Circos [40].
Availability of supporting data
The data sets supporting the results of this article are included within the article and its additional files.
Dixit et al. BMC Genetics (2015) 16:86
Additional files
Additional file 1: Diversity of Moroberekan and Swarna for major
traits related to drought tolerance, yield potential, lodging
resistance, and adaptation to direct seeding.
Additional file 2: Analysis of variance table for lowland drought
stress experiments conducted with early (E), medium (M), and late
(L) duration lines including means of parents and progenies and
P values. NS: Non-significant, NA: Data not available, a: probability of
difference between genotypes *, **, ***, **** significant at 5, 1, 0.1, 0.01 %
P levels, respectively, NDVI: normalized difference vegetation index.
Additional file 3: Analysis of variance table for lowland
well-watered experiment including means of parents and progenies
and P values. NS: Non-significant, a: probability of difference between
genotypes *, **, ***, **** significant at 5, 1, 0.1, 0.01 % P levels,
respectively.
Additional file 4: Analysis of variance table for upland
well-watered experiments including means of parents and
progenies and P values. NS: Non-significant, a: probability of
difference between genotypes *, **, ***, **** significant at 5, 1, 0.1,
0.01 % P levels, respectively.
Additional file 5: Analysis of variance table for upland seedling
stage drought experiments including means of parents and
progenies and P values. NS: Non-significant, a: probability of difference
between genotypes *, **, ***, **** significant at 5, 1, 0.1, 0.01 %
P levels, respectively.
Additional file 6: Phenotypic correlation between 66 traits
studied across the four trait groups: drought tolerance, yield
potential, lodging resistance and adaptation to direct seeding.
Red and green colored cells represent values significant at 5 % and
1 % P levels respectively.
Additional file 7: Percentage variation explained by principal
components (PC) 1–65 in the population.
Additional file 8: Percentage difference between means of trait
values of 25 high and low yielding lines from the population. Traits
with red bars show higher values for low yielding lines while those with
blue bars show higher values for high yielding lines.
Additional file 9: QTLs for traits related to drought tolerance, yield
potential, lodging resistance and adaptation to direct seeding
identified through CIM in DS and WS 2013. A = additive effect,
R2 = percentage of phenotypic variance explained by the QTL.
Additional file 10: QTLs for composite traits drought tolerance,
yield potential, lodging resistance and adaptation to direct seeding
identified through MLSIM analysis. R2 = percentage of phenotypic
variance explained by the QTL.
Additional file 11: Contribution of univariate traits to MVQTLs
detected for the four composite traits. Names for each trait
(numbered) in this table can be found in Additional file 14.
Additional file 12: Epistatic interactions identified for traits related
to the four trait groups. AA: additive effect, R2: Phenotypic
variance explained.
Additional file 13: Details of experiments conducted in the 2013
DS and WS under lowland transplanted drought stress and
non-stress and upland direct-seeded drought stress and
non-stress conditions.
Additional file 14: Traits studied under the four trait groups
(drought tolerance, yield potential, lodging resistance, and
adaptation to direct seeding) with trait codes and ecosystems.
Abbreviations
CIM: Composite Interval Mapping; MLSIM: Multivariate Least Square Interval
Mapping; NDVI: Normalized Difference Vegetation Index; MDS: The
multidimensional scaling; PCA: Principal component analysis;
MVQTLs: Multivariate QTLs; SNP: Single nucleotide polymorphism;
MANOVA: Multivariate analysis of variance; RGR: Relative growth rate;
DS: Dry season; WS: Wet season.
Page 13 of 14
Competing interests
The authors declare that they have no competing interests.
Authors’ contributions
AK conceived the experiment. AK, SD, AH, AG designed the experiment. SD,
AG conducted the phenotyping of the mapping population, SD conducted
data analysis, drafted and revised the manuscript. AG contributed to data
analysis, drafting and revision of the manuscript. AH, contributed to the
phenotyping and revision of the manuscript. CRL and TMO contributed to
the data analysis and revision of the manuscript. All authors have read and
approved the final manuscript.
Acknowledgement
This research was supported by funding from the National Science Foundation
(EF-0723447 to Thomas-Mitchell Olds and Dissertation Improvement Grant
1110445 to Cheng-Ruei Lee), the National Institutes of Health (R01 GM086496
to Thomas-Mitchell OLds) and Global Rice Science Partnership (GRiSP) CGIARUS Universities Linkage Program. Cheng-Ruei Lee is currently supported by the
European Molecular Biology Organization long-term fellowship. The authors
thank R. Torres for the management of the field experiments, the IRRI Drought
Physiology staff for measurement of the drought tolerance traits, and M.T. Sta
Cruz, R. Cornista, Carmela Malabanan, Jocelyn Guevarra and the IRRI-SA Rainfed
breeding group staff for their technical support during the course of the
experiment. The authors also acknowledge the support of V. Bartolome for her
help in statistical analysis and R.Oane and I. Serrano for their help in
photographing Moroberekan and Swarna plants.
Author details
1
International Rice Research Institute, DAPO Box 7777, Metro Manila,
Philippines. 2Department of Biology, Duke University, Durham, NC 27708,
USA. 3Present address: Department of Agronomy and Horticulture, University
of Nebraska-Lincoln, Lincoln, NE 68583, USA. 4Present address: Gregor
Mendel Institute of Molecular Plant Biology, Vienna, Austria.
Received: 17 April 2015 Accepted: 9 July 2015
References
1. Molden D, Frenken K, Barker R, de Fraiture C, Mati B, Svendsen M, et al.
Trends in water and agriculture development. In: Molden D, editor. In Water
for food, water for life: A comprehensive assessment of water management
in agriculture. International water management institute, London:
Earthscan and Colombo; 2007. p. 57–89.
2. Kumar V, Ladha JK. Direct seeding of rice: recent developments and future
research needs. Adv Agron. 2011;111:297–413.
3. Pathak H, Tewari AN, Sankhyan S, Dubey DS, Mina U, Singh V, et al.
Direct-seeded rice: potential, performance and problems – A review.
Current Advances in Agricultural Sciences. 2011;3(2):77–88.
4. Bouman BAM, Tuong TP. Field water management to save water and
increase its productivity in irrigated rice. Agric Water Manage.
2001;49(1):11–30.
5. Bouman BAM, Xiaoguang Y, Wang H, Wang Z, Zhao J, Chen B. Performance
of aerobic rice varieties under irrigated conditions in North China.
Field Crop Res. 2006;97(1):53–65.
6. Peng S, Bouman B, Visperas RM, Castañeda A, Nie L, Park H-K. Comparison
between aerobic and flooded rice in the tropics: Agronomic performance in
an eight-season experiment. Field Crop Res. 2006;96(2–3):252–9.
7. Zhao DL, Atlin GN, Bastiaans L, Spiertz JHJ. Developing selection protocols
for weed competitiveness in aerobic rice. Field Crop Res. 2006;97:272–85.
8. Venuprasad R, Bool ME, Quiatchon L, Atlin GN. A QTL for rice grain yield in
aerobic environments with large effects in three genetic backgrounds.
Theor Appl Genet. 2012;124:323–32.
9. Sandhu N, Torres RO, Sta Cruz MT, Maturan PC, Jain R, Kumar A, et al. Traits
and QTLs for development of dry direct-seeded rainfed rice varieties. J Exp
Bot. 2014. doi:10.1093/jxb/eru413.
10. You A, Lu X, Jin H, Ren X, Liu K, Yang G, et al. Identification of quantitative
trait loci across recombinant inbred lines and testcross populations for traits
of agronomic importance in rice. Genetics. 2006;2006(172):1287–300.
11. Yamagishi J, Miyamoto N, Hirotsu S, Laza RC, Nemoto K. QTLs for branching,
floret formation, and pre-flowering floret abortion of rice panicle in a
Dixit et al. BMC Genetics (2015) 16:86
12.
13.
14.
15.
16.
17.
18.
19.
20.
21.
22.
23.
24.
25.
26.
27.
28.
29.
30.
31.
32.
33.
34.
temperate japonica × tropical japonica cross. Theor Appl Genet.
2004;109:1555–61.
Xing YZ, Tan YF, Hua JP, Sun XL, Xu CG, Zhang Q. Characterization of
the main effects, epistatic effects and their environmental interactions
of QTLs on the genetic basis of yield traits in rice. Theor Appl Genet.
2002;105:248–57.
Thomson MJ, Tai TH, McClung AM, Lai X-H, Hinga ME, Lobos KB, et al.
Mapping quantitative trait loci for yield, yield components and
morphological traits in an advanced backcross population between Oryza
rufipogon and the Oryza sativa cultivar Jefferson. Theor Appl Genet.
2003;107:479–93.
Kashiwagi T, Ishimaru K. Identification and functional analysis of a locus for
improvement of lodging resistance in rice. Plant Physiol. 2004;134:676–83.
Kashiwagi T, Togawa E, Hirotsu N, Ishimaru K. Improvement of lodging
resistance with QTLs for stem diameter in rice (Oryza sativa L.). Theor Appl
Genet. 2008;117:749–57.
Kumar A, Dixit S, Ram T, Yadaw RB, Mishra KK, Mandal NP. Breeding
high-yielding drought-tolerant rice: genetic variations and conventional
and molecular approaches. J Exp Bot. 2014;65(21):6265–78.
Dixit S, Huang BE, Sta Cruz MT, Maturan PT, Ontoy JCE, Kumar A. QTLs for
Tolerance of Drought and Breeding for Tolerance of Abiotic and Biotic
Stress: An Integrated Approach. PLoS One. 2014;9(10):e109574.
Yadav RB, Dixit S, Raman A, Mishra KK, Vikram P, Swamy BPM, et al. A QTL
for high grain yield under lowland drought in the background of popular
rice variety Sabitri from Nepal. Field Crops Res. 2013;144:281–7.
Xing Y, Zhang Q. Genetic and molecular bases of rice yield. Annu Rev Plant
Biol. 2010;61:421–42.
Henry A, Cal A, Batoto TC, Torres RO, Serraj R. Root attributes affecting water
uptake of rice (Oryza sativa) under drought. Jour Exp Bot. 2012;63:4751–63.
Swamy BPM, Vikram P, Dixit S, Ahmed HU, Kumar A. Meta-analysis of grain
yield QTL identified during agricultural drought in grasses showed
consensus. BMC Genomics. 2011;12:319.
Courtois B, Shen L, Petalcorin W, Carandang S, Mauleon R, Li Z. Locating
QTLs controlling constitutive root traits in the rice population IAC 165 x
Co39. Euphytica. 2003;134:335–45.
Courtois B, Ahmadi N, Khowaja F, Price AH, Rami J-F, Frouin J, et al. Rice
Root Genetic Architecture: Meta-analysis from a Drought QTL Database.
Rice. 2009;2:115–28.
Araus JL, Cairns J. Field high-throughput phenotyping – the new crop
breeding frontier. Trends Plant Sci. 2014;19:52–61.
Topp CN, Iyer-Pascuzzi AS, Anderson JT, Lee C-R, Zurek PR, Symonova O,
et al. 3D phenotyping and quantitative trait locus mapping identify core
regions of the rice genome controlling root architecture. Proc Nat Aca Sci.
2013;110(18):E1695–704.
Dixit S, Swamy BPM, Vikram P, Bernier J, Sta Cruz MT, Amante M, et al.
Increased drought tolerance and wider adaptability of qDTY12.1 conferred
by its interaction with qDTY2.3 and qDTY3.2. Mol Breed. 2012;30:1767–79.
Ballini E, Morel J-B, Droc G, Price A, Courtois B, Notteghem JL, et al. A
genome-wide meta-analysis of rice blast resistance genes and quantitative
trait loci provides new insights into partial and complete resistance.
Mol Plant Microbe Interact. 2008;21(7):859–68.
Khowaja FS, Norton GJ, Courtois B, Price AH. Improved resolution in the
position of drought-related QTLs in a single mapping population of rice by
meta-analysis. BMC Genomics. 2009;10:276.
McNally KL, Childs KL, Bohnert R, Davidson RM, Zhao K, Ulat VJ, et al.
Genome-wide SNP variation reveals relationships among landraces and
modern varieties of rice. Proc Nat Acad Sci USA. 2009;106(30):12273–8.
Neeraja CN, Maghirang-Rodriguez R, Pamplona A, Heuer S, Collard BCY,
Septiningsih EM, et al. A marker-assisted backcross approach for developing
submergence-tolerant rice cultivars. Theor Appl Genet. 2007;115:767–76.
Vikram P, Swamy BPM, Dixit S, Ahmed HU, Sta Cruz MT, Singh AK, et al.
qDTY1.1, a major QTL for rice grain yield under reproductive-stage drought
stress with a consistent effect in multiple elite genetic backgrounds.
BMC Genet. 2011;12:89.
Morita S, Abe J. Diurnal and phenological changes of bleeding rate in
lowland rice plants. Japanese Journal of Crop Science. 2002;71:383–8.
R Core Team R. A language and environment for statistical computing.
R Foundation for Statistical Computing, Vienna, Austri. 2014. URL
/>Zhao K, Wright M, Kimball J, Eizenga G, McClung A, Kovach M, et al.
Genomic diversity and introgression in O. sativa reveal the impact of
Page 14 of 14
35.
36.
37.
38.
39.
40.
domestication and breeding on the rice genome. PLoS One.
2010;5(5):e10780.
Zhao K, Tung C-W, Eizenga GC, Wright MH, Ali ML, Price AH, et al.
Genome-wide association mapping reveals a rich genetic architecture
of complex traits in Oryza sativa. Nat Comm. 2011;2:467.
Yang J, Hu CC, Hu H, Yu R, Xia Z, Ye X, et al. QTL Network: mapping and
visualizing genetic architecture of complex traits in experimental
populations. Bioinformatics. 2008;24:721–3.
Yang J, Zhu J, Williams RW. Mapping the genetic architecture of complex
traits in experimental populations. Bioinformatics. 2007;23:1527–36.
Anderson JT, Willis JH, Mitchell-Olds T. Evolutionary genetics of plant
adaptation. Trends Genet. 2011;27(7):258–66.
Haley CS, Knott SA. A simple regression method for mapping quantitative
trait loci in line crosses using flanking markers. Heredity. 1992;69:315–24.
Krzywinski M, Schein J, Birol I, Connors J, Gascoyne R, Horsman D, et al.
Circos: An information aesthetic for comparative genomics. Genome Res.
2009;19:1639–45.
Submit your next manuscript to BioMed Central
and take full advantage of:
• Convenient online submission
• Thorough peer review
• No space constraints or color figure charges
• Immediate publication on acceptance
• Inclusion in PubMed, CAS, Scopus and Google Scholar
• Research which is freely available for redistribution
Submit your manuscript at
www.biomedcentral.com/submit