CDKN2A-rs10811661 polymorphism, waist-hip ratio, systolic blood pressure, and dyslipidemia are the independent risk factors for prediabetes in a Vietnamese population
Bạn đang xem bản rút gọn của tài liệu. Xem và tải ngay bản đầy đủ của tài liệu tại đây (562.68 KB, 8 trang )
Binh et al. BMC Genetics (2015) 16:107
DOI 10.1186/s12863-015-0266-0
RESEARCH ARTICLE
Open Access
CDKN2A-rs10811661 polymorphism, waist-hip
ratio, systolic blood pressure, and dyslipidemia are
the independent risk factors for prediabetes in a
Vietnamese population
Tran Quang Binh1*, Nguyen Thi Trung Thu2, Pham Tran Phuong1, Bui Thi Nhung3 and Trinh Thi Hong Nhung1
Abstract
Background: People with prediabetes are at greater risk for heart attack, stroke, kidney disease, vision problems,
nerve damage and high blood pressure, compared to those without the disease. Prediabetes is a complex disorder
involving both genetic and environmental factors in its pathogenesis. This cross-sectional study aimed to investigate
the independent risk factors for prediabetes, considering the contribution of genetic factors (TCF7L2-rs7903146,
IRS1-rs1801278, INSR-rs3745551, CDKN2A-rs10811661, and FTO-rs9939609), socio-economic status, and lifestyle factors.
Results: Among the candidate genes studied, the CDKN2A-rs10811661 polymorphism was found to be the most
significant factor associated with prediabetes in the model unadjusted and adjusted for age, sex, obesity-related
traits, systolic blood pressure, dyslipidemia, socio-economic status, and lifestyle factors. In the final model, the
CDKN2A-rs10811661 polymorphism (OR per T allele = 1.22, 95 % CI = 1.04–1.44, P = 0.017), systolic blood pressure
(OR per 10 mmHg = 1.14, 95 % CI = 1.08–1.20, P < 0.0001), waist-hip ratio (OR = 1.25, 95 % CI = 1.10–1.42, P < 0.0001),
dyslipidemia (OR = 1.57, 95 % CI = 1.15–2.14, P = 0.004), and residence (OR = 1.93, 95 % CI = 2.82–4.14, P < 0.0001) were
the most significant independent predictors of prediabetes, in which the power of the adjusted prediction model
was 0.646.
Conclusions: The study suggested that the CDKN2A-rs10811661 polymorphism, waist-hip ratio, systolic blood pressure,
and dyslipidemia were significantly associated with the increased risk of prediabetes in a Vietnamese population. The
studied genetic variant had a small effect on prediabetes.
Keywords: Association study, CDKN2A gene, Prediabetes, Single nucleotide polymorphism, Vietnamese population
Background
Prediabetes is the condition where blood sugar levels are
higher than normal, but not yet high enough to be classified as diabetes [1]. The importance of prediabetes has
been underscored by the facts that (i) up to 70 % of
people with prediabetes may develop type 2 diabetes
(T2D) during their lifetimes [2]; (ii) the average time it
takes a person with prediabetes to develop T2D is 3
years [3]; and (iii) people with prediabetes are at greater
risk for heart attack, stroke, kidney disease, vision
* Correspondence:
1
National Institute of Hygiene and Epidemiology, 1 Yersin, Hanoi 112800,
Vietnam
Full list of author information is available at the end of the article
problems, nerve damage and high blood pressure, compared to people without the disease [4, 5]. However,
prediabetes is reversible and its related metabolic disorders can be improved with proper treatment [6]. Thus, it
is crucial to identify risk factors for prediabetes to prevent a person from developing this disorder.
Predisposition to prediabetes could be determined by
many different combinations of genetic variants and
environmental factors. Environmental factors that can
increase risk for prediabetes and T2D include lifestyle
habits (a sedentary lifestyle and poor nutrition, smoking
and excessive alcohol consumption), overweight or obese,
poor sleep, age, high blood pressure, and abnormal lipid
levels [7, 8]. Genetic factors contribute to development of
© 2015 Binh et al. Open Access This article is distributed under the terms of the Creative Commons Attribution 4.0
International License ( which permits unrestricted use, distribution, and
reproduction in any medium, provided you give appropriate credit to the original author(s) and the source, provide a link to
the Creative Commons license, and indicate if changes were made. The Creative Commons Public Domain Dedication waiver
( applies to the data made available in this article, unless otherwise stated.
Binh et al. BMC Genetics (2015) 16:107
prediabetes and T2D. Defects in genes that encode
proteins affect pathways involved in insulin control and
glucose homeostasis (the balance of insulin and the
hormone glucagon to maintain blood glucose), hence can
raise the risk for diabetes. Such genes including INSR,
IRS1, CDKN2A, TCF7L2, and FTO are also identified in
genome wide association (GWA) studies [9, 10]. The contributions of these genetic variants on T2D vary among
different ethnic populations because of the differences in
environmental factors, risk–factor profiles, and genetic
background [8, 11]. It is unclear whether these variants
have the same effect in Vietnamese population, which has
different socio–economic and genetic background. Moreover, the importance of each risk factor for prediabetes
which varies within a specific population needs to be
clarified. To date, there has been a limited data on risk
factors for prediabetes in Vietnamese population.
Therefore, the study was designed to investigate both
genetic (TCF7L2-rs7903146, IRS1-rs1801278, INSR-rs3745551,
CDKN2A-rs10811661, and FTO-rs9939609) and environmental factors for prediabetes in a Vietnamese population.
The most significant factors associated with prediabetes
were also reported.
Methods
Subjects and data collection
The study included 2,610 subjects (411 prediabetic cases
and 2,199 normoglycemic controls). They were recruited
from a cross-sectional and population-based study to be
representatives of prediabetic subjects and normoglycemic controls in the general population of the Red
River Delta, Vietnam. Of the total 2,610 participants,
2,608 (99.9 %) belonged to Kinh ethnic group. The Ethics Committee of the National Institute of Hygiene and
Epidemiology, Vietnam approved the study. All participants provided written informed consent before entering
the study. The details of the survey to collect data were reported previously [12]. In summary, data were collected
on social-economic status (current age, gender, ethnicity,
educational level, occupation, marital status, income
level), lifestyle patterns (residence, alcohol consumption,
smoking history, time spent for night’s sleep, siesta, and
watching television), family history of diabetes, medical and
reproductive history. Anthropometric parameters measured
included weight, height, waist circumference (WC), hip circumference (HC), percent body fat, systolic blood pressure
(SBP), and diastolic blood pressure (DBP). Blood samples
were collected and centrifuged immediately in the morning
after a participant had fasted for at least 8 h prior to the
clinic visit. Plasma glucose was measured by glucose oxidase method (GOD–PAP). Lipid profile including total
cholesterol (TC), triglycerides (TG), high-density lipoprotein cholesterol (HDL-C), and low-density lipoprotein cholesterol (LDL-C) were measured by enzymatic methods.
Page 2 of 8
Glucose and lipid profile were analyzed using a semi–
autoanalyzer (Screen Master Lab; Hospitex Diagnostics
LIHD112, Italy) with commercial kit (Chema. Diagnostica,
Italy). Dyslipidemia [13] is defined as HDL-C < 40 mg/dL
for men and < 50 mg/dL for women, and TC, LDL-C and
TG levels ≥ 200, ≥ 130 and ≥ 130 mg/dL, respectively.
The glycaemic status of subjects was determined using
fasting plasma glucose level (FPG) and oral glucose tolerance test (OGTT) with 75 g glucose [14]. Participants were
classified as having diabetes if they had FPG ≥ 7.0 mmol/l
or 2-h plasma glucose ≥ 11.1 mmol/l or previous diagnosis
of diabetes and current use of drug for its treatment.
Normal glucose tolerance (NGT) was classified when
FPG < 5.6 mmol/l and 2-h plasma glucose < 7.8 mmol/l.
Isolated impaired fasting glucose (IFG) was identified if
FPG was between 5.6 and 6.9 mmol/l, and 2-h plasma glucose was less than 7.8 mmol/l. Isolated impaired glucose
tolerance (IGT) was classified if FPG was less than
5.6 mmol/l and 2-h plasma glucose was between 7.8 and
11.0 mmol/l. Combined IFG and IGT (IFG − IGT) were
determined if FPG was between 5.6 and 6.9 mmol/l, and
2-h plasma glucose was between 7.8 and 11.0 mmol/l.
Prediabetic status included IFG and/or IGT.
Genotyping
Peripheral blood samples were obtained from each
participant and genomic DNA was extracted from peripheral blood leukocytes, using Wizard® Genomic DNA
Purification Kit (Promega Corporation, USA). Primers,
protocols of polymerase chain reaction, and restriction enzymes for genotyping the polymorphisms are presented in
Additional file 1. Our typing strategy was to use the
allele–specific primer (ASP) typing method [15], then
10 % of all samples were typed using restriction fragment
length polymorphism (RFLP) analysis to validate observed
results. There were more than 98 % agreement of the
result between ASP typing method and RFLP analysis in
the samples checked. In addition, samples were selected
randomly and re-genotyped using the original platform.
The results showed that the concordance rate was
96–99 % with respect to the 30 % of samples genotyped
twice for quality control.
Statistical analysis
Genotypes were coded as 0, 1, and 2, depending on the
number of copies of risk alleles. Genotype frequencies
were compared and tested for Hardy–Weinberg equilibrium (HWE) by Fisher’s exact test. Five genetic models
were tested (dominant, co-dominant, over-dominant,
recessive, and additive model). Akaike’s Information
Criterion and Bayesian Information Criterion were
applied to estimate the best-fit model for each SNP. The
procedure was performed in SNPstat software [16].
Binh et al. BMC Genetics (2015) 16:107
Page 3 of 8
Quantitative variables were checked for normal distribution and compared using Mann–Whitney U test.
Binary logistic regression analysis was used to test
several models for the associations of prediabetes with
the risk alleles and other variables, taken into account
the covariates (age, sex, socio-economic status, lifestyle
factors, obesity–related traits (BMI, WC, HC, WHR, and
percent body fat), systolic blood pressure, and lipid profile). The variables included in the analyses were checked
for multicollinearity to ensure the stability of the parameter estimates. Here, data are presented as odds ratios
with 95 % confidence intervals (CI). In order to assess
the model performance, a receiver operating characteristic (ROC) curve was built to plot probabilities resulted
from the multivariate logistic regression analysis, and
the area under ROC curve (AUC) was used to measure
the power to predict individuals with prediabetes. The
level of significance was set to 0.05 for all analyses. The
above statistical procedures were performed using SPSS
version 16.0 (SPSS, Chicago, USA). The Bayesian model
averaging was used to cross-validate the final model
using Bayesian Model Averaging Software with the R
Statistical Environment version 3.1.3 [17].
Results
Characteristics of the study subjects
Of the 2,610 participants recruited into the study, 65.4 %
were women, 72.6 % were farmers, and 72.2 % had elementary or intermediate levels of education. The characteristics of subjects in prediabetic cases and controls are
shown in Table 1. There were significant differences between prediabetic and control groups in age, BMI, waist
circumference, WHR, systolic blood pressure, diastolic
blood pressure, total cholesterol, HDL − C, and triglyceride. Significant differences between cases and controls
were not found in gender, height, weight, body fat percent, hip circumference, nutrition status, and LDL − C.
Associated factors for prediabetes
Socioeconomic status (age, marital status), lifestyle patterns
(residence, alcohol consumption), anthropometric traits
(BMI, WC, WHR, and SBP), and lipid profile (TC, TG, and
LDL-C) were significantly associated with prediabetes in
univariate logistic regression (Additional file 2). The analysis of the best-fit model for individual SNPs in candidate
genes with prediabetes among genetic models of inheritance (additive, codominant, dominant, overdominant,
Table 1 Characteristics of subjects in prediabetic cases and controls
Characteristics
P − value
Prediabetic cases
Controls
Total
(N = 411)
(N = 2199)
(N = 2610)
Male, n (%)
152 (37 %)
752 (34.2 %)
904 (34.6 %)
0.276
Age (year)
53 (47–57.8)
51 (46–56)
51 (46–56)
<0.0001
Weight (kg)
51.8 (46–57.9)
51(46.3 − 56.5)
51 (46.2 − 56.6)
0.117
Height (cm)
155.5 (150.5 − 160)
155 (150.7 − 160)
155 (150.6 − 160
0.731
Body mass index (kg/m )
21.5 (19.6 − 23.4)
21.1 (19.3 − 22.9)
21.2 (19.4 − 23)
0.012
Body fat (%)
28.2 (23.7 − 31.9)
27.5 (22.9 − 31.5)
27.6 (23.2 − 31.6)
0.119
Waist circumference (cm)
75 (69–82)
73.5 (68.5 − 79)
74 (68.5 − 79.5)
0.002
Hip circumference (cm)
88 (84–92)
88 (84–91.3)
88 (84–91.5)
0.628
Waist − hip ratio
0.85 (81–0.90)
0.84(0.80 − 0.88)
0.84 (0.80 − 0.88)
<0.0001
0.129
2
Nutrition status
Normal
237 (57.8)
1342 (61.4)
1579 (60.8)
Overweight
77 (18.8)
344 (15.7)
421 (16.2)
Obesity
44 (10.7)
183 (8.4)
227 (8.7)
Underweight
52 (12.7)
316 (14.5)
368 (14.2)
Systolic blood pressure (mmHg)
120 (110–137.5)
110.3 (100–127.5)
115 (110–130)
<0.0001
Diastolic blood pressure (mmHg)
80 (70–85)
70 (65–80)
70 (65–80)
<0.0001
Total cholesterol (mmol l−1)
4.60 (4.09 − 5.00)
4.20 (3.85 − 4.87)
4.30 (3.90 − 4.90)
<0.0001
HDL − C (mmol l−1)
1.19 (0.97 − 1.60)
1.23 (0.99 − 1.60)
1.22 (0.98 − 1.60)
<0.0001
LDL − C (mmol l )
3.10 (2.64 − 3.70)
2.79 (2.31 − 3.31)
2.83 (2.34 − 3.40)
0.103
Triglyceride (mmol l−1)
1.80 (1.12 − 2.55)
1.34 (1.00 − 2.02)
1.41 (1.01 − 2.10)
<0.0001
−1
HDL − C, high-density lipoprotein − cholesterol; LDL − C, low-density lipoprotein − cholesterol. Quantitative data are median (interquartile range). Qualitative data
are number (%). P-value by Mann–Whitney U test or chi-square test
Binh et al. BMC Genetics (2015) 16:107
Page 4 of 8
and recessive) is shown in Additional file 3. The lowest
values of both Akaike’s Information Criterion and Bayesian
Information Criterion were only found in the additive
model, indicating this best-fit model in all studied SNPs.
The association of prediabetes with residence, marital status, alcohol consumption, WHR, SBP, dyslipidemia, and CDKN2A-rs10811661 polymorphism was
observed in multivariate analysis (Table 2), considering
the contribution of genetic factors, anthropometric
measurements, lipid profile, socio-economic status and
lifestyle factors. The prediction model using the most
significant predictors of prediabetes is presented in
Table 3. In the final model, the CDKN2A-rs10811661
polymorphism (OR per T allele = 1.22, 95 % CI = 1.04–
1.44, P = 0.017), systolic blood pressure (OR per
10 mmHg = 1.14, 95 % CI = 1.08–1.20, P < 0.0001), waist–
hip ratio (OR = 1.25, 95 % CI = 1.10–1.42, P < 0.0001), dyslipidemia (OR = 1.57, 95 % CI = 1.15–2.14, P = 0.004), and
residence (OR = 1.93, 95 % CI = 2.82–4.14, P < 0.0001)
were the most significant independent predictors of prediabetes. The independent variables in the final model
were also confirmed using the Bayesian model averaging
(Additional file 4). The area under ROC curve for the prediction model of prediabetes on the predictors including
Table 2 Multivariate analysis of association for prediabetes
Variable
OR (95 % CI)
P-value
Sex
Female
Variable
1
Male
0.78 (0.45–1.33)
0.354
Age (year)
1.02 (0.99–1.04)
0.075
Marital status
Rural
1
P-value
Urban
3.95 (2.50–6.23)
None
1
< 1 drink/mo
1.14 (0.62–2.09)
0.686
≥ 1 drink/mo to < 1 drink/wk
2.02 (1.15–3.56)
0.015
1 drink/wk to ≤ 1 drink/d
1.49 (0.87–2.55)
0.147
2.06 (1.16–3.68)
0.014
1
Never
2.14 (1.01–4.55)
0.048
Widowed
0.92 (0.53–1.60)
0.766
Others
0.87 (0.29–2.57)
0.800
≥ 2 drink/d
Education level
<0.0001
Alcohol consumption
Married
Smoking
Elementary
1
Intermediate
0.97 (0.63–1.50)
0.904
Secondary
0.99 (0.56–1.76)
0.987
Post–secondary
0.89 (0.48–1.62)
0.691
Heavy occupation
Yes
1
No
0.95 (0.64–1.41)
0.800
Income level
< 25 percentiles
1
25– < 50 percentiles
1.25 (0.86–1.82)
0.246
50–75 < percentiles
0.94 (0.63–1.40)
0.749
≥ 75 percentiles
0.99 (0.67–1.48)
0.984
1.11 (1.04–1.19)
0.001
Systolic blood pressure (SD = 10 mmHg)
OR (95 % CI)
Residence
Dyslipidemia
None
1
Current smoker
0.75 (0.44–1.28)
0.293
Ex–smoker
1.01 (0.57–1.77)
0.987
Watching televison time/day
≤3 h
1
>3 h
0.81 (0.44–1.51)
0.513
Sleeping time/day
6–7 h
1
<6 h
0.90 (0.62–1.31)
0.584
≥8 h
0.99 (0.72–1.39)
0.996
Sitting time/day
≤4 h
1
>4 h
0.96 (0.73–1.28)
0.790
1.08 (1.01–1.15)
0.020
Siesta time/day (SD = 15 min)
Each of the following obesity-related measurements:
No
1
Yes
Waist-hip ratio (SD = 0.07)
1.21 (1.03–1.41)
0.019
1.48 (1.04–2.09)
0.027
Waist circumference (SD = 7 cm)
1.12 (0.98–1.27)
0.086
CDKL2A-rs10811661 per copy of T allele
1.23 (1.03–1.46)
0.022
Hip circumference (SD = 7 cm)
1.01 (0.85–1.21)
0.873
TCF7L2-rs7903146 per copy of T allele
1.13 (0.64–2.01)
0.676
Body mass index (SD = 0.25 kg/m2)
1.12 (0.99–1.28)
0.079
IRS1-rs1801278 per copy of G allele
1.01 (0.57–1.79)
0.967
Body fat (SD = %)
1.22 (0.90–1.66)
0.206
INSR-rs3745551 per copy of G allele
1.05 (0.86–1.27)
0.648
FTO-rs9939609 per copy of A allele
0.98 (0.79–1.22)
0.852
SD, standard deviation. One drink was defined as a 50–ml cup of rice wine at about 30 %
Binh et al. BMC Genetics (2015) 16:107
Page 5 of 8
Table 3 The most significant independent predictors of prediabetes
Variable
Unit
Coefficient
Waist to hip ratio
0.07
0.224
Systolic blood pressure
10 mmHg
0.124
1.13 (1.07 − 1.20)
<0.0001
Dyslipidemia
0 = no, 1 = yes
0.453
1.57 (1.15 − 2.14)
0.004
Residence
0 = rural, 1 = urban
1.038
1.93 (2.82 − 4.14)
<0.0001
CDKN2A-rs10811661
Number of T allele
0.201
1.22 (1.04 − 1.44)
0.017
-
<0.0001
Intercept
−6.581
Odds ratio (95 % CI)
P–value
1.25 (1.10 − 1.42)
<0.0001
P-value by multivariate logistic regression
residence, waist-hip ratio, and systolic blood pressure,
dyslipidemia and CDKN2A-rs10811661 polymorphism
was 0.646 (95 % CI: 0.614 − 0.677, P < 0.0001). Adding the
genetic marker to the clinical covariates improved the area
under ROC curve slightly from 0.637 to 0.646 (P < 0.019,
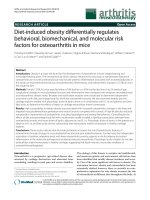
Wilcoxon Signed Ranks Test) (Fig. 1).
Discussion
Of the 5 candidate SNPs tested for association, we found
that the CDKN2A-rs10811661 polymorphism was significantly associated with prediabetes in a Vietnamese
population, independent of obesity-related traits, considering the influence of the socio-economic status and lifestyle factors. The association of the CDKN2A-rs10811661
polymorphism with T2D was initially reported in White
populations [18–20], and subsequently replicated in
Asian populations [21–23]. The CDKN2A-rs10811661
polymorphism was significantly associated with T2D in
Japaneses (OR = 1.25, 95 % CI = 1.08–1.45, P = 0.0024) [22],
and in Indians (OR = 1.37, 95 % CI = 1.18–1.59, P = 5.1E-05)
[24]. In Chinese populations, the CDKN2A-rs10811661
polymorphism was associated with increased risk in both
prediabetes (OR = 1.23, 95 % CI = 1.11–1.36) and T2D
(OR = 1.46, 95 % CI = 1.01–2.11) in a case–control study
and confirmed in a prospective study that the risk allele of
rs10811661 increased the risk of incident T2D by 94 %
[25]. Moreover, in GWA studies in Asians, the variant was
associated with T2D in East Asians (Han Chinese and
Japanese) (OR = 1.23, 95 % CI = 1.18–1.29, P = 1.43E-18)
[26], and a large multi-center GWA study replicated the
Fig. 1 ROC curvers for the prediction models on the number of risk allele of CDKN2A-rs10811661, residence, waist-hip ratio, systolic blood pressure,
and dyslipidemia in model 2 and model 1 without genetic marker
Binh et al. BMC Genetics (2015) 16:107
association in both East Asians (OR = 1.25, 95 % CI =
1.17–1.32, P = 6.3E-13) and South Asians (OR = 1.20, 95 %
CI = 1.11–1.31, P = 1.4E-05) [27]. These studies showed
that the effect of the variant in CDKN2A gene seemed
slightly higher in T2D compared to prediabetes in the
present study (OR = 1.22, 95 % CI = 1.04–1.44, P = 0.017).
On the other hand, this polymorphism was not associated
with prediabetes in German people [28]. Given the multifactorial pattern of prediabetes, the contribution of the
CDKN2A-rs10811661 polymorphism varies among populations depending on the socio–economic status, lifestyle
factors, genetic background, and risk − factor profile of
each population [29].
There were many factors influencing the association
between the CDKN2A-rs10811661 polymorphism and
prediabetes, including bias selection of subjects, confounding factors such as socio–economic condition, and
lifestyle factors. The bias selection in the study was
controlled since the subjects were recruited from the
population − based screening survey with a sample size
representative of all prediabetic cases and normoglycemic
controls in the general population. Moreover, given the
multifactorial nature of prediabetes, the association in our
study was investigated in several analysis models, which
considered the various factors including sex, age, systolic
blood pressure, obesity − related traits (BMI, WC, WHR,
and body fat percentage), socio–economic patterns
(occupation, education level, residence, marital status,
income level), and lifestyle factors (smoking, alcohol consumption, leisure time spent sitting, watching TV, and
siesta). Thereby, the statistically significant association between the CDKN2A-rs10811661 polymorphism and prediabetes was found to be independent of the traditional risk
factors.
Regarding the allele and genotype frequencies of the
CDKN2A-rs10811661 polymorphism, we found that the
risk T allele frequency was 57.6 %, and the frequencies of
CC, CT, and TT genotypes were 18.9, 46.9, and 34.2 %, respectively in the total sample. The allele and genotype
frequencies in our sample were similar to those in Asian
populations (Han Chinese: 57 %, Japanese: 52.4 %) and
different from those in European (77.8–80.1 %) and
African (89–98.2 %) populations based on HapMap data [30].
Being obesity, which is associated with insulin resistance and dysfunction of beta cell, is one of the most
important risk factors for the development of prediabetes [31]. Among obesity-related traits, WHR was recognized to be the most significantly associated with
prediabetes in our population. In the present study, the
association between the CDKN2A-rs10811661 polymorphism and prediabetes was consistently significant
when adding each of the obesity − related traits in the
analysis models including age, gender, systolic blood
pressure, socio-economic status and lifestyle factors,
Page 6 of 8
indicating the direct effect of the CDKN2A-rs10811661
polymorphism on prediabetes, independently of the
obesity–related traits.
In terms of predictors of prediabetes, few genetic studies
have been reported although the importance of prediabetes
has been underscored. The present data showed an
increased prediabetes risk with an additive effect of the
alleles of CDKN2A-rs10811661 (OR per T allele = 1.22,
95 % CI = 1.04–1.44, P = 0.017). Our finding supports the
association of the CDKN2A-rs10811661 polymorphism
with prediabetes reported in previous case–control studies
in Asian populations [22, 23, 25, 28]. Moreover, the predictive effect of the CDKN2A-rs10811661 polymorphism
on the incident T2D was also confirmed in a 3.5 year
follow-up study [28]. These findings can be explained by
the evidences that a reduced insulin release was observed
for the CDKN2A-rs10811661 T-allele after both oral and
intravenous glucose challenges [20] and that the SNP was
significantly associated with early-phase insulin release
[32]. Among the independent risk factors for prediabetes,
WHR, dyslipidemia, and systolic blood pressure demonstrated the strongest effects in our findings, which is in
agreement with previous studies [33–35]. Adding the genetic marker to the clinical covariates in our study improved slightly the area under the receiver operating
characteristic curve from 0.637 to 0.646 (P < 0.019), indicating that the studied variant had a small effect on
prediabetes.
Indeed, some advantages could be highlighted in this
study. Since this is a large population-based study in the
Red River Delta region, Vietnam, the findings of the study
will be interpreted for general population of this region in
both genetic pattern and risk factor profile. The studied
population could be considered as a homogeneous sample
of the Kinh ethnic adults aged 40–64 years in a rural
province without other ethnic admixtures. Prediabetes including IFG and/or IGT was determined using fasting
plasma glucose level and oral glucose tolerance test with
75 g glucose. This method has been widely accepted and
frequently referred as the “gold standard” for diagnosis of
prediabetes. However, several limitations should be noted
in this study. First, the limitation of the cross-sectional
study design does not allow for conclusions of the causal
relationships. Next, among many candidate SNPs have
been proposed to be associated with T2D and prediabetes,
the present study was only interested in 5 SNPs in genes
related to insulin pathway, and thereby the studied genetic
variant had a small effect on prediabetes despite statistical
significance. Lastly, the area under ROC curve of 0.646
shows the poor power of prediction of the model.
Conclusions
These data demonstrate that the CDKN2A-rs10811661
polymorphism, waist–hip ratio, systolic blood pressure,
Binh et al. BMC Genetics (2015) 16:107
and dyslipidemia were significantly associated with the
increased risk of prediabetes in a Vietnamese population.
The association remains consistent after adjustment for
age, gender, socio-economic status, and lifestyle-related
factors. Because of the small contribution of the single
CDKN2A–rs10811661 polymorphism, it is necessary to
conduct a large-scale prospective study on prediabetes
and T2D in Vietnamese population.
Additional files
Page 7 of 8
3.
4.
5.
6.
7.
8.
Additional file 1: Table S1. Methods for genotyping CDKN2A, FTO,
INSR, IRS1, and TCF7L2 polymorphisms. (DOCX 37 kb)
9.
Additional file 2: Table S2. Associated factors of prediabetes in
middle-aged population in univariate logistic regression analysis.
(DOCX 39 kb)
10.
Additional file 3: Table S3. Analysis of the best-fit model for individual
SNPs of candidate genes for prediabetes. (DOCX 23 kb)
Additional file 4: Figure S1. Analysis Bayesian Model Averaging
analysis to cross-validate the final model. (DOCX 67 kb)
Abbreviations
BMI: Body mass index; CI: Confidence interval; DBP: Diastolic blood pressure;
HC: Hip circumference; HDL-C: High-density lipoprotein cholesterol;
IGT: Impaired glucose tolerance; IFG: Impaired fasting glucose; LDL-C: Lowdensity lipoprotein cholesterol; OGTT: Oral glucose tolerance test; OR: Odds
ratio; RFLP: Restriction fragment length polymorphism; SBP: Systolic blood
pressure; TC: Total cholesterol; T2D: Type 2 diabetes; TG: Triglycerides;
WC: Waist circumference; WHR: Waist–hip ratio.
Competing interests
The authors declare that they have no competing interests.
Authors’ contributions
TQB: Conceptualization of the study, study design, proposal writing, data
collection, data analysis, discussion and editing of the final draft for publication.
NTTT, PTP: Conceptualization of the study, data collection, data analysis,
discussion and editing of the final draft for publication. BTN, TTHN: data
collection, data analysis, discussion, and editing of the final draft for publication.
All authors approved the final draft of this article prior to submission.
Acknowledgments
The authors would like to thank Dr. Dang Dinh Thoang, Dr. Pham Van
Thang, and Mrs. Nguyen Minh Thai for kindly helps and supports. We
acknowledge the health staff of the Ha Nam Center for Preventive Medicine
for their cooperation and assistance.
This study was supported by Vietnam’s National Foundation for Science and
Technology Development (NAFOSTED), grant no. 106.09-2012.04 from the
Ministry of Science and Technology, Vietnam.
Author details
1
National Institute of Hygiene and Epidemiology, 1 Yersin, Hanoi 112800,
Vietnam. 2Hanoi National University of Education, 136 Xuan Thuy Street,
Hanoi, Vietnam. 3National Institute of Nutrition, 48B Tang Bat Ho Street,
Hanoi 112807, Vietnam.
11.
12.
13.
14.
15.
16.
17.
18.
19.
20.
21.
22.
Received: 16 April 2015 Accepted: 21 August 2015
23.
References
1. Kuzuya T, Nakagawa S, Satoh J, Kanazawa Y, Iwamoto Y, Kobayashi M, et al.
Report of the Committee on the classification and diagnostic criteria of
diabetes mellitus. Diabetes Res Clin Pract. 2002;55(1):65–85.
2. Nathan DM, Davidson MB, DeFronzo RA, Heine RJ, Henry RR, Pratley R, et al.
Impaired fasting glucose and impaired glucose tolerance: implications for
care. Diabetes Care. 2007;30(3):753–9.
24.
Nichols GA, Hillier TA, Brown JB. Progression from newly acquired impaired
fasting glusose to type 2 diabetes. Diabetes Care. 2007;30(2):228–33.
Barr EL, Zimmet PZ, Welborn TA, Jolley D, Magliano DJ, Dunstan DW, et al.
Risk of cardiovascular and all-cause mortality in individuals with diabetes mellitus,
impaired fasting glucose, and impaired glucose tolerance: the Australian
Diabetes, Obesity, and Lifestyle Study (AusDiab). Circulation. 2007;116(2):151–7.
Buysschaert M, Medina JL, Bergman M, Shah A, Lonier J. Prediabetes and
associated disorders. Endocrine. 2014;1–23. doi:10.1007/s12020-014-0436-2.
Tuso P. Prediabetes and lifestyle modification: time to prevent a
preventable disease. Perm J. 2014;18(3):88–93.
Chan JC, Malik V, Jia W, Kadowaki T, Yajnik CS, Yoon KH, et al. Diabetes in Asia:
epidemiology, risk factors, and pathophysiology. JAMA. 2009;301:2129–40.
Weber MB, Oza–Frank R, Staimez LR, Ali MK, Narayan KM. Type 2 diabetes in
Asians: prevalence, risk factors, and effectiveness of behavioral intervention
at individual and population levels. Annu Rev Nutr. 2012;32:417–39.
Sladek R, Rocheleau G, Rung J, Dina C, Shen L, Serre D, et al. A genomewide association study identifies novel risk loci for type 2 diabetes.
Nature. 2007;445:881–5.
Basile KJ, Johnson ME, Xia Q, Grant SF. Genetic susceptibility to type 2
diabetes and obesity: follow-up of findings from genome-wide association
studies. Int J Endocrinol. 2014;2014:769671. doi:10.1155/2014/769671.
Saxena R, Elbers CC, Guo Y, Peter I, Gaunt TR, Mega JL, et al. Large-scale
gene-centric meta-analysis across 39 studies identifies type 2 diabetes loci.
Am J Hum Genet. 2012;90:410–25.
Quang Binh T, Tran Phuong P, Thi Nhung B, Dinh Thoang D, Van Thang P,
Khanh Long T, et al. Prevalence and correlates of hyperglycemia in a rural
population, Vietnam: implications from a cross-sectional study. BMC Public
Health. 2012;12:939.
Expert Panel on Detection, Evaluation, and Treatment of High Blood
Cholesterol in Adults. Executive Summary of the Third Report of the
National Cholesterol Education Program (NCEP) Expert Panel on Detection,
Evaluation, and Treatment of High Blood Cholesterol in Adults (Adult
Treatment Panel III). JAMA. 2001;285:2486–97. doi:10.1001/jama.285.19.2486
World Health Organization. Definition and diagnosis of diabetes mellitus
and intermediate hyperglycemia: report of a WHO consultation.
Geneva: World Health Organization; 2006.
Wangkumhang P, Chaichoompu K, Ngamphiw C, Ruangrit U, Chanprasert J,
Assawamakin A, et al. WASP: a Web–based Allele–Specific PCR assay
designing tool for detecting SNPs and mutations. BMC Genomics.
2007;8:275. doi:10.1186/1471-2164-8-275.
Solé X, Guinó E, Valls J, Iniesta R, Moreno V. SNPStats: a web tool for the
analysis of association studies. Bioinformatics. 2006;22(15):1928–9.
Team RC. R: A language and environment for statistical computing. R Foundation
for Statistical Computing, Vienna, Austria. 2015. />Scott LJ, Mohlke KL, Bonnycastle LL, Willer CJ, Li Y, Duren WL, et al.
A genome-wide association study of type 2 diabetes in Finns detects
multiple susceptibility variants. Science. 2007;316(5829):1341–5.
Grarup N, Rose CS, Andersson EA, Andersen G, Nielsen AL, Albrechtsen A,
et al. Studies of association of variants near the HHEX, CDKN2A/B, and
IGF2BP2 genes with type 2 diabetes and impaired insulin release in 10,705
Danish subjects: validation and extension of genome-wide association
studies. Diabetes. 2007;56(12):3105–11.
Zeggini E, Weedon MN, Lindgren CM, Frayling TM, Elliott KS, Lango H, et al.
Replication of genome-wide association signals in UK samples reveals risk
loci for type 2 diabetes. Science. 2007;316:1336–41.
Ng MCY, Park KS, Oh B, Tam CHT, Cho YM, Shin HD, et al. Implication of
genetic variants near TCF7L2, SLC30A8, HHEX, CDKAL1, CDKN2A/B, IGF2BP2,
and FTO in type 2 diabetes and obesity in 6,719 Asians. Diabetes.
2008;57:2226–33.
Omori S, Tanaka Y, Takahashi A, Hirose H, Kashiwagi A, Kaku K, et al.
Association of CDKAL1, IGF2BP2, CDKN2A/B, HHEX, SLC30A8, and KCNJ11
with susceptibility to type 2 diabetes in a Japanese population.
Diabetes. 2008;57:791–5.
Wu Y, Li H, Loos RJ, Yu Z, Ye X, Chen L, et al. Common variants in CDKAL1,
CDKN2A/B, IGF2BP2, SLC30A8, and HHEX/IDE genes are associated with
type 2 diabetes and impaired fasting glucose in a Chinese Han population.
Diabetes. 2008;57(10):2834–42.
Ganesh C, Charles US, Rubina T, Seema B, Smita RK, Anubha M, et al.
Impact of common variants of PPARG, KCNJ11, TCF7L2, SLC30A8, HHEX,
CDKN2A, IGF2BP2 and CDKAL1 on the risk of type 2 diabetes in 5.164
Indians. Diabetes. 2010;59:2068–74.
Binh et al. BMC Genetics (2015) 16:107
Page 8 of 8
25. Xu M, Bi Y, Xu Y, Yu B, Huang Y, Gu L, et al. Combined effects of 19 common
variations on type 2 diabetes in Chinese: results from two community-based
studies. PLoS One. 2010;5(11):e14022. doi:10.1371/journal.pone.001402221103332.
26. Hara K, Fujita H, Johnson TA, Yamauchi T, Yasuda K, Horikoshi M, et al.
Genome-wide association study identifies three novel loci for type 2
diabetes. Hum Mol Genet. 2014;23(1):239–46. doi:10.1093/hmg/ddt399.
27. DIAbetes Genetics Replication And Meta-analysis (DIAGRAM) Consortium,
Asian Genetic Epidemiology Network Type 2 Diabetes (AGEN-T2D) Consortium,
South Asian Type 2 Diabetes (SAT2D) Consortium, Mexican American Type 2
Diabetes (MAT2D) Consortium, Type 2 Diabetes Genetic Exploration by
Nex-generation sequencing inmuylti-Ethnic Samples (T2D-GENES) Consortium,
et al. Genome-wide trans-ancestry meta-analysis provides insight into
the genetic architecture of type 2 diabetes susceptibility. Nat Genet.
2014;46(3):234–44. doi:10.1038/ng.2897.
28. Zyriax B-C, Salazar R, Hoeppner W, Vettorazzi E, Herder C, Windler E.
The association of genetic markers for type 2 diabetes with prediabetic
status - cross-sectional data of a diabetes prevention trial. PLoS One.
2013;8(9):e75807. doi:10.1371/journal.pone.0075807.
29. Adeyemo A, Rotimi C. Genetic variants associated with complex human
diseases show wide variation across multiple populations. Public Health
Genomics. 2010;13:72–9.
30. Sherry ST, Ward M and Sirotkin K. dbSNP–Database for single nucleotide
polymorphisms and other classes of minor genetic variation. Genome Res.
1999;9:677–9.
31. Kahn BB, Flier JS. Obesity and insulin resistance. J Clin Invest. 2000;106(4):473–81.
32. Stančáková A, Kuulasmaa T, Paananen J, Jackson AU, Bonnycastle LL, Collins FS,
et al. Association of 18 confirmed susceptibility Loci for type 2 diabetes with
indices of insulin release, proinsulin conversion, and insulin sensitivity in 5,327
nondiabetic Finnish men. Diabetes. 2009;58(9):2129–36.
33. Khambalia A, Phongsavan P, Smith BJ, Keke K, Dan L, Fitzhardinge A, et al.
Prevalence and risk factors of diabetes and impaired fasting glucose in
Nauru. BMC Public Health. 2011;11:719. doi:10.1186/1471-2458-11-719.
34. Soriguer F, Goday A, Bosch-Comas A, Bordiú E, Calle-Pascual A, Carmena R,
et al. Prevalence of diabetes mellitus and impaired glucose regulation in
Spain: The Study. Diabetologia. 2012;55:88–93.
35. Díaz-Redondo A, Giráldez-García C, Carrillo L, Serrano R, García-Soidán F,
Artola S, et al. Modifiable risk factors associated with prediabetes in men
and women: a cross-sectional analysis of the cohort study in primary health
care on the evolution of patients with prediabetes (PREDAPS-Study).
BMC Fam Pract. 2015;16:5. doi:10.1186/s12875-014-0216-3.
Submit your next manuscript to BioMed Central
and take full advantage of:
• Convenient online submission
• Thorough peer review
• No space constraints or color figure charges
• Immediate publication on acceptance
• Inclusion in PubMed, CAS, Scopus and Google Scholar
• Research which is freely available for redistribution
Submit your manuscript at
www.biomedcentral.com/submit