ANALYSIS OF FINANCIAL SITUATION FOR VIETNAM SUN CORPORATION - VNS (VINASUN) - Financial Management for MBA
Bạn đang xem bản rút gọn của tài liệu. Xem và tải ngay bản đầy đủ của tài liệu tại đây (586.22 KB, 24 trang )
i
MASTER OF BUSINESS ADMINISTRATION
INTERNATIONAL PROGRAM
ASSIGNMENT
CORPORATE FINANCE
Submitted to: Dr. Cao Minh Man
Submitted by: Huynh Thi My Dieu
ID No.: CGSVN00014998
Class: MBAOUM0313 – K08A
Ho Chi Minh City, March 2014
i
MASTER OF BUSINESS ADMINISTRATION
INTERNATIONAL PROGRAM
ASSIGNMENT
CORPORATE FINANCE
Submitted to: Dr. Cao Minh Man
Submitted by: Huynh Thi My Dieu
ID No.: CGSVN00014998
Class: MBAOUM0313 – K08A
Ho Chi Minh City, March 2014
i
MASTER OF BUSINESS ADMINISTRATION
INTERNATIONAL PROGRAM
ASSIGNMENT
CORPORATE FINANCE
Submitted to: Dr. Cao Minh Man
Submitted by: Huynh Thi My Dieu
ID No.: CGSVN00014998
Class: MBAOUM0313 – K08A
Ho Chi Minh City, March 2014
ii
Acknowledgement
A completed report would not be done without any assistance. First of all, I would
like to express my endless thanks to lecturer Dr. Cao Minh Man. His kindly support
and continuous advices went through the process of completion of my report. Without
his motivation and instructions, the report could not be done effectively.
My special thanks approve to my parents for their endless love, care and have most
assistances and motivation me. I also would like to explain my thanks to my siblings,
brothers and sister for their support and care me all the time.
As last, my deeply thanks come to all colleagues. Their kindly help, care, motivation
gave me strength and lift me up all the trouble for the rest of my life.
With kindest regards,
Huynh Thi My Dieu
iii
Table of Contents
Part 1: Introduction 1
Part 2: VINASUN’S Company Profile 3
Part 3: Risk Profile 5
Part 4: Cash Flow and Investment Analysis 8
Part 5: Dividends and Valuation 12
Part 6: Conclusion and Recommendation 17
References 20
List of Tables
Table 3.1: Change in Taxi fees and fuel price from 2009 – 2012 6
Table 4.1: Balance Sheet of VINASUN from 2009 – 2012 8
Table 4.2: Cash Flow of VINASUN from 2009 – 2012 9
Table 4.3: Business Result of VINASUN from 2009 – 2012 10
Table 5.1: Financial Ratio of each indicator for VINASUN from 2009 – 2012 13
Table 5.2: Summarize actual and forecasting VINASUN’s business performance 13
Table 5.3: Peers comparison with VINASUN in the same industry 17
Table 6.1: Forecasted Cash flow in the next 4 years 18
Table 6.2: Business plan of VINASUN 19
List of Charts
Chart 1.1: Growth in Taxi number in HCM City from 2007 – 2012 2
Chart 5.1: Revenue and profit after Tax of VINASUN 6
Chart 5.2: Growth in ROA and ROE of VINASUN from 2009 – 2014F 15
List of Figure
Figure 3.1: VINASUN’S Stock performance within 3 latest months 6
iv
ANALYSIS OF FINANCIAL SITUATION
FOR VIETNAM SUN JOINT STOCK COMPANY - VNS
(VINASUN CORP.)
iv
ANALYSIS OF FINANCIAL SITUATION
FOR VIETNAM SUN JOINT STOCK COMPANY - VNS
(VINASUN CORP.)
iv
ANALYSIS OF FINANCIAL SITUATION
FOR VIETNAM SUN JOINT STOCK COMPANY - VNS
(VINASUN CORP.)
1
Part I: Introduction
Nowadays, citizens prefer to start using public transportation more because of rising petrol
prices, unavoidable traffic jams and growing environmental pollution. In the long run, private
car ownership will rise, although much of the current generation has calculated that this does
not make sense. In general, Vietnam’s roads are poor and complex. Despite of concerning on
construction new highway, only 13.5% of the road network is considered to be in good
condition, 26% has two or more lanes and 29% is tarred (BMI report). Ruling of the Vietnam
taxi industry varies from city to city. While almost all cities have had no licensing
requirements, larger urban areas had the strictest regulations. Currently, HCM City, Hanoi
and Danang have licensing regulations in force to regulate taxi numbers.
Over the last five years, Vietnam’s taxi transportation sector in Ho Chi Minh City has grown
at a remarkable 16% CAGR in terms of cab numbers (from 6,000 in 2005 to 12,550 as of
May 2010). The industry is expected to maintain an average growth rate of 10% annually
over the 2010-2015 periods. Rising living standards and high capita per cab (800 in HCMC
versus 210 in Singapore) underpin growth.
In Ho Chi Minh City, taxis are considered as a second ways of passengers’ public
transportation after bus transportation. As of May 2010, there are 36 enterprises and
cooperatives in the taxi service business with 12,550 registered taxis transporting 400,000
passengers per day, occupy 30% of the carried volume of public passenger transportation.
There are big market players in taxi sector such as Mai Linh, Vinasun, Savico, Future taxi,
and Saigon Air; each of these companies has at least 100 taxis with the number rising every
year. In addition, there are 2,000-3,000 illegal taxis outside the authority’s control.
2
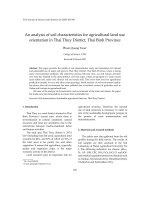
Source: Ho Chi Minh Department of Transportation, Mekong Securities
The growth rate of taxi at current is much faster than expected pace through each
development phase. For example, in the study proposed to the Prime Minister approved at
Decision dated 22/1/2007 101/QD-TTg on the HCMC Transport Development Plan to 2020
and vision after 2020, the expected number of taxis for period 2010 - 2015 was 9,500
vehicles. But at the present, the actual figure is exceeding 13,000 units (up to 26.9%).
The service sector is one of the growth sectors likely positive. Most of the macroeconomic
situations in the country at present prove proofs to estimate the market taxi steady growth
thanks to (1) increase per capita income, (2) the cost of buying a car individual are quite
expensive, (3) the development of public transport plus not enough to meet the needs of the
whole market. However, the growth rate of taxi service in Vietnam may be leveling off in to
time by the limitations of transport infrastructure as well as restrictions HCM City's taxi
traffic.
Cab number (units)
2,000
4,000
6,000
8,000
10,000
12,000
14,000
Chart 1.1:
Growth in Taxi numbers in HCM City, 2007 - 2012
2
Source: Ho Chi Minh Department of Transportation, Mekong Securities
The growth rate of taxi at current is much faster than expected pace through each
development phase. For example, in the study proposed to the Prime Minister approved at
Decision dated 22/1/2007 101/QD-TTg on the HCMC Transport Development Plan to 2020
and vision after 2020, the expected number of taxis for period 2010 - 2015 was 9,500
vehicles. But at the present, the actual figure is exceeding 13,000 units (up to 26.9%).
The service sector is one of the growth sectors likely positive. Most of the macroeconomic
situations in the country at present prove proofs to estimate the market taxi steady growth
thanks to (1) increase per capita income, (2) the cost of buying a car individual are quite
expensive, (3) the development of public transport plus not enough to meet the needs of the
whole market. However, the growth rate of taxi service in Vietnam may be leveling off in to
time by the limitations of transport infrastructure as well as restrictions HCM City's taxi
traffic.
2007
2008
2009
2010
2011
2012
Cab number (units)
8,000
9,395
10,710
11,500
12,550
13,000
0
2,000
4,000
6,000
8,000
10,000
12,000
14,000
Chart 1.1:
Growth in Taxi numbers in HCM City, 2007 - 2012
2
Source: Ho Chi Minh Department of Transportation, Mekong Securities
The growth rate of taxi at current is much faster than expected pace through each
development phase. For example, in the study proposed to the Prime Minister approved at
Decision dated 22/1/2007 101/QD-TTg on the HCMC Transport Development Plan to 2020
and vision after 2020, the expected number of taxis for period 2010 - 2015 was 9,500
vehicles. But at the present, the actual figure is exceeding 13,000 units (up to 26.9%).
The service sector is one of the growth sectors likely positive. Most of the macroeconomic
situations in the country at present prove proofs to estimate the market taxi steady growth
thanks to (1) increase per capita income, (2) the cost of buying a car individual are quite
expensive, (3) the development of public transport plus not enough to meet the needs of the
whole market. However, the growth rate of taxi service in Vietnam may be leveling off in to
time by the limitations of transport infrastructure as well as restrictions HCM City's taxi
traffic.
2012
13,000
Chart 1.1:
Growth in Taxi numbers in HCM City, 2007 - 2012
3
Part 2: VINASUN’S Company Profile
Stock Code: VNS, Stock Floor: HOSE
Industrials: Taxi Transportation Services
Charter Capital: VND 300 billions
Add: 306 Dien Bien Phu, Ward 22, Binh Thanh
District, Ho Chi Minh City.
Phone: +84 (8) 382-77178
Fax: +84 (8) 395-26410
E-mail:
Employees: 13,488 (2012)
Branches: 11
Website:
Shareholders Structure:
- State Property: 0%
- Management: 38%
- Foreign individual: 1%
- Foreign institution: 26%
- Domestic individual: 7%
- Domestic institution: 28%
Big shareholders:
- Dang Phuoc Thanh (Chairman): 24%
- Dang Thanh Duy (Deputy CEO): 14%
- Vietnam Investment Fund (VIF): 12%
- Red River Holding: 13%
- Sai Gon Trading Group (SATRA): 13%
- Others: 28%
Business sectors:
- Operating in taxi transportation with the
brand-name Taxi Vinasun;
- Operating in travel, air travel with the brand-
name Vinasun Travel;
- Operating in restaurants, food and beverage;
- Operating in real estate. Currently, the
company invested constructing the Tan Da
Retail Center with a total area of 1,200m
2
.
The residential project at 103 Truong Dinh
Hoi in District 8 with an area of 2,659 m
2
and
land locates at 26-28-30-32 Thu Khoa Huan.
Board of manager:
- Dang Phuoc Thanh: Chairman
- Huynh Van Minh: Vice Chairman
- Dang Thi Lan Phuong: Member of BOM
- Ta Long Hy: Member of BOM
- Truong Dinh Quy: Member of BOM
Board of director:
- Dang Thi Lan Phuong: CEO
- Ta Long Hy: Deputy General Director
- Truong Dinh Quy: Deputy General Director
- Ngo Thi Thuy Van: Deputy General Director
- Huynh Van Sy: Deputy General Director
- Tran Anh Minh: Deputy General Director
- Dang Phuoc Hoang Mai: Deputy General Director
The memorable numbers of Vinasun Taxi in 2012:
- Average revenue was VND1,828 million/ day/ car (increase of 11.13% compared to 2011);
- 27,154 calls for services/ day, up 6.6% compared to 2011;
4
- Above 90 million was the number of customers served in 2011;
- VND7.2 million/ month is the average income of directly driving staff;
- VND5 million/ month is the average income of indirect staff, directly operating and business support;
- 13,488 personnel as of 31/12/2012;
- 7,287 employees must pay income tax on individuals while 6,779 of them are directly driving
employees;
- 4,622 is the number of Vinasun taxi vehicles up to date 31/12/2012.
Source: VNS prospectus, HOSE
VINASUN is a Vietnam-based passenger transportation services provider. Predecessor of the
company is the Trade Travel Services and Investment Consulting Vietnam Sun Co. Ltd., was
established on 15/06/1995, with registered capital of VND300 million. On 17/7/2003, the
Company renamed to Vietnam Sun Joint Stock Company with registered capital of VND8
billion. On 25/5/2006, the Company increased its chartered capital to VND 16 billion to
invest in new vehicles for taxi services. On 2/2007, the Company issued VND 84 billion par
values to increase charter capital to VND 100 billion to restructure debt and invest more cars
in the year of 2007. To 10/2007, the Company issued VND 70 billion face value for big
investors; increase the Company's share capital to VND 170 billion.
In addition, the company has its presence in development of commercial and residential
buildings as supporting activities to tourism operation. On 29/7/2008, the company officially
listed its shares on the stock exchange in Ho Chi Minh City. As of December 31, 2008, taxi
operation contributed to 97% of total revenue. In 9/2009, the company issued additional
shares to increase charter capital to VND 200 billion. The charter capital of the company
increased to more than VND 299 billion on 7/2010.
On 3/09/2013, Forbes Vietnam, the Vietnamese version of the leading business magazine in
the world, announced the list of 50 best listed companies on the stock market in Vietnam.
This is the first company ranked by Forbes Vietnam perform research. Vietnam Sun Joint
Stock Company (Vinasun Corp.) was ranked at 34
th
on the list with a market capitalization of
VND 1,701 billion; revenue in 2012 was VND 2,713 billion.
However, the author still expect Vinasun sustain current growth while promoting activities in
the nearby market access as Binh Duong, Dong Nai and Vung Tau.
5
Part 3: Risk Profile
VINASUN is not a big company but is a leading organization among players in Taxi sector
in Hochiminh City now. Risk profile of VNS comes from many factors but in limited of this
report, the author focus on two main factors represented for transportation business like
VINASUN which are scales of taxi fleet and fuel price.
The taxi market is quite competitive, in which Ho Chi Minh City and Ha Noi are the two
biggest markets. In Ha Noi, there are more than 100 taxi companies with around 17,400 cabs
while in Ho Chi Minh City, there are approximately 26 taxis with around 11,000 cabs.
Prominent players in the taxi market are Taxi Group (more than 2,000 cabs, present mostly in
Hanoi and its neighboring provinces), Mai Linh Group (about 9,905 cabs, present in 50
cities), Vinasun (4,622 cabs; present in 5 cities) … In the taxi market, fleet expansion greatly
depends on the ability to obtain taxi licenses, therefore, in some cases, to obtain new
licenses, taxi companies must dispose old cars in order to invest in new cabs. At the end
of 2012, VNS boasts 4,622 taxis. If we were to assume that VNS’s private placement proves
successful in 2013, it would help VNS to acquire an additional 900 vehicles in 2013. VNS
already purchased 100 new cars in Q1/2013 and disposed 38 old vehicles, total vehicles
count to 4,684 cabs. Increase in the number of taxis depends on the ability to be granted new
taxi licenses and it would affect to revenue of the company.
On the other side, there will be a high correlation between taxi fare and fuel price which
correlates with international oil price. According to an EIA forecast (Annual Energy outlook
to 2013 with projection to 2040), the annual growth of WTI oil price 2011 – 2040 would be
approximately 1.8%. Therefore, we assume that taxi fares would also increase
correspondingly by 1% per year from 2013 until 2017 as it is not easy to defer all increases in
cost to customers. The sensitivity shows that for every change of 1% of average taxi fee,
revenue would be affected by 1% and Net Profit After Tax would be affected by 2%.
6
Table 3.1: Change in taxi fee and fuel price from 2009 to 2012
2009
2010
2011
2012
Average taxi fee (VND/km)
10,674
12,416
14,549
16,472
Fuel price (VND/liter)
15,950
16,400
20,130
23,150
[Source: Company data]
To overcome these risks VNS’s has effectively formed a risk management team and an
effective risk management team to minimize risks for investors as well as corporation. The
risk has been coming from the changes in the market, and the structural changes being
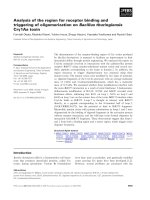
undertaking by VNS. The Stock Performance of VNS’s has been reasonably decent despite
the large scale changes in operation being undertaken.
Figure 3.1: VINASUN’S Stock Performance within 3 latest months (Source: Vietstock)
6
Table 3.1: Change in taxi fee and fuel price from 2009 to 2012
2009
2010
2011
2012
Average taxi fee (VND/km)
10,674
12,416
14,549
16,472
Fuel price (VND/liter)
15,950
16,400
20,130
23,150
[Source: Company data]
To overcome these risks VNS’s has effectively formed a risk management team and an
effective risk management team to minimize risks for investors as well as corporation. The
risk has been coming from the changes in the market, and the structural changes being
undertaking by VNS. The Stock Performance of VNS’s has been reasonably decent despite
the large scale changes in operation being undertaken.
Figure 3.1: VINASUN’S Stock Performance within 3 latest months (Source: Vietstock)
7
7
7
8
Part 4: Cash Flow and Investment Analysis
FINANCIAL SUMMARIZE:
BALANCE SHEET
Unit: VND Million
Property
2009
2010
2011
2012
Assets
Cash and cash equivalents
59,257
62,994
38,484
28,298
The short-term receivables
52,147
95,715
123,553
138,199
Inventory
903
2,017
3,642
4,291
Other short-term assets
23,883
32,163
40,819
33,095
TOTAL ASSETS
136,190
192,888
206,499
203,883
The long-term receivables
5,234
2,864
1,119
11
Fixed assets
962,312
1,545,634
1,558,471
1,560,312
(Accumulated depreciation)
-236,454
-422,606
-614,825
-891,065
Real Estate Investment
197,210
11,570
11,570
11,570
Long-term financial investments
2,400
1,660
1,140
540
Total other long-term assets
6,268
7,133
9,117
5,819
TOTAL ASSETS
1,309,615
1,761,749
1,787,916
1,782,135
Liabilities
Short-term debt
48,772
183,999
170,879
177,607
Long-term debt
548,784
749,799
753,346
664,227
Total Debt
597,556
933,798
924,225
841,833
Sources of capital
Equity
703,465
819,978
855,868
936,220
Funds and other funds
8,594
N/A
N/A
N/A
Total Sources of Funds
712,059
819,978
855,868
936,220
The interests of minority shareholders
N/A
7,973
7,824
4,081
TOTAL RESOURCES
1,309,615
1,761,749
1,787,916
1,782,135
Table 4.1: Balance Sheet of VINASUN from 2009 – 2012
9
Cash Flow Indirect
2009
2010
2011
2012
Cash flow from operating activities
1. Net profit before tax
143,821
239,875
177,993
204,000
2. Adjustments
117,872
173,258
340,445
393,899
- Depreciation and amortization
115,680
197,424
257,488
291,200
- Provisions
958
676
715
164
- Profit(Loss) from investing activities
-35,267
-105,441
-42,494
-10,355
- Interest expense
36,502
80,599
124,737
112,890
3.Operating profit before working capital changes
261,693
413,134
518,438
597,899
- Increase/decrease in receivables
-21,493
-51,698
-25,899
-4,344
- Increase/decrease in inventories
-625
-1,113
-1,626
-649
- Increase/decrease in payables
-12,041
40,652
-82,196
-4,448
- Increase/decrease in pre-paid expense
1,821
-11,038
-6,290
-452
- Interest paid
-36,502
-77,546
-123,788
-111,739
- Business income tax paid
-29,058
-62,929
-41,005
-48,387
- Other payments from operating activities
-16,598
-22,451
-26,348
-24,849
Net cash flow from operating activities
159,277
249,825
230,699
421,986
1. Purchases of fixed assets
-456,415
-696,509
-264,087
-298,485
Net cash flow from investing activities
-376,541
-408,481
-201,155
-283,686
1. Purchase issued shares from other entities
-1,807
-4,000
2. Repayments of financial lease
-27,575
-23,124
-46,882
-35,613
3. Dividends paid
-30,698
-54,506
-30,688
-76,014
4. Minority equity in joint venture
8,000
Net cash flow of the year
50,630
3,737
-24,510
-10,187
Table 4.2: Cash Flow of VINASUN from 2009 – 2012
10
Business Results
Unit: VND Million
2009
2010
2011
2012
Net sales
1,068,603
1,643,696
2,274,328
2,713,311
Cost of goods sold
881,627
1,380,614
1,954,709
2,257,708
Gross Profit
186,975
263,082
319,619
455,603
Operating expenses
Financial expenses
36,502
81,339
125,257
113,492
Of which: Interest expense
36,502
80,599
124,737
112,890
Cost of sales
4,549
5,895
6,849
94,025
Enterprise cost management
38,119
46,561
57,254
63,938
Total Operating Expenses
79,170
133,795
189,360
271,455
Total revenue financing activities
2,193
5,264
3,109
1,118
Net profit from business activities
109,998
134,551
133,369
185,265
Profit
33,822
105,324
44,624
18,735
Profit before tax
143,821
239,875
177,993
204,000
Cost profit
Present corporate income tax expenses
36,354
60,448
45,113
52,514
The interests of minority shareholders
N/A
-27
-149
257
Total Cost of profits
36,354
60,421
44,964
52,771
Profit after tax corporate income
107,467
179,454
133,029
151,229
Volume
19,490,000
29,999,997
29,999,997
29,999,997
Close of Quarter
17.2
18.6
13.6
18.2
EPS (*) (VND/share)
4,116.90
5,927
4,434
5,041
PE (**) (times)
2.7
3.1
3.1
3.6
Book Price (***) (Thousand VND)
23.7
27.3
28.5
31.2
Table 4.3: Business Result of VINASUN from 2009 – 2012
Description of calculation (example for year 2012):
(*) EPS (Earning per share) = Profit after tax corporate income/ average number of stocks
being in the market (volume) = 151,229,000,000/ 29,999,997 = 5,041 VND/ share.
(**) P/E (Price per earning) = Current Price/ EPS = 18,148/ 5,041 = 3.6 times
(***) Book Price = Total equity/ Volume = 936,220,000,000/ 29,999,997 = 31.207 (VND)
11
Given cash flow in negative sign (Table 4.3) but it brings back the positive trend of profit
after tax (Table 4.4). VNS has start implementing plan for investment to access new markets
to become a nationwide taxi company then subsequently maintain stable growth. Three new
markets that VNS designated to expand are Ha Noi, Nha Trang and Can Tho.
In term of capital raising plan, in a recent EGM held on August 2013, VNS planned to issue a
maximum of 3 million shares through private placement. The issuance price will be no less
than VND 44,000 with 1 year lock-in period. Its objective is to expand its operation to fulfill
its ambition to become a nationwide taxi company by increasing the scale of its taxi fleet
(initially expand to Hanoi and Nha Trang). If the private placement proves successful, VNS
will invest in 400 new vehicles in 2013 (numbers of acquired car in 2013 would increase up
to 900) and 900 new vehicles in 2014.
In the near future, VNS intends to expand its operation to the Hanoi market. Replicating the
business strategy that has garnered them the number 1 taxi company title in Ho Chi Minh
City, VNS will focus on the high quality image and brand by investing in new Toyota
Innova 7 seats in the Hanoi market (it should be noted that most of the taxis in Hanoi are 4
seat cars or mini cars). In the first phase, Vinasun plans to penetrate the corporate taxi
market, which has used Vinasun taxis in Ho Chi Minh City. However, it is easier said than
done as the taxi market in Hanoi is highly competitive (currently, there are about 17,400 taxis
in Hanoi) and taxi consumers’ habits and preferences differ from that in Ho Chi Minh (many
people in Hanoi consider taxi as a necessity, not a luxury, and prefer low taxi fee/average
quality to high taxi fee/high quality such as VNS taxi). The two biggest competitors of VNS
are Mai Linh Group and Taxi Group, who are household names in the Hanoi taxi market.
While the plan to penetrate the Hanoi market remains unclear in our view, VNS remains
persistent in its quest to invest in 300 cabs in Hanoi. In the best case scenario, it would be a
prerequisite steppingstone for VNS to become a nationwide household taxi brand. VNS is
optimistic about its expansion plan. At a recent EGM, VNS announced a financial plan until
2015 in case of the success of the private placement, in which 2015 net income will reach
VND 305 billion, implying a CAGR of 26% during the period 2012 -2015.
12
Part 5: Dividends and Valuation
From the Financial Statement for year 2009 – 2012 periods, we estimate the growth rate for
each of the following indicators:
Financial ratios:
No.
2009
2010
2011
2012
1
Assets / Total Assets
10%
11%
12%
11%
2
Long-term assets / total assets
90%
89%
88%
89%
3
Liabilities / Total assets
46%
53%
52%
47%
4
Liabilities / Equity
84%
114%
108%
90%
5
Equity / Total assets
54%
47%
48%
53%
6
Current ratio
279%
105%
121%
115%
7
Fast payment
277%
104%
119%
112%
8
Payments of short-term debt
121%
34%
23%
16%
9
Total Asset Turnover
95%
107%
128%
152%
10
Current Assets turnover
1,081%
999%
1,139%
1,322%
11
Equity Turnover
171%
215%
271%
303%
12
The Inventory Turnover
149,175%
94,563%
69,083%
56,919%
13
Profit before tax / Revenue
13%
15%
8%
8%
14
Profit after tax / Net sales
10%
11%
6%
6%
15
Profit before tax / total assets (ROA)
10%
12%
7%
8%
16
Profit after tax / Equity (ROE)
17%
23%
16%
17%
The rate of financial growth
1
Return on invested capital (ROIC)
12%
13%
7%
7%
2
Revenue growth rate
29%
53.82%
38.36%
19.30%
3
Profit per share (EPS)
121%
44%
-25%
14%
4
Equity
33%
15%
4%
9%
5
Cash
587%
6%
-39%
-26%
Income ratio
1
Cash Dividends
22%
10%
15%
20%
12
Part 5: Dividends and Valuation
From the Financial Statement for year 2009 – 2012 periods, we estimate the growth rate for
each of the following indicators:
Financial ratios:
No.
2009
2010
2011
2012
1
Assets / Total Assets
10%
11%
12%
11%
2
Long-term assets / total assets
90%
89%
88%
89%
3
Liabilities / Total assets
46%
53%
52%
47%
4
Liabilities / Equity
84%
114%
108%
90%
5
Equity / Total assets
54%
47%
48%
53%
6
Current ratio
279%
105%
121%
115%
7
Fast payment
277%
104%
119%
112%
8
Payments of short-term debt
121%
34%
23%
16%
9
Total Asset Turnover
95%
107%
128%
152%
10
Current Assets turnover
1,081%
999%
1,139%
1,322%
11
Equity Turnover
171%
215%
271%
303%
12
The Inventory Turnover
149,175%
94,563%
69,083%
56,919%
13
Profit before tax / Revenue
13%
15%
8%
8%
14
Profit after tax / Net sales
10%
11%
6%
6%
15
Profit before tax / total assets (ROA)
10%
12%
7%
8%
16
Profit after tax / Equity (ROE)
17%
23%
16%
17%
The rate of financial growth
1
Return on invested capital (ROIC)
12%
13%
7%
7%
2
Revenue growth rate
29%
53.82%
38.36%
19.30%
3
Profit per share (EPS)
121%
44%
-25%
14%
4
Equity
33%
15%
4%
9%
5
Cash
587%
6%
-39%
-26%
Income ratio
1
Cash Dividends
22%
10%
15%
20%
13
2
Share price growth
165%
8%
-27%
34%
Table 5.1: Financial Ratio of each indicator for VINASUN from 2009 – 2012
As can be seen from the table 5.1, the Current Ratio (=Current Asset/ Current Liability)
is bigger than 1 (> 1) means that the Current Assets > Liabilities, while the available short-
term Assets is greater than the short-term needs, so the financial situation of the company is
at least healthy in short-term. Furthermore, due to the Current Assets > Liabilities means that
Fixed Asset < Long-term Liabilities + Equity, therefore the Long-term Funs of the Company
is not only enough but also left over available to finance fixed assets. Fast Payment Ratio (=
Current assets – Inventory)/ Current liabilities) is also greater than 0.5 as required dedicated
the good trend with acceptable ratio of the company in term of its ability to repay the debt.
To have a better view of VINASUN’s business and its financial situation, we summarize
some basic indicators as well as make forecasting for next year as the following:
Basic Indicator
2009
2010
2011
2012
2013
2014F
Revenue (VND Billion)
1,068.60
1,643.70
2,274.33
2,713.31
3,024.74
3,327.21
Growth Rate (%)
53.82%
38.36%
19.30%
11.48%
10.00%
Profit after Tax (VND Billion)
107.47
179.45
133.03
151.23
200.00
240.00
Growth Rate (%)
66.97%
-25.86%
13.68%
32.25%
20.00%
Total Asset (VND Billion)
1,309.62
1,761.75
1,787.92
1,782.13
1,960.35
2,156.38
Growth Rate (%)
34.52%
1.49%
-0.32%
10.00%
10.00%
Equity (VND Billion)
712.06
819.98
855.87
936.13
1,029.75
1,132.72
Growth Rate (%)
15.15%
4.37%
9.38%
10.00%
10.00%
Liabilities/ Total assets
46%
53%
52.13%
47.47%
47.47%
47.47%
Profit Before Tax Ratio
13%
15%
14.05%
16.79%
19.42%
21.19%
Profit after Tax Ratio
10%
11%
5.84%
5.58%
19.42%
21.19%
EPS (VND)
4,395
5,006
4,598
5,517
ROA
10%
12%
7.49%
8.49%
10.20%
11.13%
ROE
17%
23%
15.85%
16.91%
19.42%
21.19%
Table 5.2: Summarize actual and forecasting VINASUN’s business performance
14
VINASUN posted 2012 profit of VND 2,713.31 billion and profit after tax of VND 151.23
billion. Accordingly, the company’s profit increased by 19.30% and profit increased by
13.68% compare to previous year.
Chart 5.1: Revenue and profit after Tax of VINASUN (Unit: Billion VND)
The fact trend is that profit increased faster than revenue growth because of the change in the
depreciation accounting schedule together with the benefit from the Government’s loan
subsidy. On the other hand, VINASUN may get benefit from policy of Ho Chi Minh
Transportation Department. Constraints on registration for new taxi cars cause high barriers
for new companies’ access to the market, thus protecting large incumbents like VINASUN.
According to information from VINASUN, at the end of 8/2013, parent company sales
reached about VND 2,016 billion, completed 73% plans, profit after tax reached VND 144.5
billion, fulfilling 82.3% of parent company's business plan, the ability is that VNS will
complete planned of profit after tax in September. As a result, there will have increase the
provision profits in 2013 and 2014 to VND 200 and VND 240 billion. Take advantage from
this positive trend, the author forecast the company's annual sales will be around 11.48% and
10% together with profit growth for 2013 - 2014 will be 32.25% and 20%, respectively.
The equity rose from VND 855.87 billion in 2011 to VND 936.13 billion in 2012 means rose
by 9.38% and expected continuously increase in 2013 – 2014 period by 10% constantly.
While Liabilities/Total assets went up from 52.13% to 47.47% from 2011 to 2012,
1,068.60
1,643.70
107.47
0.00
500.00
1,000.00
1,500.00
2,000.00
2,500.00
3,000.00
3,500.00
2009
14
VINASUN posted 2012 profit of VND 2,713.31 billion and profit after tax of VND 151.23
billion. Accordingly, the company’s profit increased by 19.30% and profit increased by
13.68% compare to previous year.
Chart 5.1: Revenue and profit after Tax of VINASUN (Unit: Billion VND)
The fact trend is that profit increased faster than revenue growth because of the change in the
depreciation accounting schedule together with the benefit from the Government’s loan
subsidy. On the other hand, VINASUN may get benefit from policy of Ho Chi Minh
Transportation Department. Constraints on registration for new taxi cars cause high barriers
for new companies’ access to the market, thus protecting large incumbents like VINASUN.
According to information from VINASUN, at the end of 8/2013, parent company sales
reached about VND 2,016 billion, completed 73% plans, profit after tax reached VND 144.5
billion, fulfilling 82.3% of parent company's business plan, the ability is that VNS will
complete planned of profit after tax in September. As a result, there will have increase the
provision profits in 2013 and 2014 to VND 200 and VND 240 billion. Take advantage from
this positive trend, the author forecast the company's annual sales will be around 11.48% and
10% together with profit growth for 2013 - 2014 will be 32.25% and 20%, respectively.
The equity rose from VND 855.87 billion in 2011 to VND 936.13 billion in 2012 means rose
by 9.38% and expected continuously increase in 2013 – 2014 period by 10% constantly.
While Liabilities/Total assets went up from 52.13% to 47.47% from 2011 to 2012,
1,643.70
2,274.33
2,713.31
3,024.74
3,327.21
107.47
179.45
133.03
151.23
200
2010
2011
2012
2013
2014F
Revenue
Profits after Tax
14
VINASUN posted 2012 profit of VND 2,713.31 billion and profit after tax of VND 151.23
billion. Accordingly, the company’s profit increased by 19.30% and profit increased by
13.68% compare to previous year.
Chart 5.1: Revenue and profit after Tax of VINASUN (Unit: Billion VND)
The fact trend is that profit increased faster than revenue growth because of the change in the
depreciation accounting schedule together with the benefit from the Government’s loan
subsidy. On the other hand, VINASUN may get benefit from policy of Ho Chi Minh
Transportation Department. Constraints on registration for new taxi cars cause high barriers
for new companies’ access to the market, thus protecting large incumbents like VINASUN.
According to information from VINASUN, at the end of 8/2013, parent company sales
reached about VND 2,016 billion, completed 73% plans, profit after tax reached VND 144.5
billion, fulfilling 82.3% of parent company's business plan, the ability is that VNS will
complete planned of profit after tax in September. As a result, there will have increase the
provision profits in 2013 and 2014 to VND 200 and VND 240 billion. Take advantage from
this positive trend, the author forecast the company's annual sales will be around 11.48% and
10% together with profit growth for 2013 - 2014 will be 32.25% and 20%, respectively.
The equity rose from VND 855.87 billion in 2011 to VND 936.13 billion in 2012 means rose
by 9.38% and expected continuously increase in 2013 – 2014 period by 10% constantly.
While Liabilities/Total assets went up from 52.13% to 47.47% from 2011 to 2012,
3,327.21
240
2014F
15
respectively. Since VNS’s property development at Tan Da Trading Centre – 7,005sqm GLA
- started generating rental revenues from Q1/2011. VNS estimates this centre brought in
annual net profit of VND10 billion. Total development costs are VND48 billion.
Chart 5.2: Growth in ROA and ROE of VINASUN from 2009 – 2014F (Unit: %)
Dramatically growth in profits make ROE and ROA improved significantly over the years,
reflecting the improving capital efficiency, and make VNS’s stocks become more attractive.
Another factor supporting this results including:
Firstly, the profit’s picture becomes brighter. The adjustment to depreciation period helped
somewhat reflect exactly performance of the business of VINASUN. However, due to
accounting depreciation faster than last year in the next five years, so VINASUN still get
some surge profits from the liquidation of car due to the remaining value of the car equal to
zero.
Secondly, the property does not serve business activities accounted for nearly 20% of total
asset has been liquidated in 2010. Property investment accounts for nearly 200 billion is the
use of land of 717.1 m
2
in Thu Khoa Huan, District 1 and 2.739 m
2
of land in Truong Dinh
Hoi, Ward 16, District 8. This property has not really brought the good performance to the
company over the years. Thus, the liquidation of the land in 2010 Thu Khoa Huan brough a
10
12
17
23
0
5
10
15
20
25
2009
2010
15
respectively. Since VNS’s property development at Tan Da Trading Centre – 7,005sqm GLA
- started generating rental revenues from Q1/2011. VNS estimates this centre brought in
annual net profit of VND10 billion. Total development costs are VND48 billion.
Chart 5.2: Growth in ROA and ROE of VINASUN from 2009 – 2014F (Unit: %)
Dramatically growth in profits make ROE and ROA improved significantly over the years,
reflecting the improving capital efficiency, and make VNS’s stocks become more attractive.
Another factor supporting this results including:
Firstly, the profit’s picture becomes brighter. The adjustment to depreciation period helped
somewhat reflect exactly performance of the business of VINASUN. However, due to
accounting depreciation faster than last year in the next five years, so VINASUN still get
some surge profits from the liquidation of car due to the remaining value of the car equal to
zero.
Secondly, the property does not serve business activities accounted for nearly 20% of total
asset has been liquidated in 2010. Property investment accounts for nearly 200 billion is the
use of land of 717.1 m
2
in Thu Khoa Huan, District 1 and 2.739 m
2
of land in Truong Dinh
Hoi, Ward 16, District 8. This property has not really brought the good performance to the
company over the years. Thus, the liquidation of the land in 2010 Thu Khoa Huan brough a
12
7.49
8.49
10.2
11.13
23
15.85
16.91
19.42
21.19
2010
2011
2012
2013
2014F
15
respectively. Since VNS’s property development at Tan Da Trading Centre – 7,005sqm GLA
- started generating rental revenues from Q1/2011. VNS estimates this centre brought in
annual net profit of VND10 billion. Total development costs are VND48 billion.
Chart 5.2: Growth in ROA and ROE of VINASUN from 2009 – 2014F (Unit: %)
Dramatically growth in profits make ROE and ROA improved significantly over the years,
reflecting the improving capital efficiency, and make VNS’s stocks become more attractive.
Another factor supporting this results including:
Firstly, the profit’s picture becomes brighter. The adjustment to depreciation period helped
somewhat reflect exactly performance of the business of VINASUN. However, due to
accounting depreciation faster than last year in the next five years, so VINASUN still get
some surge profits from the liquidation of car due to the remaining value of the car equal to
zero.
Secondly, the property does not serve business activities accounted for nearly 20% of total
asset has been liquidated in 2010. Property investment accounts for nearly 200 billion is the
use of land of 717.1 m
2
in Thu Khoa Huan, District 1 and 2.739 m
2
of land in Truong Dinh
Hoi, Ward 16, District 8. This property has not really brought the good performance to the
company over the years. Thus, the liquidation of the land in 2010 Thu Khoa Huan brough a
11.13
21.19
ROA
ROE
16
profit surge for VINASUN and help the main business activity increase by 20% effect from
re-investment. Expected profits after-tax from the sale of the land were about VND 70-80
billion.
Third, promote the efficiency of financial leverage. Characteristic of the taxi business is large
fixed costs due to the initial investment system vehicles for main business operations.
Structure of equity capital of approximately 30% - 50% is considered successful in the use of
financial leverage. VINASUN’s debt/equity rate accounted for 70.44% and debt/ total capital
was 38.3% did for the return on equity is significantly improved, from 15.85% in 2011 to
16.91% in 2009, and continuously expected increase to 19.24% and 21.19% in 2013 and
2014, respectively.
In term of peers comparison in the same industry within 10 most competitors, VNS stands
at leading price among stocks with VND 50,000 at average volume of 8,000 stocks being in
the market. However, at currently, the most power in transportation industry goes to VIP
account for 71.70% while VNS standing at 5
th
with 42.90%.
No.
Symbol
+/-
Volume
EPS
P/E
ROE
P/B
Beta
Power
1
HCT
6.4
(0)
0
991
6.5
10%
32%
0
56.80%
2
VNS
50
(0)
8,000
5,899
8.5
0%
166%
0.1
42.90%
3
TCO
10.3
(0.1)
3,040
2,007
5.1
16%
83%
-0.2
54.70%
4
HHG
3.4
(0.1)
200
-334
-10.2
-4%
36%
1.8
33.10%
5
PCT
3.9
(0.1)
33,973
349
11.2
3%
37%
0.8
53.80%
6
VNL
14.8
(0.4)
6,610
2,545
5.8
15%
86%
-0.3
57.60%
7
DL1
6.2
(0.1)
28,000
1,151
5.4
6%
36%
-0.3
63.30%
17
8
VIP
8.7
(-0.2)
795,250
2,466
3.5
15%
52%
1.7
71.70%
9
GMD
30.9
(-0.7)
551,660
1,890
16.3
5%
78%
1.7
57.70%
10
GTT
12.1
(0.1)
101,400
-27
-448.1
0%
117%
1
31.90%
Table 5.3: Peers comparison with VINASUN in the same industry
Industry
Comparison
+/-
EPS
PE
ROA
ROE
Price
AVG
Book
Value
P/B
Beta
Total
Shares
Outstanding
Market
Capital
(Billion)
Transportation/
Warehouse/Taxi
178.9
(-1.2)
2,845
9
6%
6%
25.5
24.2
99%
0.8
1,143,680,883
29.225
VNS
50
(0)
5,899
8.5
10%
0%
50
30.2
166%
0.1
40,500,000
2,025
[Source: Cophieu68.vn]
As can be seen from the table above, VNS stand at high price compare to the whole industry.
VNS keep maintaining good performance in the stock market and consider prosperous stock
to be invested in the future as well.
Part 6: Conclusion and recommendation
From analysis with above explanations, the author recommend to investors should buy VNS
stock at price of VND 51.000 – 51,900. Taxi transport has great potential in Vietnam due to
increasing population size and life-style is increasingly improved. VINASUN is the market
leading taxi transport services in the Southern region, thanks to the powerful car with good
competitive strategy. Nevertheless, the liquidity and volatility of the VNS’s stock market is
not too much, so the next major shareholders holding approximately 80% owned by the
company and the nature of the activities VINASUN does not contain elements mutagenic.
The author raised profit forecasts in 2013 and 2014 to VND 200 and VND 240 billion which
is lower than the estimate given in the Board Meeting.
18
On 27/08/2013, an extraordinary of General Shareholders' Meeting year 2013 of the
Vietnam Sun Corporation – VINASUN has been carried out successfully. Accordingly,
important content is the proposal to the General Shareholders' Meeting consulted about the
issuance of 3,000,000 shares separately, the minimum issued price was VND 44,000/ stock
to raise capital to finance further investment on vehicle plans business development in
existing areas and new areas in 2013-2014. Specifically:
- In 2013, VNS invested additional 400 vehicles besides the investment of 500 units
has been approved by General Shareholders' Meeting in 4/2013. And in 2014, VNS
will invest additional 900 new cars. Markets to increase cars are Ho Chi Minh City,
Binh Duong, Dong Nai, Vung Tau, Da Nang and expand to new markets.
- Separately issued shares this time will be limited to transfer within 1 year from the
date of completion of the offering. Subjects offered are major investors (numbers are
less than 10 investors) which do not distinguish new shareholders or existing
shareholders.
Accordingly, the cash flow in the coming year of VNS is adjusted as follows:
Unit: VND Billion
2013
2014
2015
2016
2017
Revenue
3,327.21
3,659.93
4,025.92
4,428.51
4,871.37
Profit after Tax
240.00
266.40
295.70
328.70
364.34
Interest (1-T)
103.14
113.46
124.8
137.28
151.01
Depreciation
106.47
117.12
128.83
141.71
155.01
Investment to fixed asset
163.03
179.34
197.27
217.00
238.70
Investment to liability
136.42
150.06
165.06
181.57
199.73
Free Cash Flow
150.17
167.58
187.00
208.66
232.81
Value of the firm after 2017
2,196.32
Value of the firm
2,888.36
Value of debt
784.87
Number of shares
40,499,818
Target Price/ share (VND)
51,938
Table 6.1: Forecasted Cash flow in the next 4 years
19
Applying Discounted Cash Flow (DCF) method with 19.4% WACC, the author valuate
VNS’ share at VND 51,938. The author believes that the DCF model is most suitable to
value the share because:
- VNS is the only listed company in the taxi sector, which implies relative value
methodology is infeasible.
- DCF model allows us to capture the effect of extraordinary income in the next one or
two years from liquidation of asset without letting these earnings distort the
overall valuation,
- Calculate the investment in the vehicle fleet in detail over the coming years.
Expected number of vehicles was stable at 4,200 in the end of the project period and date is
estimate based on project in year 2013. New fixed asset are sufficient to replace liquidated
fixed asset.
Business plan of VINASUN:
Items (Unit: VND Million)
2011
2012
2013
2014
Total Revenue
2,178,500
2,589,800
3,358,700
3,853,000
Net Revenue
-
-
-
-
Total profit before tax
215,020
165,170
325,000
391,000
Profit after tax
161,270
123,870
253,000
305,000
Dividend Rate (%)
15
0
30
20
Earnings Per Share (EPS)
-
-
-
-
Table 6.2: Business plan of VINASUN
In year 2014, VINASUN’s plan revenue of VND 3,853 billion, up to 14.8%, profit before tax
VND 391 billion, an increase of 20.2%, profit after tax reached VND 305 billion, up to
20.3% compared in 2013. Dividends plan expected 20.0% in 2014/ face value price.
From above analysis, the author has strong recommendation for investors pay attention to
invest into VNS. It will bring to them positive sign for their long-term benefit.
20
References
1. Baomoi.com (2012). Vinasun du kien loi nhuan nam 2013 o muc 179,5 ty dong, tang
18,5% so voi thu chien nam 2012. Retrieved from />du-kien-loi-nhuan-nam-2013-o-muc-1795-ty-dong-tang-185-so-voi-thuc-hien-nam-
2012/127/10849765.epi.
2. Cophieu68 (2011) VIETNAM SUN CORPORATION. Retrieved from
/>3. Dau tu chung khoan (2013). VNS – Co phieu dau nganh Taxi. Retrieved from:
/>4. Stockbiz.vn (2009). Vietnam Sun Corporation (VNS: HOSE). Retrieved from:
/>5. Thu Vo (2010). Vinasun, Mekong Securities.
6. Trang, Vu Thi Thu (2013). Bao cao cap nhat cong ty co phan Anh Duong Viet Nam
(VNS-HOSE).
7. Vinasun Corp. (2010 – 2011). Vinasun Corp top 50 cong ty niem yet tot nhat.
Retrived from />corp-top-50-cong-ty-niem-yet-tot-nhat
8. Vietcombank Security (2007). Thong tin doanh nghiep/ Cong ty Co phan Anh Duong
Viet Nam. Retrieved from:
/>9. Viet Capital Securities (2010). Vietnam Sun Corporation (VINASUN) Consumer
Service – VNS (HOSE).