the interaction between the frequency of market quotes spread and volatility in forex
Bạn đang xem bản rút gọn của tài liệu. Xem và tải ngay bản đầy đủ của tài liệu tại đây (303.87 KB, 10 trang )
Applied Economics, 1996, 28, 377—386
The interaction between the frequency of
market quotations, spread and volatility
in the foreign exchange market
ANTONIS A. DEMOS and CHARLES A. E. GOODHART
Department of Economics, ºniversity of Reading, P.O. Box 218, ¼hiteknights, Reading
RG62AA, ºK and Department of Economics, ¸ondon School of Economics, Financial
Markets Group, Houghton St, ¸ondon ¼C2A 2AE, ºK
There is an empirical relationship between volatility, average spread, and number of
quotations in the foreign exchange spot market. The estimation procedure involves
two steps. In the first one the optimal functional form between these variables is
determined through a maximization procedure of the unrestricted VAR, involving the
Box—Cox transformation. The second step uses the two-stage least squares method to
estimate the transformed variables in a simultaneous equation system framework. The
results indicate that the number of quotations successfully approximates activity in
the spot market. Furthermore, the number of quotations and temporal dummies
reduce significantly the conditional heteroskedasticity effect. We also discuss informa-
tion aspects of the model as well as its implications for financial informational
theories. Inter- and intra-day patterns of the three variables are also revealed.
I. INTRODUCTION
It is common in the literature for variations in the arrival of
‘news’ in financial markets to be measured directly from the
data on the volatility of prices/returns. [See, for example,
Engle and Ng (1991)]. In one sense this approach assumes
what needs to be tested, i.e. that ‘news’ drives volatility.
Moreover, the ARCH effects commonly found in such
financial series, [see Bollerslev et al. (1992)], may well rep-
resent some combination of the autoregressive character-
istics of ‘news’ arrival, i.e. the bunching of ‘news’, and of
‘pure’ market volatility. Given the theoretical results on
the mixtures-of-distributions hypothesis by Clark (1973),
Tauchen and Pitts (1983), and Andersen (1991) among
others, when time is measured in calendar time, the condi-
tional variance of returns will be an increasing function of
the actual number of information arrivals [see Bollerslev
and Domowitz (1991)].
A number of questions follow. The first is what indicator
of information arrival to use. One possibility would be to try
to exploit the data available over the ‘news’ pages on the
electronic screens, for example, Reuters AAMM page of
‘news’ of interest to market dealers [see Goodhart (1990),
Goodhart et al. (1991)]. The construction of any such index
would undoubtedly be somewhat subjective, and extremely
laborious, but could still be worth attempting at a later
stage.
Another way is to follow previous studies of mixture of
distributions [see, for example, Harris (1987), Gallant et al.
(1989) and (1990), and Laux and Ng (1991)] and use volume
as a proxy for the number of information events. However,
Jones, Kaul and Lipson (1991) show that volume is a noisy
and imperfect proxy for information arrival, and that the
number of transactions is a better variable in a model with
a fixed number of traders. However, there are no volume
data available in the forex market [see, for example Good-
hart and Demos (1990)]. Instead the frequency of quote
arrivals over Reuters’ screens is used as the proxy for market
activity. This may capture the effect of market activity on
volatility, up to the extent that news is reflected in changes
in current market activity.
The next question is whether it is permissible and appro-
priate to examine the contemporaneous interaction between
quote arrival and volatility, or only to relate volatility to
quote arrival using information available at t!1 and
earlier. The previous literature indicates that this decision is
important. The results using information on market activ-
ity, whether quote frequency or volume, at t!1 and earlier
suggest that such data has no significant ability to predict
volatility, given past data on volatility, [for example, Jones,
0003—6846 1996 Chapman & Hall 377
Kaul and Lipson (1991), Lamoureux and Lastrapes (1990),
Bollerslev and Domowitz (1991)]. On the other hand,
Lamoureux and Lastrapes (1990) and Laux and Ng (1991)
find that the use of contemporaneous data on market activity
virtually removes all persistence in the conditional variance
in their series, being daily stock returns and intra-day cur-
rency future returns respectively. Bollerslev and Domowitz
(1991) doubt the validity of using contemporaneous data on
the grounds of simultaneity and that the traders informa-
tion set does not include contemporaneous data on market
activity. Simultaneity is dealt with by using a simultaneous
equation system estimation procedure. With respect to the
second objection, market traders’ way of life is watching the
screen, so they will be virtually instantaneously aware of
a change in the speed of flow of new quotes. Furthermore, it
is argued that the entry of a quote on the screen must
have both temporal and causal priority over volatility
developments, since the latter can only be estimated
once decisions to enter a new quote have been taken
and executed. Hence the hypothesis is that, in this ultra-
high frequency data set, the ‘causal’ linkages will be
found to be stronger from quote frequency to volatility
when both are taken over the same short time interval, than
vice versa.
Here we examine international patterns of intra-day trad-
ing activity and some properties of the time series of returns
for the Deutschemark/Dollar and Yen/Dollar exchange
rates in the foreign exchange market through the interbank
trade. The purpose is to provide some information useful in
the further development of the microstructure of trading
models and to compare the empirical results with previous
ones and theoretical models already in existence.
The results in Bollerslev and Domowitz (1991) are ex-
tended in two different ways. First, certain arguments are
outlined (in Section III) explaining why quote frequency
data might be better entered in log, rather than in numer-
ical, form, and we search for the best fitting transformation
of the data using the Box—Cox transformation. Second, in
Goodhart and Demos (1990), we argue that there are certain
predictable temporal regularities in the foreign exchange
market (for example, the regular release of economic data at
certain pre-announced times, the passage of the market
through the time zones punctuated by market openings and
lunch breaks (especially in Tokyo)). Consequently temporal
weekly, daily and half-hourly dummies are added to all
equations. As will be shown in Section III, these two cha-
nges do make a difference to the results. The conditioning of
the variables of interest on such temporal dummies allows
us to distinguish between public and private information,
something of great importance to informational theories of
market micro-structure (see, for example, Admati and
Pfleiderer (1988), Son (1991), etc.).
Although the emphasis here is on the relationship be-
tween quote frequency and volatility, since it is a less-re-
searched area, we examine the three-fold interrelationships
between quote frequency, volatility and bid-ask spreads.
The positive relationship between volatility and the spread
is well-known in the literature [see, for example, Ho
and Stoll (1983) and Berkman (1991)]. We suggested
earlier that the absence of any significant ability of
prior quote frequency to predict volatility implied that
volatility may have incorporated both the contempor-
aneous evidence from quote arrivals and other sources of
information. If so, we would not expect quote arrivals, either
contemporaneous or lagged, to influence spreads, given
volatility.
Where, however, one might find some relationship be-
tween spreads and quote frequency would be among the
constant temporal dummy variables. Whereas some sources
of news are continuously unfolding, the market has a pat-
tern of openings, lunch breaks, and closes, which might
influence both quote frequency and spreads, independently
of the pattern of price/return volatility. The work of Oldfield
and Rogalski (1980), Wood, McInish and Ord (1985),
French and Roll (1986), and Harris (1986) among others
have stimulated considerable interest in documenting the
pattern of stock market returns and their variances around
the clock. Admati and Pfleiderer (1988), and Foster and
Viswanathan (1990) offer some theoretical explanations for
some of these empirical findings. Here we aim to extend this
work by looking also at the temporal patterns of quote
frequency and spreads. We examine the relationship be-
tween the sets of temporal dummy variables in Section IV.
We conclude in Section V.
II. THE DATA SET
The continuously quoted data are divided into discrete
segments in the following way. The 24-hour weekday is
divided into 48 half-hour intervals and the average spread,
standard deviation of the percentage first difference of the
rates quoted (ln(e
R
)!ln(e
R\
)), and the number of new
quotations within this interval are recorded. In a few instan-
ces there were too few observations in a half-hour to calcu-
late a meaningful estimate of volatility. In such cases we
substituted the values for the lowest calculable observed
volatility, and the accompanying spread, in a half-hour of
that week. This resulted in around potentially 2500 half-
hourly observations. In fact, 5 out of the 12 weeks were
chosen for analysis, avoiding any weeks with public hol-
idays in the main country participants. The results are
robust to this choice.
At this point we should review some pitfalls associated
with the approximation of market activity by the number of
quotations. Market participants have claimed that during
very busy periods traders may be too occupied in dealing
through their telephones to update their screens immediate-
ly (see Goodhart and Demos (1990)). Per contra, when the
market is dull some market participants may enter new
378 A. A. Demos and C. A. E. Goodhart
We avoided Full Information Maximum Likelihood estimation on the grounds of the strong non-normality of the residuals (see below).
Table 1. Quasi log-likelihood values as a function of the Box—Cox exponent
DEM JPY
*
R
sp*
R
n*
R
*
R
sp*
R
n*
R
Log- Log- Log- Log- Log- Log-
likelihood likelihood likelihood likelihood likelihood likelihood
1.0 !1304.8 !1675.5 !5395.5 1.0 !1699.8 !1736.9 !5202.1
0.5 !1053.3 !1532.9 ؊ 5170.2 0.5 !1386.8 !1706.4 !4894.5
0.3 !1012.7 !1489.6 !5228.3 0.4 !1353.6 !1703.9 ؊ 4882.1
0.2 ؊ 1008.6 !1470.4 !5311.9 0.3 !1330.3 !1702.3 !4894.1
0.1 !1016.9 !1452.6 !5438.0 0.2 !1316.8 ؊ 1701.9 !4934.2
0.0 !1040.9 !1436.2 !5607.8 0.1 ؊ 1312.9 !1702.7 !5005.8
!0.5 !1429.9 !1375.0 !6990.1 0.0 !1314.9 !1703.9 !5110.8
!1.0 !2255.8 ؊ 1350.2 !8867.4
!2.0 !4525.9 !1385.2 !13 130.0
Note: Bold indicates the optimum .
quotes to generate some business. However, in general
the temporal pattern of the markets may differ from the
temporal pattern of the ‘news’ generation process. Markets
often close almost entirely, for example, at weekends and
over the Tokyo lunch hour, or become very busy, while
some ‘news’ is continuously occurring. Although we would
expect more ‘news’ always to be associated with a higher
frequency of quotes, as long as some markets are in opera-
tion, the functional form of this relationship, for example,
linear, log-linear, etc., remains unknown.
III. ESTIMATION AND RESULTS
The following Simultaneous Equation System (SES) is to be
estimated:
R
"Dummies#
sp
R
#
n
R
#
R\
#
R\
(1.a)
sp
R
"Dummies#
R
#
n
R
#
sp
R\
#
sp
R\
(1.b)
n
R
"Dummies#
R
#
sp
R
#
n
R\
#
n
R\
(1.c)
where
R
, sp
R
, and n
R
are the standard deviation of the
percentage change of an exchange rate, the average
spread, and the number of quotations within the tth half-
hour interval, and the system is separately estimated
for the two currencies under interest, i.e. the Deutschemark
and Japanese Yen, against the US dollar. As financial
time series suffer from conditional heteroskedasticity
effects, we include lagged dependent variables in Equations
1.a to 1.c. Moreover this helps in the identification of
the system. The estimation method is two-stage least
squares.
The functional form of the relationship between these
variables needs careful consideration. There is no apparent
reason why the average spread, volatility, and number of
quotations should be linearly related, rather than, say, log-
linearly. On theoretical grounds both functional relation-
ships would have the same characteristics as discussed in
Sections I and II. Hence, we left the data to decide on this by
using the following procedure.
We first transformed the three variables using the
Box—Cox transformation. The reduced form of the SES is
a restricted Vector Autoregression (VAR) of order 2; we
estimated the unrestricted form for each currency for differ-
ent values of the Box—Cox exponent, i.e. the following
VAR(2) was estimated for different values of
,
, and
(the exponents):
*
R
sp*
R
n*
R
"Dm.#
*
R\
sp*
R\
n*
R\
#
*
R\
sp*
R\
n*
R\
#
R
R
R
where *
R
"(A
R
!1)/
, sp*
R
"(spA
R
!1)/
, and
n*
R
"(nA
R
!1)/
. Notice that for
"
"
"1, and
"
"
"0 we have the linear and log-linear forms,
respectively.
In Table 1 we present the values of the quasi log-likeli-
hood function for the transformed variables, for different,
but common across the three variables, values of .Itis
immediately apparent that the optimal value of depends
on the variable and the currency. However, notice that the
Interaction between quotations, spread, and volatility in FOREX 379
Table 2. Estimated coefficients and standard errors of the structural system (2.2)
DEM
L
GH
i/j 1234 56
1 9.146 0.012 0.210 !0.002
(5.611) (1.656) (3.678) (!0.111)
2 0.012 0.000 0.398 0.108 0.079
(1.641) (0.393) (5.565) (2.697) (2.510)
3 !0.004 5.424 0.496 0.111
(!0.00) (0.344) (13.56) (3.282)
JPY
ˆ
GH
i/j 1234 56
1 0.629 0.028 0.189 0.007
(5.340) (2.189) (4.137) (0.227)
2 0.291 !0.007 0.296 0.095 0.088
(3.129) (!0.881) (5.597) (2.162) (2.683)
3 1.022 !0.805 0.457 0.038
(1.091) (!0.781) (11.58) (1.217)
Note: Heteroskedasticity robust t-statistics are in parentheses.
log-likelihood function appears to be unimodal, with
respect to the parameter , at least for values between 1
and !2 for the Deutschemark, and 1 and 0 for the Yen.
What we are doing here in effect is a grid search of the
pseudo-likelihood function with respect to the parameter.
Although we chose the steps of the grid to be 0.05, in Table 1
only some representative values of the log-likelihood func-
tion are reported, for two reasons. First, the likelihood
function is not very flat around the optimum, with the
possible exception of the Yen average spread equation, and
second, because of space considerations.
The optimal values for the Deutschemark are
"0.2,
"!1,
"0.5, and for the Yen
"0.1,
"0.2, and
"0.4. We did a second grid search but this time we kept
one of the s constant at its optimum value, say
, and
varying simultaneously the values of the other ’s,
and
,
around their optimal, using a step length of 0.01. For both
currencies the optimum values of ’s stayed as above. Hence,
it seems that neither the linear nor the log-linear functional
forms are the best approximations to the data generating
process functionals. However, from Table 1 it is apparent
that the log-linear form is a better approximation than the
linear one, with the possible exception of the number of
quotations for the Deutschemark.
Diagnostic tests on this simultaneous system are reported
in Appendix A. In particular, the Wu (1973) and Hausman
(1978) F tests for exogeneity of the three variables, with one
exception, are rejected. However, the tests for the omission
of relevant lagged variables could not reject, at least for the
spread equation (see Appendix A), so we included one more
lag in this equation.
Consequently, we estimated the following SES by two-
stage least squares. The estimates of the structural para-
meters and their heteroskedasticity robust standard errors
are presented in Table 2.
*
R
"Dummies#
sp*
R
#
n*
R
#
*
R\
#
*
R\
(2.a)
sp*
R
"Dummies#
*
R
#
n*
R
#
sp*
R\
#
sp*
R\
#
sp*
R\
(2.b)
n*
R
"Dummies#
*
R
#
sp*
R
#
n*
R\
#
n*
R\
(2.c)
Some important points emerge from this table. First, the
results are quite robust across the two currencies, although
the functional form of the variable is different. Second,
notice that in the volatility equation (Equation 2.a) the
average spread and the number of quotations have a strong
positive effect on volatility. These positive relationships
of spread-volatility and volatility-activity are well-
documented facts in the literature. Ho and Stoll (1983),
Berkman (1991), as well as the probit model of Hausman,
Lo and MacKinley (1991) of trade by trade stock market
data document the first relationship, whereas Lamoureux
and Lastrapes (1990) and Laux and Ng (1991) support the
second. The second relationship also supports the model of
Brock and Kleidon (1990) where the link between variations
in demand and the variability of prices is through variations
in the bid and ask prices.
In the average spread equation (Equation 2.b) the number
of observations is insignificant. This justifies our earlier
hypothesis that volatility has incorporated both the con-
temporaneous evidence from quote arrivals and other
sources of information and consequently quote arrivals do
not influence spread, given volatility.
380 A. A. Demos and C. A. E. Goodhart
Table 3. Estimated coefficients and standard errors of the structural system (2.2) without dummy
variables
DEM
L
GH
i/j 12 3 4 56
1 7.637 0.006 0.267 0.109
(7.213) (2.809) (4.897) (3.019)
2 0.007 0.000 0.489 0.176 0.114
(1.651) (1.650) (9.243) (4.126) (3.770)
3 !3.237 38.196 1.051 !0.192
(!2.155) (1.803) (33.73) (!5.692)
JPY
ˆ
GH
i/j 12 34 56
1 0.483 0.011 0.303 0.085
(6.473) (2.770) (7.240) (3.012)
2 0.153 0.002 0.369 0.173 0.147
(2.639) (1.112) (7.743) (3.757) (4.009)
3 !2.380 2.578 0.976 !0.233
(!2.876) (2.908) (28.81) (!6.359)
Note: Heteroskedasticity robust t-statistics are in parentheses.
In the number of quotations equation (Equation 2.c)
volatility and average spread are highly insignificant. This
implies that there may be some kind of ‘causation’ from the
number of quotations to volatility and some kind of feed-
back relationship between volatility and average spread.
However, the number of observations is not weakly
exogenous to the system as the variance covariance matrix
of the residuals is not diagonal. In fact, the correlation
matrix of the residuals of the system (Equation 2.a to 2.c) is
presented in Table 4.
Hence, we conclude that, apart from the residual effects,
volatility and average spread are simultaneously deter-
mined and there may be a feedback rule between number of
quotations and volatility. However, the number of quota-
tions affects the average spread process through volatility
only. This relationship is stronger for the Yen than for the
Deutschemark.
Furthermore, notice that the second lagged volatility in
Equation 2.a is insignificant, and the coefficient estimate of
the first lag has a very low value (around 0.2 for both
currencies), which implies a very weak autoregressive condi-
tional heteroskedasticity effect. However, this is not the case
when average spread and number of observations are ex-
cluded from this equation. In such a case the OLS estimates
of the first and second lag volatility, of the regression of
volatility on Dummies and 2 lagged volatilities, equal 0.322
(6.079), and 0.070 (1.746) for the Mark and 0.319 (7.237), and
0.0717 (2.206) for the Yen (the robust t-statistics are in
parentheses). This implies that these two variables take out
a considerable amount of the conditional heteroskedasticity
effect observed in exchange rate time series. This points out
to the fact that heteroskedasticity type effects, which cap-
tured by ARCH or GARCH type models in a univariate
setups, are mainly due to missing variables in the econo-
metrician’s information set.
Moreover, the addition of our dummy variables further
reduces the second order ARCH type effect in the series. If
the SES (Equations 2.a to 2.c) is estimated without the
dummy variables the results exhibited in Table 3 are
obtained.
Now the first lag estimated coefficient takes a consider-
ably higher value than in the case where dummy variables
are included, and the second lag coefficient becomes signifi-
cant. Notice also that now in the number of quotations
equation volatility has a strong negative effect, something
which is also documented in Bollerslev and Domowitz
(1991), where the dummy variables are excluded from their
model.
To conclude this section we can say that the simultaneity
and the inclusion of dummy variables capture a consider-
able part of heteroskedasticity type effect, observed ex-
change rate markets. This in effect is due to unobservable
news reflected either in the bid-ask spread or in the dummy
variables which are responsible for changes in traders’ de-
sired inventory positions with the result of changing
spreads, according with the theories of O’Hara and Oldfield
(1986) and Amihud and Mendelson (1980). These changes in
spread can explain a considerable part of volatility move-
ments, and consequently decreasing the heteroskedasticity
type effects.
IV. TEMPORAL HALF-HOURLY EFFECTS
The temporal dummies capture events (publicly announced
news releases, market openings and closings) whose timing,
Interaction between quotations, spread, and volatility in FOREX 381
See Table 5 is Demos and Goodhart (1992).
though not generally their exact scale, is known in advance.
Public new related to macroeconomic variables is simulta-
neously announced to all traders, at a time known in ad-
vance since the scheduled time of all economic related news
is predetermined, and reported on another part of the
Reuters system, the FXNB page. The stochastic element in
such cases is the actual announcement, not the timing of it.
In general, the majority of the US announcements are
around 13:30 hours British Summer Time (BST), and the
German ones around 10:00 hours BST. Consequently, the
relationship between the dummy variables and the charac-
teristics of interest to us in the market predominantly reflect
response of these variables to publicly known events. Per
contra, the relationship between these variables, after condi-
tioning on such temporal constants, will primarily reflect
private information to a somewhat greater extent.
Notice that the constant represents the last half hour of
the last Friday in the sample. During this half hour all the
main markets are closed and only a few traders, if any at all,
input quotations. Therefore, the constant in the estimation
reflects, on average, the smallest number of observations in
the sample, but not necessarily the lowest level of volatility
or the smallest average spread. Let us now concentrate on
these dummy effects.
The estimated dummy coefficients, for both currencies
and per equation, are not presented here because of space
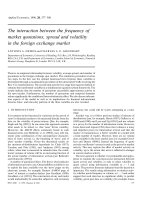
considerations. Let us consider the half hour dummies first.
In graphs 1a to 3b in Figure 1 the values of the estimated
dummy coefficients for both currencies are presented. They
reveal an interesting feature. In the last part of the day BST
time, from about the closing time of the European ex-
changes and until the closing time of the New York ex-
change, volatility is unusually high. Notice that this takes
place in both currency markets.
During this period there are few, or no, economic (or
other public) announcements from Europe or Asia (consid-
ering only Japan). Most US economic announcements are
made before the opening of the New York Stock Exchange,
at 13.30 BST. There is a small spike at the relevant half hour
(27), but this remains quite small compared with the higher
volatilities apparent later on in the US market day.
Hence, it seems that public news is not the explanation of
this volatility increase. Furthermore, this increase seems
even more difficult to explain in the light of the Admati and
Pfleiderer (1988) theory. During this period we certainly
have a reduction in the number of traders in the market, as
only the New York exchange is in operation, so this increase
can hardly be attributed to an increase in the number of
liquidity traders.
There is then an apparent decrease in volatility for both
currencies, during the early morning period between 1:30
and 3:30 (BST). Most of the economic-related news for the
Japanese economy is announced either early in the Japanese
morning, i.e. around 1:00 BST, or in the late Japanese
afternoon, i.e. 6:00 BST. The same time period is character-
ized by high spread and screen activity. However, it appears
that Japanese economic-related news has no effect on the
volatility of the JPY currency. Although in line with the
results of Ito and Rolley (1987), this remains peculiar. Fur-
thermore, the same is true for the Deutschemark in relation
to German economic announcements, which are mostly
released either around 9:30 or 14:00 BST. Hence, it seems
that only US economic news affects the variability of DEM
and JPY exchange rates.
There is a further curiosity in the half-hourly dummies
which is worth mentioning. During the Tokyo lunch time
break (4:00—5:00 BST) there is a dramatic decrease of vola-
tility coupled with an increase in spread and a decrease in
the number of quotations in the first half-hour period (be-
tween 4:00—4:30 BST), followed by an increase in volatility
coupled with a decrease in spread which cannot be ex-
plained by public information theories. Perhaps traders who
come back early from lunch take ‘wild’ positions to make
their early return worthwhile. On the other hand this vola-
tility increase could be a statistical artefact due to the small
number of quotations during that period; that is, a few
observations out of ‘equilibrium level’ can have a dramatic
increase in the sample variance of the rate.
The increase of average spread during the beginning of
the Tokyo (4:00 BST) lunch hour for both currencies could
be attributed to that traders during the lunch hour widening
their spreads to protect themselves from any unexpected
news, whereas when they return to their desks the average
spread returns to normal.
For both markets 7:00 BST seems to be an unusually high
spread period. This coincides with the opening of the Euro-
pean market and the closing of the Asian one; possibly
European traders want to protect themselves from potential
superior information that their Asian counterparts could
possess. However, this is less marked in the JPY market.
This opposes the Admati and Pfleiderer (1988) model, where
spread is lowest at the beginning of the trading day, due to
liquidity considerations, and in line with the Foster and
Viswanathan (1990) model where spread is highest at the
start of the day. Another high spread period for the DEM
market is around 14:00 BST, shortly after the release of US
macroeconomic news. It is also the common time for coor-
dinated interventions to occur [see Goodhart and Hesse
(1992)]. As at the same time there is some small increase in
the volatility of the market the spread increase can be
attributed to the traders, fear of central bank interventions.
The busiest period of the day in terms of the number of
quotations, measured by the half-hourly dummies, is the
return in activity after the Tokyo lunch-break and around
382 A. A. Demos and C. A. E. Goodhart
Fig. 1. Graphs of volatility, average spread, and number of quotations equations
5:30—6:00 BST, whereas the least busy is the Tokyo lunch
hour for both currencies. After the burst of activity in the
post Tokyo lunch-break, activity declines until there is
a smaller secondary peak when New York opens, between
13.30 and 14.30 BST, (27—29 on our graphs), before London
(Europe) closes. Thereafter activity (the number of quota-
tions) falls steadily as the US markets grind to a halt, before
Australia opens the new day.
The increased spread during periods of high market acti-
vity in both markets is best explained by the model of
Subrahmanyan (1989), where more trading by informed
risk-averse traders brings about lower liquidity and higher
Interaction between quotations, spread, and volatility in FOREX 383
Table 4. Correlation matrix of the residuals for Equations 2.a—2.c
DEM JPY
(2.a) (2.b) (2.c) (2.a) (2.b) (2.c)
(2.a) 1 1
(2.b) !0.267 1 !0.502 1
(2.c) 0.158 0.023 1 !0.074 0.185 1
Strictly speaking, however, the Admati and Pfleiderer (1988) model applies to individual traders and to markets with well-defined opening
and closing times.
costs. Furthermore, the higher spread towards the end of the
trading day, observed in the Deutschemark market but not
in the Japanese Yen market, is predicted by the dealer
market model of Son (1991), where risk-averse traders avoid
trading close to the end of their day to avoid overnight
inventory holdings.
There are few signs of any significant pattern in volatility
between the days of the week, except for some indications of
higher volatility in the Yen on Thursdays, and also positive
but insignificantly so for DEM. The average spread was,
however, significantly higher on Fridays than earlier in the
week, with some tendency for it to be lowest on Thursdays
and Wednesdays. This is roughly the inverse to the daily
pattern for the frequency of quote arrivals (activity), which is
lowest on Friday, and tends to peak in mid-week, Tuesday
and Wednesday.
The weekly dummies during the period showed a pattern
of steadily increasing market activity from week to week.
The final week (Week 5) was not only extremely active, but
exhibited a marked and highly significant increase in spread
size. Volatility also increased in the final week, but the
increase was much less significant.
V. CONCLUSIONS
We have assessed the behaviour of the spot foreign ex-
change market quotations in terms of volatility, average
spread, and the number of quotations within half-hour
intervals, as well as certain informational aspects of these
processes. It seems that a log-linear relationship among
these three processes is a considerably better approximation
to the true data generating process functional form, than the
linear one; however, it is by far worse than the functional
form presented here.
A new variable was introduced: the number of observa-
tions within a specific time interval. This variable plays an
important role in the determination of volatility and aver-
age spread, either directly or through the error terms. The
contemporaneous correlation of the number of quotations
and volatility leads us to hypothesize that the former pro-
cess could be a proxy for the volume of trade, or for the
number of transactions in the spot FOREX market, for
which data are unavailable. This is in line with studies in
stock market volume and volatility data [see Gallant, Rossi,
and Tauchen (1990), and Lamoureux and Lastrapes (1990)].
It turns out that informational theories can only partially
explain the facts documented here. Although, high trading
and volatility at the opening of markets can be explained
along the lines of the Admati and Pfleiderer (1988) theory,
the different behaviour of the two currencies in different
markets at the same (and different) time periods points
towards the need to take into account local and currency-
specific behaviour. The same can be said for the models of
Foster and Viswanathan (1990), Subrahmanyan (1989), and
Son (1991).
An important result of this paper is that the inclusion of
half-hourly dummies, and taking account of simultaneity
between volatility, average spread, and number of quota-
tions, considerably reduces the GARCH type effects in the
conditional variance of these two exchange rates. What
remains of such GARCH effects can then probably be
attributed to private information and the uncertainty asso-
ciated with it.
Finally, having fitted weekly, daily and half-hour dum-
mies, we can identify inter- and intra-day patterns of acti-
vity, volatility and average spread. Some of these, for
example, the impact of the Tokyo lunch hour, we have
previously documented. Others are already well known in
markets, for example, the rise in spreads and decline in
activity on Fridays. But we were surprised by the finding of
the continuing high volatility, in both currencies, through-
out the period of US market opening, despite steadily falling
activity, which we had expected. Much of the public in-
formation on economic news in the US is released at, or
before, the market opening, so exactly what keeps volatility
so high during the afternoons in the US is a mystery to us.
ACKNOWLEDGEMENTS
We wish to thank Seth Greenblatt, Steve Satchell,
Enrique Sentana, and especially Ron Smith for helpful com-
ments. Financial support from the Financial Markets
384 A. A. Demos and C. A. E. Goodhart
Group and the Economic and Social Research Council is
gratefully acknowledged. All remaining mistakes are ours.
REFERENCES
Admati, A. R. and Pfleiderer, P. (1988) A Theory of Intraday
Patterns: Volume and Price Variability, ¹he Review of Finan-
cial Studies, 1,3—40.
Amihud, Y. and Mendelson, H. (1980) Dealership Market:
Market-Making with Inventory, Journal of Financial Eco-
nomics, 8.
Andersen, T. G. (1991) An Econometric Model of Return Volatility
and Trading Volume, mimeo, Kellog Graduate School of
Management.
Basmann, R. L. (1974) Exact Finite Sample Distribution for some
Econometric Estimators and Test Statistics: A Survey and
Appraisal, Chapter 4 in Frontiers of Quantitative Economics.
volume 2, Intriligator and Kendrick, eds, North Holland.
Berkman, H. (1991) The Market Spread, Limit Orders and Op-
tions, Report no. 9007, Erasmus University, Rotterdam.
Bollerslev, T. and Domowitz, I. (1991) Trading Patterns and the
Behavior of Prices in the Interbank Deutschemark/Dollar
Foreign Exchange Market, Working Paper No 119, Kellog
Graduate School of Management, Northwestern University.
Bollerslev, T., Chou, R. Y. and Kroner, K. F. (1992) ARCH Model-
ling in Finance, Journal of Econometrics, 52,5—59.
Brock, W. and Kleidon, A. (1990) Exogenous Shocks and Trading
Volume: A Model of Intraday Bids and Asks, mimeo, Grad-
uate School of Business, Stanford University.
Clark, P. K. (1973) A Subordinated Stochastic Process Model with
Finite Variance for Speculative Prices, Econometrica, 41,
135—56.
Demos, A. and Sentana, E. (1991) Testing for GARCH Effects:
A One-Sided Approach, Paper presented at the Econometric
Society European Meeting, Cambridge September 1991, mimeo,
Financial Markets Group, London School of Economics.
Engle, R. F. and Ng, V. (1991) Measuring and Testing the Impact
of News on Volatility, mimeo, University of California.
Foster, D. and Viswanathan, S. (1990) A Theory of Intraday
Variations in Volumes, Variances and Trading Costs, Review
of Financial Studies, 3, 593—624.
French, K. and Roll, R. (1986) Stock Return Variances: The Arrival
of Information and the Reaction of Traders, Journal of Finan-
cial Economics, 17,71—100.
Gallant, A.R., Hsieh, D. and Tauchen, G. (1989) On Fitting a Re-
calcitrant Series: The Pound/Dollar Exchange Rate 1974—83,
mimeo, Duke University, Dept. Economics.
Gallant, A. R. Rossi, P. E. and Tauchen, G. (1990) Stock Prices and
Volume, mimeo, Duke University, Dept. Economics.
Goodhart, C. A. E. (1990) ‘News’ and the Foreign Exchange
Market, London School of Economics, Financial Markets
Group, Discussion Paper No. 71.
Goodhart, C. A. E. and Demos, A. A. (1990) Reuters Screen Images
of the Foreign Exchange Market: The Deutschemark/Dollar
Spot Rate, ¹he Journal of International Securities Markets, 4,
333—57.
Goodhart, C. A. E., Hall, S. G., Henry, S. G. B., and Pesaran, B.
(1991) News Effects in a High Frequency Model of the
Sterling—Dollar Exchange Rate, Discussion Paper No. 119,
Financial Markets Group, London School of Economics.
Goodhart, C. A. E. and Hesse, T. (1992) Central Bank FOREX
Intervention Assessed in Continuous Time, Financial Mar-
kets Group Discussion Paper No. 123, London School of
Economics.
Harvey, C. and Huang, R. (1990) Inter and Intraday Volatility in
Foreign Currency Futures Market, mimeo, Duke University.
Harris, L. (1987) Transactions Data Tests of the Mixture of Distri-
butions Hypothesis, Journal of Quantitative and Financial
Analysis, 22, 127—42.
Hausman, J. A. (1978) Specification Tests in Econometrics, Econo-
metrica, 46, 1251—71.
Hausman, J., Lo, A. W. and Mackinley, A. C. (1992) An Ordered
Probit Analysis of Transaction Stock Prices, Journal of Finan-
cial Economics, 31, 319—79.
Ho, T. and Stoll, H. R. (1983) The Dynamics of Dealer Markets
Under Competition, Journal of Finance, 38, 1053—74.
Ito, T. and Rolley, V. V. (1987) News from the US and Japan:
Which Moves the Yen/Dollar Exchange Rate?, Journal of
Monetary Economics, 19, 255—77.
Jarque, C. M. and Bera, A. K. (1980) Efficient Tests for Normality,
Homoskedasticity and Serial Independence of Regression Re-
siduals, Economics ¸etters, 6, 255—79.
Jones, C. M., Kaul, G. and Lipson M. L. (1991) Transactions,
Volumes and Volatility, mimeo, University of Michigan,
School of Business Administration.
Knight, J. L. (1986) Non-Normal Errors and the Distribution of
OLS and 2SLS Structural Estimators, Econometric ¹heory, 2,
75—106.
Koenker, R. (1981) A Note on Studentizing a Test for Hetero-
skedasticity, Journal of Econometrics, 17, 107—12.
Lamoureux, C. G. and Lastrapes, W. D. (1990) Heteroskedasticity
in Stock Return Data: Volume versus GARCH Effects, Jour-
nal of Finance, 45, 221—9.
Laux, P. and Ng, L. K. (1991) Intraday Heteroskedasticity and
Comovements in the Foreign Currency Futures Market,
mimeo, Department of Finance, University of Texas at Austin.
O’Hara, M. and Oldfield, G. S. (1986) The Microeconomics of
Market Making, Journal of Financial and Quantitative Analy-
sis, 21, pp. 361—76.
Oldfield, G. and Rogalski, R. (1980) A Theory of Common Stock
Returns over Trading and non-trading Periods, ¹he Journal
of Finance, 35, 729—51.
Son, G. (1991) Dealer Inventory Position and Intraday Patterns of
Price Volatility, Bid/Ask Spreads and Trading Volume,
mimeo, Dept. of Finance, University of Washington.
Spanos, A. (1986) Statistical Foundations of Econometric Model-
ling, Cambridge University Press, Cambridge.
Son, G. (1991) Dealer Inventory Position and Intraday Patterns of
Price Volatility, Bid/Ask Spreads and Trading Volume,
mimeo, Department of Finance, University of Washington.
Subrahmanyan, A. (1989) Risk Aversion, Market Liquidity, and
Price Efficiency, mimeo, Anderson Graduate School of Man-
agement, UCLA.
Tauchen, G. E. and Pitts, M. (1983) The Price Variability-Volume
Relationship on Speculative Markets, Econometrica, 51,
485—505.
Wood, R., Moinish, T. and Ord, K. (1985) An Investigation of
Transactions Data for NYSE Stocks, ¹he Journal of Finance,
XL, 722—41.
Wu, D. (1973) Alternative Tests of Independence between
Stochastic Regressors and Disturbances, Econometrica, 41,
733—50.
APPENDIX A
For the optimal ’s obtained, from the procedure described
above, we tested for omission of relevant lags [see Spanos
Interaction between quotations, spread, and volatility in FOREX 385
Notice that even in small samples it is not clear if the two-stage least square estimator over or underestimates the normal probability [see
Knight (1986)].
(1986)], specifically two more, in the VAR formulation. The
F statistics per currency and variable were the following:
2.25, 5.03, and 1.43 for the Deutschemark and 1.88, 4.271,
and 3.81 for the Yen (F(6, R)
%
"2.64). For 10-order serial
correlation of the residuals, the F statistics were 2.08, 2.52,
and 1.13 and 1.70, 2.82, and 1.34 for the Deutschemark and
Yen respectively (F(10,R)
%
"2.32). It seems that at least
for the spread equation having only two lags does not
capture the systematic dynamics. Hence, in the VAR formu-
lation one more lag is added.
The F-statistics for two more lags, this time, are: 1.25,
0.98, and 1.65, and 1.47, 2.60, and 3.04, for the Mark and
Yen respectively. However, the 10-order serial correlation
F-statistics are highly significant for both currencies. This is
probably due to overfitting in the volatility and number of
quotes equations. Consequently, we re-estimated the VAR
imposing zero coefficients to the third lag of volatility and
number of quotations. The 10-order serial correlation statis-
tics now are: 1.54, 1.38, and 1.23, and 1.62, 2.31, and 1.66 for
the two currencies, suggesting that indeed overfitting was
the cause of spurious serial correlation. The omission of two
more lags, in the systematic dynamics of the VAR are now
1.57, 0.86, and 2.13 for the Deutschemark and 1.49, 2.22, and
3.89 for the Yen. Although the systematic dynamics for the
number of quotations, for the Yen only, indicates that
more lags are needed, and provided that this is not the case
with the Deutschemark we decided to stay with this speci-
fication.
The Jarque-Bera (1980) normality tests on the VAR resid-
uals stand at 2445.0, 696.6, and 185.3 for the Mark and
777.3, 529.6, and 125.9 for the Yen, implying a massive
rejection of the null hypothesis. Furthermore, the one-sided
Lagrange Multiplier test for ARCH type effects [see Demos
and Sentana (1991)] again massively rejects the null of
conditional homoskedasticity. Notice that in the normality
test using linear of log-linear form the statistics had, more or
less, two to three times the values reported above. A ques-
tion arises immediately on the validity of the distributions,
mainly of the various statistics that are used. However,
provided that the usual regularity conditions hold, that is,
the existence of higher moments for the distribution of the
errors, the usual arguments for the asymptotic validity of
the tests apply.
The exogeneity Wu (1973) Hausman (1978) F statistics
are 5.51, 4.10, and 5.95, and 4.60, 2.75, 5.80 for the Mark and
Yen respectively. Hence with the exception of the average
spread in Yen the exogeneity of the other variables is rejec-
ted. The Basmann (1974) test for the overidentified restric-
tions does not reject the null hypothesis as it stands at 1.57,
2.19, and 1.52 for the Mark and 1.95, 0.56, and 0.93 for the
Yen. This is an indication that the specification of the
system is correct (see Spanos (1986)).
386 A. A. Demos and C. A. E. Goodhart