profit with options essential methods for investing success - wiley
Bạn đang xem bản rút gọn của tài liệu. Xem và tải ngay bản đầy đủ của tài liệu tại đây (2.46 MB, 287 trang )
PROFIT WITH
OPTIONS
TEAMFLY
Team-Fly
®
Founded in 1807, John Wiley & Sons is the oldest independent
publishing company in the United States. With offices in North
America, Europe, Australia, and Asia, Wiley is globally commit-
ted to developing and marketing print and electronic products
and services for our customers’ professional and personal
knowledge and understanding.
The Wiley Trading series features books by traders who have
survived the market’s ever changing temperament and have
prospered—some by reinventing systems, others by getting back
to basics. Whether a novice trader, professional, or somewhere
in between, these books will provide the advice and strategies
needed to prosper today and well into the future.
For a list of available titles, please visit our Web site at
www.WileyFinance.com.
A Marketplace Book
PROFIT WITH
OPTIONS
Essential Methods for
Investing Success
LAWRENCE G. McMILLAN
JOHN WILEY & SONS, INC.
Copyright © 2002 by Lawrence G. McMillan. All rights reserved.
Published by John Wiley & Sons, Inc., New York.
Published simultaneously in Canada.
No part of this publication may be reproduced, stored in a retrieval system or
transmitted in any form or by any means, electronic, mechanical, photocopying,
recording, scanning or otherwise, except as permitted under Section 107 or 108 of
the 1976 United States Copyright Act, without either the prior written permission
of the Publisher, or authorization through payment of the appropriate per-copy fee
to the Copyright Clearance Center, 222 Rosewood Drive, Danvers, MA 01923,
(978) 750-8400, fax (978) 750-4744. Requests to the Publisher for permission
should be addressed to the Permissions Department, John Wiley & Sons, Inc.,
605 Third Avenue, New York, NY 10158-0012, (212) 850-6011, fax (212) 850-6008,
E-Mail:
This publication is designed to provide accurate and authoritative information in
regard to the subject matter covered. It is sold with the understanding that the
publisher is not engaged in rendering professional services. If professional advice
or other expert assistance is required, the services of a competent professional
person should be sought.
Wiley also publishes its books in a variety of electronic formats. Some content that
appears in print may not be available in electronic books. For more information
about Wiley products visit our Web site at www.Wiley.com.
ISBN 0-471-22531-2
Printed in the United States of America.
10987654321
v
PREFACE
Over the years, I’ve written two thick books on options trading
that have a combined page count over 1,500. I write a weekly
advisory newsletter, as well as a daily fax service. So what, you
may wonder, do I have left to write about on the topic of options
trading?
With this book, my goal is not necessarily to cover a lot of in-
novative new ground, but to present material in a new way that
will enhance the ability of traders to master a variety of option
trading techniques and become more successful at incorporat-
ing them into their overall trading program. My first book, Op-
tions as a Strategic Investment is, at 998 pages, a complete
reference text that covers nearly every aspect of options trading
in depth. McMillan on Options is more focused on how to apply
various options strategies, including the ones I personally pre-
fer and use frequently. What has been missing—based on feed-
back received from my readers, seminar attendees, and
subscribers—is a book that covers each phase of the options
trading process step-by-step, reinforces individual concepts, and
thus allows you to hone and refine skills—in essence, a work-
book or study guide.
In Profit with Options I have attempted to provide an
overview of the options trading process in a more concise,
hands-on way. Each chapter covers a specific concept and ends
vi PREFACE
with a set of review questions and answers that will assist you
in absorbing and implementing the material covered.
While the introduction does address basic terms and the
building blocks of option trading concepts, the book as a whole is
written for someone with some degree of investment and trad-
ing experience. The first chapter also moves right into the com-
ponents of option price, using historical and implied volatility
to formulate your option trading strategy, and understanding
the advantages an option model can provide. Plus, LEAPS, fu-
tures, and trading technology are each treated in detail.
Chapters 2 and 3 explain how to use options as both direct
and contrary indicators, with examples showing how each can
predict market direction and help you decide which options to
buy under both scenarios.
Chapter 4 teaches you how to incorporate system trading
into an overall options game plan and illustrates the value of
taking the system approach. A variety of systems types are
outlined that are applicable for both short-term and long-term
investors.
Chapter 5 presents powerful methods for using options as
“insurance” and portfolio protection, which is one of their key
strengths.
Chapters 6 and 7 conclude with various strategies for profit-
ing from trading volatility. I start by viewing volatility as a
strategic indicator, and then move into both forward and re-
verse “skew” and spreading strategies. I then provide a more in-
depth look at volatility analysis, the reasons behind volatility
changes, and highlight my own favorite strategy plus personal
criteria for buying straddles, “follow-up” action, and selling
naked options.
Each chapter of the workbook can stand on its own, but
taken together, they form the basis of a well-rounded options
trading program. With the end-of-chapter questions provided,
you can test your knowledge of the concepts, techniques, and
systems featured in Profit with Options before you need to put
PREFACE vii
them into action in the real trading world. And this learn-by-
ex
ample workbook should prepare you for making the right
moves at the right time, while reacting swiftly to opportunities
that arise in the fast-paced options arena.
It is my hope that this hands-on guide will complement my
previous two works. You can now access a comprehensive re-
source on options, a product devoted primarily to strategies in
action, and a manual that helps to reinforce tactics and refine
option trading skills.
I have devoted much of my career to educating investors on
the fundamentals and the benefits of trading options. I think
they provide enormous wealth-building potential for anyone who
has mastered a proficiency in trading options. And I hope, after
completing this handbook, that you will have a better working
knowledge of how to use options to diversify and enhance a
portfolio.
L
AWRENCE
G. M
C
M
ILLAN
April 2002
ix
CONTENTS
Chapter 1
Introduction 1
Chapter 2
Options as Direct Indicators 31
Chapter 3
Options as Contrary Indicators 79
Chapter 4
System Trading 123
Chapter 5
Protecting a Stock Portfolio 163
Chapter 6
Trading Volatility 179
Chapter 7
Buy Low and Sell High—Volatility, That Is 211
Answers to Review Questions 251
Glossary 267
Index 271
1
1
INTRODUCTION
L
EARNING
O
BJECTIVES
The material in this chapter will help you to:
• Become familiar with the terms and concepts of option
trading.
• Analyze the components of option price.
• Use historical and implied volatility to formulate your op-
tion trading strategy.
• Understand the benefits an option model can provide.
• Understand the advantages and disadvantages of trading
futures.
A call option gives you the right to purchase something at a
specified price, and that option is normally “good” for only a pre-
determined length of time. There are options in many facets of
life—real estate, executive stock options, and the focus of this
book: listed options. The “something” that you may purchase is
called the underlying instrument (the underlying). It could
be a stock, it could be an index, or it could be a futures contract.
2 INTRODUCTION
The specified price at which that underlying instrument can be
bought is called the strike price. Finally, the date by which the
option must be used is called the expiration date. These three
terms completely define the option. For example, an IBM July
120 call is an option to buy IBM (the underlying instrument) at
a price of 120 (the strike price) at any time through July (the
expiration date).
For stock and index options, the last trading day is the third
Friday of the month, so the expiration date is that day. (Actu-
ally, for legal reasons, it’s technically the next day—but that’s a
Saturday, so for all intents and purposes, Friday is considered
to be the expiration date.) For futures options, expiration dates
vary within the expiration month. We’ll talk more about them
later. The material in this chapter lays the groundwork for your
development as an option strategist.
IMPORTANT TERMS AND CONCEPTS
An important concept is that of a put option. A put option al-
lows the holder to sell the underlying security at the strike price
up until the expiration date. Thus, call options increase in price
when the price of the underlying security rises, and put options
increase in price when the price of the underlying security falls.
Options were traded over-the-counter for years, but
in 1973 the Chicago Board Options Exchange (CBOE)
was formed and the innovations that they brought
to the marketplace have resulted in the huge market
we now have for listed options.
The biggest innovation was the introduction of a liquid mar-
ket in options. Options can be bought and sold at any time, just
as shares of stock can be bought and sold. It is not necessary to
TEAMFLY
Team-Fly
®
IMPORTANT TERMS AND CONCEPTS 3
hold the option until its expiration date. Therefore, if you were
to buy that IBM July 120 call, and then IBM stock price rose
shortly thereafter—perhaps rising well above the strike price
120—most likely the call would gain some value. You could just
phone your broker and sell the call to take your profit. You
would not have to worry about whether or not IBM was above
the strike price of 120 at expiration.
Options are a derivative security. That is, their price
movements are taken from the movements in another security
(the underlying stock, for example). Over the years, since listed
options began trading on the Chicago Board Options Exchange
(CBOE), there have been many different types of listed securi-
ties. Index and sector options are merely options on an index
or a sector index (for example, the S&P 500 Index or the Semi-
conductor Index). Warrants have been listed on the New York
Stock Exchange (NYSE) for years, but the current type of war-
rants being traded—particularly on the American Stock Ex-
change (AMEX)—generally play either currencies or the market
as an option security. With warrants, you can own the market
without much risk. Over-the-counter options are options
that are traded directly, generally by big firms such as Morgan
Stanley or institutions such as mutual funds. See Table 1.1 for
a summary of derivative types.
Here are a few other terms that may be of interest:
•
In-the-money/out-of-the-money. When the underly-
ing is trading higher than the strike price of a call
Table 1.1 Derivative Types
Equity options (e.g., LEAPS)
Index and sector options (e.g., S&P 500, OEX; oil and gas, gold)
Listed warrants (similar to option but behaves more like stock)
Futures options/serial options
Over-the-counter options (e.g., Swaps—interest-rate trades)
4 INTRODUCTION
option, the call option is said to be in-the-money.
If the underlying is below the strike price, the call is
said to be out-of-the-money. Conversely, a put option is
in-the-money when the underlying instrument is trad-
ing at a price lower than the strike price and out-of-
the-money when the underlying is trading above the
strike price.
•
Exercise the option. Converting the option into the un-
derlying instrument is exercising the option. A person who
exercises one IBM July 120 call would get 100 shares of
IBM in his or her account, and those shares would cost
$120 apiece—a total transaction cost of $12,000, plus com-
missions. Exercising a futures option yields one contract of
the underlying instrument.
• In-the-money-amount. The amount by which the un-
derlying exceeds the strike price of a call option is called
the in-the-money amount; for put options, the in-the-
money amount is the distance by which the underlying in-
strument is below the strike price.
• Intrinsic value/time value. An option’s complete
price is composed of two things: intrinsic value (which is
the in-the-money amount or zero for an out-of-the money
option) and time value. The time value of an option de-
creases as time passes until, at expiration, the option’s
price is either equal to the in-the-money amount or zero
(if it’s out-of-the-money at expiration). Out-of-the-money
options are composed entirely of time value premium,
while a deeply in-the-money option is composed almost
entirely of intrinsic value with very little time value pre-
mium. An option buyer must be careful not to continu-
ally buy too much time value premium and too little
intrinsic value. Such a strategy may lead to ruin be-
cause the probability of an out-of-the-money expiring
worthless is greater than 50%.
OPTION PRICE 5
OPTION PRICE
Six components of the price of an option are:
1. Underlying price.
2. Time remaining until expiration.
3. Dividends (not applicable to futures options).
4. Strike price.
5. Short-term interest rate.
6. Volatility.
Of these, volatility is the only one that is not a predetermined,
fixed quantity. That is, you know what all the others are at any
one point in time, but volatility is not known. Hence, fluctua-
tions in the market’s perception of volatility will affect the
price of the option.
Volatility
There are two kinds of volatility: (1) historical volatility, a
measure of how fast the underlying instrument has been mov-
ing around in the past and (2) implied volatility, the volatil-
ity component built into an option’s price. Implied volatility is
really an attempt to determine how volatile the underlying will
be during the life of the option. As implied volatility increases,
so does time value premium, so that an option with a very high
implied volatility will be a very costly option, and it will have a
great deal of time value premium—perhaps even if it is an in-
the-money option.
The word volatility is used with great frequency in this
book. It is the most important thing that an option trader needs
to think about. Rather than say an option is “overpriced” (which
is a somewhat subjective term), it is better to say it is trading
with a high “implied volatility.”
6 INTRODUCTION
Historical volatility can be calculated by a specific statisti-
cal formula—it is nothing more than the standard deviation of
the movements of the underlying instrument. Implied volatil-
ity, however, can only be determined by the use of an option
model—a mathematical formula used to give some accurate
estimates of an option’s price, based on its components.
Option Pricing Models
Option models are important for option traders, and everyone
should have some sort of model available. There is a free one at
the CBOE’s Web site, www.cboe.com. There are some models
that are a little fancier and have a modest cost, and then there
are some that are part of full-blown portfolio management soft-
ware systems and are quite expensive. More will be said about
these later in this book.
Black-Scholes Model
The most famous option model is the Black-Scholes model, in-
vented by professors Fisher Black and Myron Scholes. At the
time, they were working in fairly close concert with another
professor, Robert Merton. After a difference of opinion over the
basics of the model, Merton went on to do his own research,
while Black and Scholes attached their names to the now fa-
mous model.
The Nobel Prize for Economics was awarded in 1998
for this model. Fisher Black had passed away, and
Nobel Prizes are not awarded posthumously, but
Scholes and Merton shared the award.
Do not think, however, that option models can remove all the
guesswork from option pricing. They can give you a good esti
mate
OPTION PRICE 7
of the option’s price, if you can accurately describe what is going
to happen to the underlying price. Of course, the latter is an im-
possible task. Still, the models are useful in providing an esti-
mate of an option’s cost and in helping to determine if you are
buying an “overpriced” option.
Some users found small problems with the Black-Scholes
model and so other models, such as the binomial model, have
found some supporters. Generally, these models will not give
substantially different estimates of an option’s value, thus it
doesn’t matter much which one you use—as long as you use
some model. Trading options without the benefit of an option
model is foolhardy and will put you at an extreme disadvantage
to the best and smartest option traders—a disadvantage that
will eventually cost you some serious money.
Delta
One of the benefits of a model is that it can give an estimate of
what-if situations. One of the simplest is the delta of an option.
That is the amount by which the option will move if the under-
lying instrument moves one point. A call’s delta ranges between
values of 0.00 and 1.00. So if the underlying moves up a point,
and the call increases in price by half a point, then the call’s
delta is 0.50. Put deltas range from 0.00 down to −1.00, to re-
flect the fact that puts move in the opposite direction from the
underlying.
In-the-money options have large absolute deltas—reflecting
the fact that their movements fairly closely mirror those of the
underlying instrument. Out-of-the-money options, on the other
hand, have small deltas—indicating that it will take a big move
by the underlying to cause the out-of-the-money option to gain
much value. In some sense, the delta can be viewed as the proba-
bility that the option will be in-the-money at expiration. Table 1.2
gives some examples with comments.
8 INTRODUCTION
Note that a change in one variable will cause a change in
some of the others. For example, a sharp increase in implied
volatility will change the delta of an option. We discuss this in
more detail later in this book.
Profit Graph; Pricing Curve
The graphs shown in Figure 1.1 are profit graphs depicting
the potential profits and losses from a position. Such graphs can
be drawn by many of the option software programs for sale
today and by Internet application sites as well. When positions
become complex—perhaps involving numerous options as well
as a position in the underlying stock—a profit graph may be the
only way to discern what your position will do when the under-
lying begins to change in price, or when time passes. Most of
the software applications will also let you observe how a change
in implied volatility will affect your position as time passes.
A pricing curve, on the other hand, is the picture of a sin-
gle option’s value—depicted over a range of stock prices. One
Table 1.2 Stock Price: 120 on April 1, 1999
Option Price Delta Comment
April 110 call 10.125 0.99 Behaves just like stock.
April 130 call 0.0625 0.01 Not much chance of making a
move.
July 120 call 8 0.55 Moves about half as fast as the
common.
July 140 call 3 0.25
Smaller moves than the July 120
call.
January (’00) 120 call 14 0.60
Longer-term options have
lower deltas at the extremes
because they have more time
value premium.
OPTION PRICE 9
particular graph might contain several pricing curves, usually
graphing several options with similar terms (same underlying
and same striking price, but perhaps different expiration
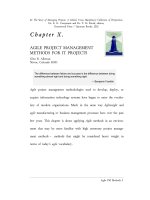
dates). The graph in Figure 1.2 is such a pricing curve. Four op-
tions are shown: a three-month option, a six-month, a one-year,
and a two-year. Each one has a strike price of 100. You can see
that the curves are similar, but the more time remaining in the
option, the higher the curve resides on the graph. Thus, it is
easy to see the time value—and the effect of time value—with
this pricing curve.
Profit Table Profit Graph
Figure 1.1 Derivative types.
Stock Price
Stock Price
Profit/Loss
Profit/Loss
At Expiration
Stock Price Result
40 −$300
45 −$300
50 −$300
55 +$200
60 +$700
65 +$1,200
Put Purchase
XYZ = 40 July 40 PUT = 2
At Expiration
Stock Price Result
45 −$200
40 −$200
35 +$300
30 +$800
25 +$1,300
Example: XYZ = 50,
Buy XYZ July 50 Call for 3
10 INTRODUCTION
OPTION DESCRIPTORS
LEAPS
When equity options were first listed by the CBOE (and subse-
quently, the other option exchanges), the longest time in the life
of an option was nine months. As the years went by, institutions
demanded a longer term option. Thus, LEAPS were created.
LEAPS is an acronym for some lengthy name, but in reality it
is nothing more than a name for an option that has more than
nine months of life remaining. When LEAPS are first issued,
they have expiration dates of between two and three years.
Eventually that time dwindles down to nine months or so, and
Figure 1.2 LEAPS call pricing curve.
30
25
20
15
10
5
0
8070 90 100
Stock Price
110 120
Option Price
2 Years
1Year
3 Months Parity
6 Months
OPTION DESCRIPTORS 11
they become a “regular” option at that point. Not every underly-
ing stock has LEAPS, but if you own a stock and want to trade
a LEAPS option on it, just tell your broker to request it. The ap-
propriate exchange can decide, pretty much on the spot, to list a
LEAPS option based on a customer’s request.
LEAPS is just a fancy name for a stock option that
has at least one year of life remaining.
Option Symbols
To quote any security electronically, it is assigned a symbol. For
example, the symbol for General Motors common stock is, quite
logically, GM. Unfortunately, logic doesn’t play a great part in
most symbols. To quote options, a more complex symbology is
required. A stock or index option symbol consists of three parts:
Equity option symbol = Base symbol + Expiration code
+ Strike price code
Expiration codes are standardized. The expiration codes for call
options are:
The expiration codes for put options are:
M = January
N = February
O = March
P = April
Q = May
R = June
S = July
T = August
U = September
V = October
W = November
X = December
A = January
B = February
C = March
D = April
E = May
F = June
G = July
H = August
I = September
J = October
K = November
L = December
12 INTRODUCTION
Strike price codes are somewhat standardized, but there are
some very strange exceptions to the rules. All of the letters, A
through Z, are used for standardized codes. But in the case of
some “odd” strikes, caused perhaps by noninteger splits (3-for-2
or 5-for-4, for example), minor stock dividends and the like, the
letters can sometimes mean something else. The only way to
know for sure is to use a quote system that has the table built
in, so it can translate the strike price codes into striking prices.
Your broker should have such a system, but Internet quoting
services have it too. The “standard” strike price codes are:
If the underlying is trading at levels greater than 100, the
strike prices codes refer to the last two digits of the strike price.
For example, IBM might be trading near 150. Then J would stand
for 150, L for 160, and so forth. Or the $OEX Index might be
trading near 650, so in that case J would stand for 650, L for 660,
and so on.
Originally, all stocks and indices had strike prices 5 points
apart. Now, many stocks have strike prices that are 2
1
⁄
2 points
apart, so another sort of semistandardized convention has been
used, involving the remaining letters of the alphabet:
U = 7.5 or 37.5 or 67.5
V = 12.5 or 42.5 or 72.5
W = 17.5 or 47.5 or 77.5
X = 22.5 or 52.5 or 82.5
Y = 27.5 or 57.5 or 87.5
Z = 32.5 or 62.5 or 92.5
A = 5
B = 10
C = 15
D = 20
E = 25
F = 30
G = 35
H = 40
I = 45
J = 50
K = 55
L = 60
M = 65
N = 70
O = 75
P = 80
Q = 85
R = 90
S = 95
T = 100
TEAMFLY
Team-Fly
®
FUTURES 13
These semistandardized codes quickly become confusing.
That’s why it is best if you need to find the option’s symbol to go
to your broker, or perhaps to use the “delayed quotes” page at
the CBOE’s Web site, www.cboe.com.
LEAPS Symbols
To make matters even more complicated, note that the expiration
codes used earlier do not specify a year. That is, “January” is as-
sumed to be the next January on the calendar. It cannot also rep-
resent the following January. Since LEAPS options expire a
couple years in the future, complete new base symbols are used
for LEAPS options. Thus, for IBM, the symbol VIB is used to des-
ignate IBM options expiring in the year 2003 with LIB for IBM
options expiring in the year 2004. So, the IBM Jan 2003 LEAPS
with a strike price of 160 would have the symbol VIBAL.
Every stock that has LEAPS options has additional sym-
bols associated with it that designate the later year options.
This is particularly cumbersome. Once again, your broker or
the CBOE site should be able to supply any symbol you want.
On a sophisticated option quoting system, if you type in
“IBM,” the quote system should give you back all of the IBM
options, including the LEAPS, so that all of the symbols can be
found in one place.
FUTURES
Futures Contracts
First, futures contracts will be described. Then, futures options
will be discussed. For those not familiar with futures contracts,
it is easiest to think of them just like shares of stock. They can
drop to zero (in theory, but not really in practice), and they can
rise to great heights. The main differences between futures and
14 INTRODUCTION
stocks are that (1) futures require far less margin, and there-
fore have far greater leverage; and (2) futures have an expira-
tion date.
Most of the “older” commodity contracts have a real commod-
ity underlying them—corn, wheat, soybeans, orange juice, and
so on. By the expiration date, the actual physical product
changes hands in accordance with the terms of the contract as
specified by the exchange where the futures are traded. For ex-
ample, one contract of corn involves 5,000 bushels of corn.
The newer “financial” contracts may have a cash settlement,
in some cases. That is, the futures contract is marked to market
each day (i.e., your profit or loss is totaled by your brokerage
firm), and on the last day the contract just disappears from your
account, leaving you with only the cash profit or loss from hav-
ing owned it.
Futures Option Symbols
A futures option symbol consists of two parts:
Futures option symbol = Futures base symbol
+ Expiration code
Futures base symbols are quite logical (usually). For exam-
ple, LC = Live Cattle, SP = S&P 500 Index, SM = Soybean Meal,
and so on. Both futures contracts and futures option contracts
need to have expiration codes.
Expiration codes are somewhat different for futures and
their options:
F = January
G = February
H = March
J = April
K = May
M = June
N = July
Q = August
U = September
V = October
X = November
Z = December
FUTURES 15
Also, since futures contracts can span several years, a single
digit is used to describe the expiration date. Therefore, the
symbols “H3” would indicate March of the year 2003. So the fu-
tures option symbol for S&P futures expiring in March 2003
would be SPH3.
Futures Options Terms
This section provides a brief review of some terms related to
futures options. All futures contracts have an expiration date.
Physical commodities (such as corn, gold, sugar, etc.) have a
first notice day as well, that is, the first day that the holder
of a long futures contract can be made to take delivery of the
physical commodity. Thus, speculators usually exit the market
by that date. Options expire before the first notice day so that
all exercising and assignment of options is out of the way be-
fore physical delivery begins in the commodity. The expiration
dates of the options are thus different for each commodity each
Table 1.3 Futures Options Terms
Exercise For futures or cash.
First notice day Earliest date holder can be made to
accept delivery of the commodity.
Option expiration Before FND.
Delivery At seller’s option.
Option expiration Futures magazine.
date sources Chart books.
Broker’s notice.
Commissions Round turn.
Per side.
Flat rate.
Settlement price
Middle of the closing range at the end of the day.