aggarwal and conroy-price discovery in initial public offerings and the role of the lead underwriter
Bạn đang xem bản rút gọn của tài liệu. Xem và tải ngay bản đầy đủ của tài liệu tại đây (165.33 KB, 20 trang )
Price Discovery in Initial Public Offerings
and the Role of the Lead Underwriter
REENA AGGARWAL and PAT CONROY*
ABSTRACT
We examine the price discovery process of initial public offerings ~IPOs! using a
unique dataset. The first quote entered by the lead underwriter in the five-minute
preopening window explains a large proportion of initial returns even for hot IPOs.
Significant learning and price discovery continues to take place during these five
minutes with hundreds of quotes being entered. The lead underwriter observes the
quoting behavior of other market makers, particularly the wholesalers, and ac-
cordingly revises his own quotes. There is a strong positive relationship between
initial returns and the time of day when trading starts in an IPO.
RESEARCHERS HAVE DOCUMENTED AND TRIED to explain why IPOs jump up in
price initially but then perform poorly in the long run.
1
Schultz and Zaman
~1994! and Barry and Jennings ~1992! report that almost the entire initial
return is ref lected in the very first trade price. However, researchers have
not examined how the price changes from the offer price to the price of the
first trade. Our empirical analysis explains the learning process by which
the price changes from the offer price to the first trade price. The offer price
is typically set after the market closes on the day prior to the first day of
trading. Yet, there is a large price runup by the next morning. For example,
Amazon.com went public on May 15, 1997 at an offer price of $18 and the
first trade occurred at 10:30 a.m. on May 16 at a price of $29.25. This re-
search is also motivated by the concern of stock exchanges, regulators, and
market participants about the initial price discovery and volatility of IPOs.
Price discovery is particularly important and difficult for the opening of
* Aggarwal is at the McDonough School of Business, Georgetown University and Conroy is at
Folio@ fn#, Inc. Part of this work was done while both Aggarwal and Conroy were at the Secu-
rities and Exchange Commission ~SEC!. We thank seminar participants at the SEC, NASD,
Georgetown University, the 1999 meetings of the European Financial Management Association,
Bill Byrnes, Pat Fishe, Todd Houge, Tim Loughran, Jay Ritter, Pietra Rivoli, René Stulz ~the
editor!, and an anonymous referee for providing very useful comments. This research was par-
tially supported by research grants from Georgetown University and the Capital Markets Re-
search Center. The SEC, as a matter of policy, disclaims responsibility for any private publication
or statement by any of its employees. The views expressed herein are those of the authors and
do not necessarily ref lect the views of the Commission or the authors’ colleagues upon the staff
of the Commission.
1
See Aggarwal and Rivoli ~1990! and Ritter ~1991! for short-run and long-run performance.
THE JOURNAL OF FINANCE • VOL. LV, NO. 6 • DEC. 2000
2903
IPOs because no trading history exists. Therefore, the initial trading and
price discovery in these stocks can be very noisy and has become a cause for
concern.
As Ellis, Michaely, and O’Hara ~1999! discuss, the lead underwriter is
always a market maker in Nasdaq IPOs. In its role as a market maker, the
lead underwriter must initially decide at what price to start quoting and
trading the stock. We use unique quote data with the identity of the market
maker to examine the quoting behavior of the lead underwriter during the
preopening period; the behavior of other market makers; the importance of
the preopening period for learning and price discovery; and factors that de-
termine the time of day when trading in an IPO starts. The paper analyzes
how accurate the lead underwriter’s starting quotes are and how he learns
from the quoting behavior of other market makers and decides the price at
which to buy0sell the stock.
IPOs have a preopening period that lasts for a maximum of five minutes
before actual trading begins. During this five-minute preopening period, all
market makers have the option to add, revise, or cancel quotes before trad-
ing actually begins.
2
Nasdaq is examining whether the five-minute preopen-
ing window should be lengthened for some stocks to achieve more efficient
price formation and lower volatility. The argument for a longer time period
is stated by market participants:
The five-minute period wasn’t nearly enough time to gauge the huge
levels of demand that have built for most recent internet deals, and to
determine where the stock would head once it opened @T#he new
rules would allow Nasdaq traders more time to determine at what price
an IPO is likely to open. . . ~The Asian Wall Street Journal, February 3,
1999!
Quotes entered into the system during the preopening period are not bind-
ing. Therefore, it is possible that market makers do not show their true
intention when entering these quotes. They face only the small costs of order
placement and handling without the risk of execution. However, market mak-
ers may have incentives to produce price discovery even in the absence of
binding commitments. The lead underwriter is certainly motivated to learn
from the quote revision process in the preopening. All market makers may
cooperate in the price discovery process because the opening of IPOs is a
repeated game.
There can be a considerable amount of activity during this five-minute
window. For example, there were 116 quote entries in the case of Ama-
zon.com during the five-minute preopening period. We analyze whether these
nonbinding quotes have any value and how the price discovery process works
2
The preopening period is five minutes long during our sample period for all stocks. In
January 1999, the duration of the preopening period was increased for selected stocks. The
preopening period for non-IPO Nasdaq stocks is much longer and lasts for 90 minutes.
2904 The Journal of Finance
even though no trades take place during this time period. The price discov-
ery process starts even before the preopening period begins. The lead un-
derwriter decides when to start trading an IPO and sets the first quote
during the five-minute preopening. This first quote explains a large portion
of initial returns.
A limited number of recent studies have empirically examined how open-
ing prices are determined on the Paris Bourse, the New York Stock Ex-
change ~NYSE!, and on Nasdaq for non-IPO stocks. Biais, Hillion, and Spatt
~1999! find that significant learning and price discovery takes place during
the 90-minute preopening on the computerized Paris Bourse. Cao, Ghysels,
and Hathaway ~2000! conclude that quotes during preopening result in sig-
nificant price discovery for Nasdaq stocks. This limited evidence suggests
that preopening is important, and we expect preopening to be even more
important for IPOs.
3
The lead underwriter has the flexibility to decide at what time during the
day trading starts in an IPO and he informs Nasdaq of its decision. We find
that most IPOs do not start trading at 9:30 a.m. when the Nasdaq market
opens. For example, actual trading in Amazon started at 10:30 a.m. Almost
half the IPOs in our sample start trading after 11:00 a.m. Underwriters
have certain preferences as to when to start trading an IPO. The opening
time is found to be later for IPOs that start trading much higher than the
offer price.
The rest of the paper is organized as follows: Section I provides details of
the quote-by-quote data along with the sources for other data used in the
paper; Section II discusses the empirical findings; and a summary and con-
clusions are provided in Section III.
I. Data
We use the Securities Data Company’s ~SDC! New Issues database to iden-
tify all IPOs that took place during the period May to October, 1997 and
started trading on the Nasdaq Stock Market. The analysis is limited to IPOs
that start trading on Nasdaq because our objective is to examine the role of
the lead underwriter as a market maker. Unit offerings and American De-
positary Receipts are excluded. The sample consists of 188 IPOs. The SDC
database is used to obtain information on offer price, offer date, offer size,
number of shares issued, and underwriter compensation.
As discussed earlier, quoting in IPOs can start five minutes before trad-
ing. We use a proprietary quote database available at the SEC to obtain
quote-by-quote data during the preopening and also after the market opens.
Quote updates are sequential and include all market maker identifications.
3
Other papers examine the role of stabilization by underwriters ~see Aggarwal ~2000a, 2000b!,
Ellis, Michaely, and O’Hara ~2000!, Benveniste, Busaba, and Wilhelm ~1996!, Chowdhry and
Nanda ~1996!, Hanley, Kumar, and Seguin ~1993!, Logue et al. ~2000!, Ruud ~1993!, Schultz and
Zaman ~1994!, and Prabhala and Puri ~1998!!.
Price Discovery in Initial Public Offerings 2905
Therefore, we can examine the quoting activity of the lead underwriter, the
comanager, and other market makers. We use this data to create a time
series of best bids and asks because Nasdaq does not report these during the
preopening period. During the preopening, the inside bid and ask are noted
as zero by Nasdaq. Once trading starts, the Nasdaq quote files include an
inside bid and ask. Under normal conditions, the best bid is lower than the
best ask and the difference is the market maker’s spread. However, some-
times the quotes are crossed or locked. A crossed quote is one when the best
bid is higher than the best ask. Similarly, a locked quote is one when the
best bid and best ask are equal. We keep track of locked and crossed quotes.
II. Empirical Results
Table I provides descriptive statistics for the sample of 188 IPOs on Nas-
daq during the period from May to October, 1997. The mean and median
offer prices are $12.33 and $12.00, respectively. On average the first trans-
action is at a price that is 17.66 percent higher than the offer price ~median
is 13.76 percent!. There is only a small change from the open price to the
close price on the first day of trading. The mean offer-to-close return is 19.47
percent ~median of 14.17 percent!. This result is consistent with the conclu-
sions of Barry and Jennings ~1992! and Schultz and Zaman ~1994! that the
opening price captures almost all of the initial return.
The mean and median number of comanagers are 2.34 and 2.00, respec-
tively. The mean and median size of the syndicate is 16.85 and 17, respec-
tively. During the five-minute preopening, on average 6.71 different market
makers enter quotes for each IPO. The maximum number of market makers
quoting for any IPO in the preopening is 14 for our sample. Most syndicate
members do not quote in the preopening; many of them do not even become
Table I
Descriptive Statistics on Nasdaq IPOs
The sample consists of 188 Nasdaq IPOs during the period from May to October, 1997. The
table provides mean and median statistics; N is the number of observations; offer-to-open re-
turn is the percentage difference between the opening price on day 1 and the offer price; offer-
to-close return is the percentage difference between the closing price on day 1 and the offer. The
mean and median number of comanagers and syndicate members is also reported along with
the number of different market makers who quote in the preopening.
Mean Median
Offer price ~$! 12.33 12.00
Issue size ~millions of $! 46.93 34.38
Offer to open return ~%! 17.66 13.76
Offer to close return ~%! 19.47 14.17
Number of comanagers 2.34 2.00
Size of the syndicate 16.85 17.00
Number of market makers entering quotes in the preopening 6.71 7.00
2906 The Journal of Finance
a market maker in the stock. Consistent with the findings of Ellis, Michaely,
and O’Hara ~2000!, the role of the syndicate in the aftermarket is quite
limited. On average, the mean number of market makers entering quotes
for each IPO is 12.08 on day 1, 9.97 on day 2, 7.14 on day 10, and 7.72 on
day 20. There are a number of market makers called wholesalers who are
not part of the syndicate but they actively quote in the preopening. Their
role is discussed below.
A. Price Discovery in the Preopening Period
The lead underwriter informs Nasdaq when it plans to open trading in an
IPO. Before trading commences in a stock, there is a preopening period in
which market makers can enter their quotes. This preopening period can be
a maximum of five minutes and a minimum of zero seconds. Nasdaq informs
market participants about the start and end of the preopening period via its
News Frame. The lead underwriter sometimes gives advance notice ~30–45
minutes! about when it wants to start trading, but sometimes it may inform
Nasdaq only a few minutes before the open.
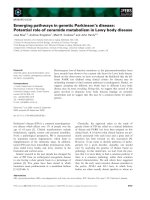
A.1. An Example of a Preopening: Amazon.com
We use the Amazon.com ~Amazon! IPO as an example to illustrate the
preopening process in Figure 1. Amazon went public on May 15, 1997 at an
offer price of $18. The lead manager for the offering was Deutsche Morgan
Grenfell, who started the preopening with a bid at $22.50 and ask at $23.50.
This first preopening quote occurred at 10:25:20 a.m. and the last quote at
10:29:58 a.m. During this four-minute-and-38-second window, 116 quotes were
entered for Amazon by eight different market makers. These preopening
quotes are not binding, so the question is whether they help in price discov-
ery. We find that the quotes continuously changed with prices moving up-
wards during this preopening window. During the few seconds just before
the end of the preopening period, the best bid was at $29.75 and the best ask
at $30. Quotes gradually moved from the $22 to $23 range to the $29 to $30
range. The first transaction occurred at 10:30:02 a.m. at a price of $29.25.
This example illustrates that the lead underwriter’s first quote in the pre-
opening is quite informative and that price discovery also continues to occur
during the five-minute preopening window.
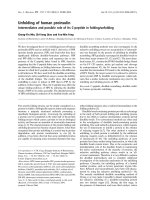
A.2. The Lead Underwriter’s First Quote
The lead underwriter always enters the first quote during the preopening.
Figure 2 plots offer-to-open and offer-to-first-preopening quote ~bid! returns.
The IPOs in the figure are arranged sequentially by initial returns. For
example, the largest price runup in our sample is almost 140 percent, of
which 105 percent is explained by the lead underwriter’s first quote during
the preopening. The lead underwriter uses the offer price as a benchmark
Price Discovery in Initial Public Offerings 2907
and based on his information starts quoting above the offer price for hot
IPOs. However, the lead underwriter has no incentive to overshoot by quot-
ing above the equilibrium price. Instead, he revises his own quotes after
observing what other market makers are quoting.
As can be seen in the Figure 2, a large proportion of the offer-to-open
returns is captured in the very first quote entered by the lead underwriter.
Barry and Jennings ~1992! and Schultz and Zaman ~1994! document that
the first trade price captures most of the initial returns. We find that even
before the open of trading, significant price discovery has already taken
place. These results suggest that even for IPOs with big price runups, the
lead underwriter has good information and is appropriately able to set quotes.
The lead underwriter enters a bid equal to the offer price for weak IPOs, and
these weak IPOs open at the offer price due to the price support provided by
the lead underwriter, as seen in Figure 2. This is consistent with Aggarwal’s
~2000a! stabilization explanation for weak offerings. She finds that under-
writers have a large short position in weak IPOs and this short position is
covered in the aftermarket to help provide price support.
Figure 1. Preopening process for Amazon.com. Amazon.com went public on May 15, 1997,
at an offer price of $18. The lead underwriter was Deutsche Morgan Grenfell, who started the
preopening at 10:25:20 a.m. with a bid at $22.50 and ask at $23.50. During the five-minute
preopening window, 116 quotes were entered by eight different market makers. At the end of
the preopening period, the best bid and ask were $29.75 and $30.00, respectively. The first
transaction in the stock occurred at a price of $29.25. The two spikes ~toward the end of pre-
opening! in the bid at a price of $23 are quotes by the lead underwriter.
2908 The Journal of Finance
A.3. Quotes During Preopening
The maximum length of the preopening window can be five minutes and
the minimum can be zero seconds. Eighty-three IPOs of 188 in the sample,
have a preopening that lasts for three minutes or more; 86 stocks have a
preopening that lasts for three minutes or less; and there are no preopening
quotes for 19 stocks. The maximum number of quotes in the preopening
period is 191 for Rambus, which was taken public by Morgan Stanley on
May 14, 1997. IPOs that use most of the five-minute preopening window are
those whose opening price is much higher than the offer price. Offerings
with low offer-to-open returns utilize only a small portion of the five-minute
window. Therefore, we find that the 14 IPOs whose quoting starts with at
least 4:30 minutes remaining in the preopening window have an initial av-
erage return of almost 45 percent.
In Table II, the five-minute preopening period is divided into ten 30-
second intervals. The interval 0:30-0:00 refers to the 30 seconds just before
trading starts. Fourteen IPOs have a preopening of 4:30 minutes or longer;
14 stocks have a preopening of 30 seconds or less; and 19 stocks have no
preopening quotes. The average number of quotes per IPO in the 30-second
window just before trading starts for the 14 stocks with the longest preopen-
ing is 6.79. During the 30-second window when preopening just starts, the
average number of quotes for each stock is only 1.14. Three patterns emerge
from this analysis. First, quote-entering activity increases substantially just
Figure 2. Price discovery in the first preopening quote. Each IPO in our sample is sorted
by offer-to-open return and plotted. The two lines correspond to open-to-offer return ~%! and
first quote during the preopening-to-offer return ~%!. The IPO with the largest increase from
offer price jumped almost 140 percent ~open-to-offer!. For this IPO, the first quote during the
five-minute preopening window entered by the lead underwriter ~acting as a market maker! is
almost 105 percent higher than the offer price. Price discovery takes place even before the
preopening quoting starts. For weak IPOs, the first trade occurs at the offer price and the first
bid quote during preopening is also at offer price.
Price Discovery in Initial Public Offerings 2909
Table II
Number of Quotes in the Preopening
Out of a total of 188 IPOs in the sample, 169 have one or more quote updates in the preopening five-minute window. Fourteen IPOs have the
first quote entered with at least 4:30 minutes left in the preopening period. On average for these 14 IPOs, there are only 1.14 quotes entered per
stock in the first 30-second period, but during the 30-second window just before trading starts, there is an average of 6.79 quotes entered per
stock.
Start of Preopening
Time Left
to Open 5:00–4:30 4:30–4:00 4:00–3:30 3:30–3:00 3:00–2:30 2:30–2:00 2:00–1:30 1:30–1:00 1:00–0:30 0:30–0:00
0:00–0:30 6.79 3.06 5.86 6.81 2.42 2.67 4.27 3.13 7.11 2.14
0:30–1:00 6.00 2.09 4.95 4.44 1.32 2.90 3.20 2.50 2.22
1:00–1:30 6.64 2.13 5.24 5.38 1.84 2.48 2.00 1.38
1:30–2:00 6.29 1.84 5.33 3.31 2.32 2.10 1.53
2:00–2:30 5.50 2.00 4.86 2.50 1.63 1.57
2:30–3:00 6.00 2.06 4.48 2.00 1.21
3:00–3:30 6.71 2.28 2.95 1.69
3:30–4:00 4.93 1.69 1.43
4:00–4:30 2.00 1.09
4:30–5:00 1.14
Number of IPOs 14 32 21 16 19 21 15 8 9 14
2910 The Journal of Finance
before the market opens; IPOs that have a longer preopening period also
have more quoting activity; and, third, IPOs that have a large increase in
price are the ones that have longer preopening periods.
Next, we examine which market makers are quoting in the preopening.
There are a total of 3,252 quotes during preopening for our sample of IPOs.
Quotes can be entered ~or revised! by the lead underwriter, comanagers,
wholesalers, or other market makers. Wholesalers are a category of firms
that make a market in thousands of Nasdaq stocks. Smith, Selway, and Mc-
Cormick ~1998! discuss how market making in Nasdaq stocks is the primary
business of wholesalers. Wholesalers typically have payment for order-flow
arrangements. They pay a rebate to order-entry firms to get the right to
execute the firm’s order flow. The payment for order flow does not have to
be in cash but can take other forms. Knight, Herzog, and Troster all trade
5,000 or more Nasdaq stocks.
4
The top five wholesalers have increased their market share from 21 per-
cent of Nasdaq’s trading volume in 1995 to 33 percent in 1998. The econo-
mies of scale in trading along with payment for order flow to discount
brokerage firms has made it possible for them to grow at a very fast pace.
Knight alone accounts for 17 percent of Nasdaq0OTC market share in June
1998. Often the wholesalers are either owned by or have a formal affiliation
with order-entry firms. These firms specialize in retail orders that are au-
tomatically executed at the inside quotes. For example, Battalio, Jennings,
and Selway ~1999! find the average trade size at the largest wholesaler,
Knight Securities, to be 377 shares with a 10 percent market share in Nas-
daq stocks. Knight is a consortium of 25 retail brokerage firms including
E*Trade, Waterhouse, Ameritrade, and Discover. Knight pays consortium
and nonconsortium members for order flow that is routed to it. In 1998
Knight made a market in 6,700 securities and averaged 75,000 trades per
day.
Table III shows that out of the total of 3,252 quotes, 13.28 percent are
entered by the lead underwriter, 14.33 percent by comanagers, 49.05 percent
by wholesalers, and 23.34 percent by all other market makers. The whole-
salers not only enter the largest percentage of quotes but are also aggressive
in improving the bid and ask. There are a total of 196 quotes that improve
the bid and 236 quotes that improve the ask. The number of quotes improv-
ing the bid and ask are relatively few. The lead underwriter improves 22.96
percent of the bid quotes, the comanagers 14.29 percent, the wholesalers
50.51 percent, and all other market makers 12.24 percent. It is clear that the
wholesalers are actively quoting. They have a large order flow that must be
filled and their incentive is to open trading at the equilibrium price.
The wholesalers are even more active in improving quotes on the ask side
and account for 84.75 percent of all ask improvements. The lead underwriter
is responsible for only 4.66 percent of ask quote improvements. The lead
4
The largest wholesalers are Knight Securities, Mayer and Schweitzer, Herzog Heine, and
Geduld, Troster Singer, Sherwood, and Nash Weiss.
Price Discovery in Initial Public Offerings 2911
Table III
Quoting Behavior of the Lead Underwriter
and Other Market Makers
This table provides information on which market makers are quoting during the preopening.
The market maker may be the lead underwriter who always starts out with the first preopen-
ing quote. The proportion of quoting by other comanagers is reported separately. Wholesalers
are market makers whose primary business is to make a market in thousands of Nasdaq stocks.
All other market makers ~besides the lead underwriter, comanagers, and wholesalers! are grouped
together. The sample is also split by initial returns ~offer-to-open!.
Total Bid Improvements Ask Improvements
N % N % N %
Panel A: Full Sample ~N ϭ 3,252 quotes!
Quotes entered by the lead
underwriter
432 13.28 45 22.96 11 4.66
Quotes entered by other
comanagers
466 14.33 28 14.29 7 2.97
Quotes entered by wholesalers 1595 49.05 99 50.51 200 84.75
Quotes entered by other market
makers
759 23.34 24 12.24 18 7.63
3252 100.00 196 100.00 236 100.00
Panel B: Initial Returns Յ 10% ~N ϭ 677 quotes!
Quotes entered by the lead
underwriter
98 14.48 3 17.60 3 2.94
Quotes entered by other
comanagers
85 12.56 4 23.50 4 3.92
Quotes entered by wholesalers 343 50.66 9 52.90 86 84.31
Quotes entered by other market
makers
151 22.30 1 5.90 9 8.82
677 100.00 17 100.0 102 100.00
Panel C: 10% , Initial Returns Յ 20% ~N ϭ 754 quotes!
Quotes entered by the lead
underwriter
108 14.32 15 38.46 5 6.85
Quotes entered by other
comanagers
127 16.84 5 12.82 0 0.00
Quotes entered by wholesalers 340 45.09 12 30.77 64 87.67
Quotes entered by other market
makers
179 23.74 7 17.95 4 5.48
754 100.00 39 100.00 73 100.00
Panel D: Initial Returns . 20% ~N ϭ 1,821 quotes!
Quotes entered by the lead
underwriter
226 12.41 27 19.29 3 4.92
Quotes entered by other
comanagers
254 13.95 19 13.57 3 4.92
Quotes entered by wholesalers 912 50.08 78 55.71 50 81.97
Quotes entered by other market
makers
429 23.56 16 11.43 5 8.20
1821 100.00 140 100.00 61 100.00
2912 The Journal of Finance
underwriter does not revise his quotes often. He watches the quoting behav-
ior of other market makers, particularly the wholesalers, and then revises
his own quotes. The quotes entered by the wholesalers and to some extent
the comanagers play an important role in the price discovery process. The
role of all other market makers is quite limited. We do not report results
classified by syndicate members because the rest of the syndicate ~besides
the lead underwriter and comanagers! does not play a significant role. Ellis,
Michaely, and O’Hara ~2000! find the market share of comanagers is quite
small in transactions done during the first few days after an IPO, but we
find their role is significant during preopening.
We also split the sample based on initial IPO returns ~offer-to-open! in
Panels B, C, and D of Table III. As expected, weak IPOs ~initial return less
than or equal to 10 percent! have very few bid improvements and relatively
more improvements in the ask quotes. The reverse pattern emerges for hot
IPOs ~initial return greater than 20 percent!. These have 140 bid improve-
ments and 61 ask improvements. The wholesalers account for 55.71 percent
of the bid improvements and 81.97 percent of the ask improvements.
Table IV reports the results of regressions with percentage change in the
lead underwriter’s bid quote as the dependent variable. Every quote change
by the lead underwriter is a new observation. The first quote after the pre-
opening is also an observation. The independent variables are
CDIFF ϭ
~comanagers’ average bid quote Ϫ lead underwriter’s ending bid quote!
lead underwriter’s ending bid quote
ϫ 100,
WDIFF and ODIFF are defined similarly using quotes by the wholesalers
and other market makers, respectively. Also included as independent vari-
ables are the percentage of quotes that are locked and crossed during this
period ~LCQUOTES! and the total number of quotes ~TQUOTES!.
Locked quotes occur when the bid equals the ask and crossed quotes occur
when the bid is greater than the ask. We find that it is the wholesalers
whose quotes result in locking0crossing the market. Fourteen IPOs in our
sample end the preopening period locked0crossed.
5
These are hot IPOs that
get locked0crossed early during preopening and they remain in this state
until the market opens. A wholesaler may have a large volume of retail buy
orders before the market opens but the best ask is for fewer shares than
what he needs. In this case the wholesaler may enter a bid higher than the
best ask in the hope of getting other market makers to adjust their quotes.
Some also contend that wholesalers increase the prices during the preopen-
ing and then short the stock once trading begins. If their retail buy order
5
According to Traders, May 1999, Nasdaq averaged 104 daily locked or crossed markets of
one minute or more in January 1999, 51 locked0crossed markets in August 1998, and only 22
locked0crossed markets in January 1999.
Price Discovery in Initial Public Offerings 2913
flow is large, then they have to take a short position to satisfy their cus-
tomer demand and would benefit from a high opening price. However, we do
not analyze this issue.
Model 1 in Table IV consists of all 263 bid quote changes by the lead
underwriter, Model 2 consists of 206 quote changes for 83 IPOs whose pre-
opening lasted for more than three minutes, and Model 3 consists of 57
observations for 86 IPOs whose preopening lasted for three minutes or less.
In each case the model is with and without the independent variables
LCQUOTES and TQUOTES. The coefficient on the WDIFF variable is pos-
itive and statistically significant in all six models. The CODIFF variable is
not statistically significant in any model. These results again suggest that
the lead underwriter finds quote changes provided by the wholesalers infor-
mative and accordingly revises his own quotes.
Table IV
The Lead Underwriter’s Learning Process
The dependent variable in all three models is the percentage change in the lead underwriter’s
bid price quote. The independent variables are
CODIFF ϭ
~comanagers’ average bid quote Ϫ lead underwriter’s ending bid quote!
lead underwriter’s ending bid quote
* 100;
WDIFF and ODIFF are defined similarly for wholesalers and other market makers, respec-
tively. The average quote is for the period in which the lead underwriter revises his quote. Also
included are the percentage of quotes that are locked and crossed ~LCQUOTES! and total num-
ber of quotes ~TQUOTES! during this same time period. N is the number of observations.
Model 1 uses the full sample of 169 IPOs with preopening quotes; Model 2 uses the 83 IPOs
whose preopening lasts for three minutes or more; and Model 3 uses the 86 IPOs whose pre-
opening lasts for less than three minutes. t-statistics are in parenthesis.
Model 1 Model 2 Model 3
Constant 0.01 0.01 0.01 0.01 0.01 0.01
~8.64!* ~4.22!* ~8.92!~4.25!* ~1.41!~1.94!**
CODIFF 0.05 0.06 0.06 0.07 Ϫ0.05 Ϫ0.05
~1.30!~1.54!~1.48!~1.63!~Ϫ0.48!~Ϫ0.40!
WDIFF 0.23 0.20 0.20 0.18 0.26 0.26
~6.26!* ~5.04!* ~4.96!* ~3.91!* ~2.68!* ~2.72!*
ODIFF Ϫ0.06 Ϫ0.05 Ϫ0.02 Ϫ0.02 Ϫ0.15 Ϫ0.16
~Ϫ1.18!~Ϫ1.05!~Ϫ0.41!~Ϫ0.31!~Ϫ1.68!** ~Ϫ1.78!**
LCQUOTES — 0.00 — 0.00 — Ϫ0.00
~1.19!~0.98!~Ϫ0.34!
TQUOTES — 0.00 — 0.00 — Ϫ0.00
~1.15!~0.89!~Ϫ1.30!
Adjusted R
2
~%! 19.16 19.04 18.97 18.80 7.57 7.30
F-statistic 21.76 13.37 17.08 10.54 2.53 1.88
N 263 263 206 206 57 57
* and ** significant at the 5 percent level and at the 10 percent level.
2914 The Journal of Finance
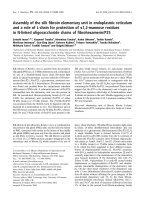
A.4. Price Discovery Model
We test the three hypotheses proposed by Biais, Hillion, and Spatt ~1999!
about price discovery in the preopening period and follow their approach.
The “pure noise” hypothesis postulates that market makers do not post in-
formative quotes during the preopening, whereas the “pure learning” hy-
pothesis states that preopening quotes are informative and the quote is equal
to the conditional expectation of the value of the asset. The “noisy learning”
hypothesis states that because of countervailing incentives, the opening price
should reflect a combination of the martingale ~from pure learning! and the
noise ~from pure noise!.
The following regression model is estimated:
Open Ϫ Offer ϭ a ϩ b
t
~Price
t
Ϫ Offer! ϩ e
t
, ~1!
where Price
t
is the indicative price during the preopening period at time t,
and the opening price on the first trading day of an IPO is used as a proxy
for the new equilibrium price and the IPO offer price as a proxy for the old
equilibrium price.
We estimate empirically the cross-sectional regression in equation ~1! for
each 30-second period of the five-minute preopening window. As seen in the
Amazon example, prices vary as time elapses during the preopening because
learning takes place. If the indicative price ~Price
t
! is the conditional expec-
tation of the value of the stock ~pure learning!, then innovations in the pre-
opening price are entirely informative about the value of the asset, and the
slope coefficient in equation ~1! should be equal to one. We estimate equa-
tion ~1! separately for each 30-second interval. Figure 3 plots the slope co-
efficient using bid quotes for each 30-second interval along with the 95 percent
confidence bands. The slope coefficient is not significantly different from
one, suggesting that significant learning occurs from the preopening quotes.
The lead underwriter does not change quotes too often during preopening,
but seems to watch and learn from the quoting behavior of other market
makers. The confidence interval is quite wide initially but it narrows sub-
stantially as opening time approaches.
B. Opening of Trading
Interviews with investment bankers indicate that most of them wait for
their Nasdaq trading desk to open trading in other stocks before they begin
trading an IPO. Therefore, it is not surprising that most IPOs do not start
trading at 9:30 a.m. There is considerable uncertainty with respect to pric-
ing an IPO at the open. Trading in IPOs starts with market makers posting
quotes; therefore, market makers need to decide where to quote. Market
makers seem to wait to see where the overall market opens before they enter
quotes in an IPO. The lead underwriter decides when trading starts and
informs the stock market of its decision.
Price Discovery in Initial Public Offerings 2915
Besides waiting to get an indication of where the overall market opens,
the market maker is also trying to gather information on what kind of trad-
ing to expect in the IPO. The delayed opening allows him to gather infor-
mation about buyers and sellers in the market. It is more difficult to open
trading in IPOs that jump up in price because there is an order imbalance.
B.1. First Trade in an IPO
For the full sample of 188 IPOs, 16 start trading between 9:30 and
10:00 a.m., 40 between 10:00 and 10:30 a.m., and 40 between 10:30 and
11:00 a.m., as seen in Table V. The start time is the time when the first
transaction takes place in the secondary market. There are 92 IPOs that
start trading after 11:00 a.m. compared with 96 that start trading before
11:00 a.m. The median size of offerings that start trading earlier is lower
than that of those that start trading later. IPOs that start trading during
the first half-hour after the market opens ~9:30 to 10:00 a.m.! have a median
size of $29.1 million. The median size is $42.1 million for IPOs that start
trading between 12:00 and 12:30 p.m. By 12:30 p.m., most IPOs have started
trading.
It is also interesting to note that IPOs that start trading during the first
hour have a median initial return of 4.56 percent. These returns increase
almost monotonically with the opening time until noon, as seen in Table V.
Figure 3. Price Discovery in the Preopening Period. The price discovery process is exam-
ined using the method proposed by Biais, Hillion, and Spatt ~1999!. The following regression is
estimated:
Open Ϫ Offer ϭ a ϩ b
t
~Price
t
Ϫ Offer! ϩ e
t
,
where the true value of the stock is proxied by the opening price on day 1, the offer price is the
proxy for the previous equilibrium price, and the indicative price at time t is Price
t
. The in-
dicative price at time t is taken as the average of the bid quotes and the average of the ask
quotes during the 30-second interval. If the preopening is efficient, then the slope coefficient b
t
should be equal to one. The figure presents the slope coefficients and the 95 percent confidence
interval.
2916 The Journal of Finance
Those offerings that start trading between 11:30 and 12:00 have an initial
return of 23.75 percent, between 12:00 and 12:30 the initial return is 12.03
percent, and between 12:30 and 1:00 it is 25.00 percent. After 12:30, very
few IPOs start trading and the sample size is limited. IPOs with large price
run-ups start trading later than IPOs whose price does not increase much.
The mean open-to-offer returns of the 96 IPOs that start trading by 11:00 a.m.
is 11.16 percent and 24.36 percent for the 78 IPOs that start trading be-
tween 11:00 a.m. and 1:00 p.m. The difference in the means of the two groups
is statistically different. After 1:00 p.m. only 14 IPOs start trading.
B.2. Lead Underwriter’s Preferences for First Trade Time
Nineteen investment banks served as the lead manager for four or more
offerings during our sample period. These 19 banks account for 116 of the
188 offerings in the sample. Some of these firms are counted twice because
of mergers during the period. For example, Montgomery Securities lead man-
aged 13 IPOs, the largest number of offerings before the merger, and also
lead managed another six after the merger as Nations Banc-Montgomery.
Another example is Alex Brown, which managed seven before the merger
and four more after the merger as BT-Alex Brown.
Our interviews with investment bankers reveal that Wall Street expects
certain underwriters to open at a certain time. For example, they mention
that Prudential opens their IPOs at 10:00 a.m., whereas Alex Brown nor-
mally starts around 1:00 p.m. This is exactly what we find. The starting
time for all lead underwriters who did four or more offerings during the
Table V
Opening Time of Nasdaq IPOs
The sample consists of 188 IPOs during the period May to October, 1997. The table provides
information on when the first trade occurs in each IPO. Start time is the half-hour time inter-
val in which the first trade occurs; N is the number of IPOs that start trading during the
particular half-hour period; mean and median are offering size ~proceeds! in dollars; mean and
median return are the returns in percent for an investor who buys at the offer price and sells
at the open price.
Start Time N Mean Size Median Size
Mean Return ~%!
~Open Ϫ Offer!0Offer
Median Return ~%!
~Open Ϫ Offer!0Offer
9:30–10:00 16 $ 53,015,406 $29,150,000 5.78 4.56
10:00–10:30 40 $ 40,792,097 $29,083,331 10.63 5.59
10:30–11:00 40 $ 43,478,933 $33,125,000 17.07 13.89
11:00–11:30 29 $ 45,003,500 $35,000,000 16.10 15.34
11:30–12:00 28 $ 50,139,261 $38,500,000 34.60 23.75
12:00–12:30 14 $ 40,010,714 $42,125,000 20.41 12.03
12:30–1:00 7 $ 37,082,143 $32,000,000 26.34 25.00
1:00–1:30 4 $ 56,275,000 $45,650,000 9.58 14.30
1:30–2:00 6 $105,231,059 $51,875,000 20.27 15.78
2:00–2:30 4 $ 54,815,532 $11,925,500 13.61 12.22
Price Discovery in Initial Public Offerings 2917
sample period is reported in Table VI. The median starting time for the four
offerings done by Prudential is 10:02 a.m. and the median starting time for
Alex Brown is 1:00 p.m. for the seven offerings lead managed by them. After
their merger, BT-Alex Brown did four more offerings with a median starting
time of 1:47 p.m. Investment bankers told us that they like market partici-
pants to know when to expect trading to start. For example, if Prudential is
known to start at 10:00 a.m. they try to keep it as such.
The range between the earliest time and the latest time when a particular
lead manager starts trading certain IPOs can be quite large. For example,
the median starting time for Alex Brown is 1:00 p.m., but the earliest trad-
ing in an IPO in which Alex Brown is the lead underwriter is 11:30 a.m. and
the latest is 1:50 p.m. This raises the question as to why the same under-
writer starts trading certain IPOs early and others later. Besides the pref-
erence of the lead underwriter, characteristics of the individual offering also
determine the opening time. Therefore, we examine whether initial returns
~offer-to-open! are different for IPOs done early versus those that are done
later.
For each investment bank that lead managed four or more IPOs, the dif-
ference in initial returns of the two offerings done latest versus the two done
earliest are reported in Table VI. This difference is positive for 15 lead un-
derwriters and negative for only four. As an example, Goldman Sachs lead
managed 10 IPOs during the sample period. The two that opened earliest
had an average initial return of 8.63 percent, whereas the two that opened
last had an average initial return of 61.72 percent, resulting in a difference
of 53.09 percent. For all 19 lead managers, the average difference in returns
between the two latest and two earliest IPOs is 10.01 percent. Even though
the lead underwriter has time preferences, it opens IPOs that jump up a lot
in price later.
B.3. Initial IPO Returns
We analyze other characteristics besides the preference of the lead under-
writer that explain initial IPO returns. Our model uses explanatory vari-
ables that have not traditionally been used in the literature. The regression
model is estimated with initial returns measured as ~open-offer!0offer in per-
centage as the dependent variable for all 169 IPOs that have preopening
quotes. The independent variables are: log of proceeds in millions ~SIZE!,
number of quotes in the preopening five-minute window ~PQUOTES!, the
opening time of trading in seconds past midnight ~CLOCK!, and a dummy
variable equal to zero if the start time is before the mean start for the
underwriter ~DTIME!, as reported in Table VI. The DTIME variable is in-
cluded to control for underwriter preferences for the start time of trading.
The number of quotes in the five-minute preopening window is significant
in explaining initial returns as shown in Table VII. This is consistent with
our earlier finding that IPOs with large price runups use the full five-
minute preopening window and also have a larger number of quotes. The
2918 The Journal of Finance
Table VI
Lead Underwriter’s Preferences for Trade Starting Time
The table provides information on trading preferences of 19 lead underwriters who did four or more IPOs. The table is sorted by mean starting
time. The name of the lead underwriter, the number of IPOs done by them ~N !, the mean and median starting time for the IPOs, the earliest
and latest time at which the first trade takes place; and the difference in initial returns are presented. Difference in initial returns is the
difference in offer-to-open returns between the two IPOs done last and the two IPOs done first by that particular lead underwriter.
Lead Underwriter N Mean Starting Median Starting Earliest Latest
Difference in
Initial Returns
~%!
Salomon 4 9:58 a.m. 10:00 a.m. 9:44 a.m. 10:08 a.m. 24.59
Lehman 7 10:01 a.m. 10:00 a.m. 9:36 a.m. 10:30 a.m. 7.59
Oppenheimer 4 10:12 a.m. 10:07 a.m. 10:03 a.m. 10:30 a.m. 6.60
DLJ 4 10:17 a.m. 10:12 a.m. 9:30 a.m. 11:13 a.m. 4.83
Bear-Stearns 4 10:20 a.m. 10:17 a.m. 10:15 a.m. 10:30 a.m. 11.78
Prudential 5 10:22 a.m. 10:02 a.m. 10:00 a.m. 12:00 p.m. 3.91
A.G. Edwards 6 10:27 a.m. 10:10 a.m. 9:45 a.m. 11:58 a.m. 7.29
Smith Barney 7 10:29 a.m. 10:30 a.m. 10:15 a.m. 11:04 a.m. 23.86
Raymond James 4 10:34 a.m. 10:10 a.m. 10:00 a.m. 11:57 a.m. 13.55
Friedman, Billings 4 11:08 a.m. 11:00 a.m. 10:30 a.m. 12:00 p.m. 0.00
Montgomery Securities 13 11:11 a.m. 11:10 a.m. 10:10 a.m. 12:35 p.m. 33.58
Nations Banc-Montgomery 6 11:30 a.m. 11:33 a.m. 10:45 a.m. 12:14 p.m. Ϫ4.37
Goldman Sachs 10 11:31 a.m. 11:42 a.m. 10:25 a.m. 12:15 p.m. 53.09
Hambrecht & Quist 8 11:34 a.m. 11:37 a.m. 11:05 a.m. 11:58 a.m. 3.04
Robertson Stephens 7 11:44 a.m. 11:35 a.m. 10:41 a.m. 12:46 p.m. 1.01
Morgan Stanley 7 11:51 a.m. 11:45 a.m. 11:15 a.m. 1:00 p.m. Ϫ4.07
Cruttenden 5 12:08 p.m. 12:20 p.m. 10:30 a.m. 2:02 p.m. Ϫ0.94
Alex Brown 7 1:00 p.m. 1:00 p.m. 11:30 a.m. 1:50 p.m. 10.13
BT-Alex Brown 4 1:50 p.m. 1:47 p.m. 1:45 p.m. 2:00 p.m. Ϫ5.30
Price Discovery in Initial Public Offerings 2919
time of day when trading starts ~CLOCK! is also significant at the 10 per-
cent level. The dummy variable, DTIME, which is equal to zero if the open-
ing time is before the underwriter’s mean opening time is not significant.
The analysis is also repeated using the traditional measure of initial returns
~close-to-offer!, and the results are similar.
III. Summary and Conclusions
We analyze several issues in the initial price discovery process of IPOs.
The initial trading of IPOs is quite different from the opening of trading in
a regular stock that already trades in the secondary market. First, IPOs
only have an offer price to serve as a benchmark and no other trading his-
tory exists. Second, the lead underwriter, who takes the company public,
plays an important role as a market maker in the aftermarket. Third, trad-
ing in IPOs can start at any time during the day at the discretion of the lead
underwriter.
Trading in IPOs is preceded by a five-minute preopening period instead of
the typical 90-minute period for non-IPO stocks. The lead underwriter starts
the process by entering the first quote in the five-minute preopening win-
dow. These preopening quotes are not binding. We find that this first quote
is very informative and can explain a large proportion of initial returns even
for hot IPOs. Our analysis also shows that significant learning and price
discovery continue during the five-minute window. Hundreds of quotes are
Table VII
Regression Results for Opening Time
The dependent variable is the open-to-offer return ~%!. Dollar proceeds of the offering in mil-
lions ~SIZE!, time of day in seconds after midnight when trading starts ~CLOCK!, the number
of quote entries in the five-minute preopening window ~PQUOTES!, a dummy variable ~DTIME!
equal to one if the first trade is before the mean time for the lead underwriter, as reported in
Table V, and zero otherwise are the independent variables. One hundred sixty nine observations
that had preopening quotes are used in the model. t-statistics are in parenthesis.
Constant Ϫ0.62
~Ϫ1.86!*
SIZE 0.03
~1.46!
CLOCK 0.06 ϫ 10
Ϫ4
~1.81!**
PQUOTES 0.01
~10.68!*
DTIME 0.02
~0.65!
Adjusted R
2
45.50%
F-statistic 36.06
N 169
* and ** significant at the 5 percent level and at the 10 percent level.
2920 The Journal of Finance
entered during this period for IPOs that have large price runups. The quotes
are gradually revised upwards reaching the equilibrium trading price for
hot IPOs. The number of quotes entered also increases as time to open trad-
ing approaches.
The group of market makers referred to as wholesalers enters the largest
proportion of quotes during the preopening. These market makers are not
part of the syndicate but they make a market in thousands of Nasdaq stocks
and this is their primary business. They make payment for order flow and
therefore receive a large amount of the retail order flow. The wholesalers do
not just enter quotes actively but are also the ones who most often improve
the best bid and best ask, sometimes causing the market to lock0cross. In a
locked market the best bid is equal to the best ask and in a crossed market
the best bid is greater than the best ask. Hot IPOs get locked0crossed early
during preopening and remain in this state even at the end of the preopen-
ing period. The wholesalers lock0cross the market in the hope that other
market makers will change their quotes and therefore the order f low re-
ceived by the wholesalers can be executed at the equilibrium price. The lead
underwriter learns a great deal from the quoting pattern of the wholesalers
and to some extent from the comanagers. The rest of the syndicate does not
play a significant role.
IPOs often start trading much after the market opens. Investment bank-
ers have preferred times when they like to open trading in IPOs. Most IPOs
do not start trading at 9:30 a.m. Underwriters like to get trading of other
Nasdaq stocks started before turning to IPOs. They also prefer to observe
the market opening before entering quotes in IPOs. IPOs that have higher
initial price runups open later. This finding is consistent with the state-
ments of underwriters and market makers that IPOs need a period of time
for price discovery. The time of day when trading in an IPO starts is an
important variable in explaining initial returns even after controlling for
investment bank preferences.
The lead underwriter has flexibility in deciding when to start trading in
an IPO. Price discovery starts with the very first quote entered by the lead
underwriter and it continues during the five-minute preopening window.
The frequency of quotes increases as time to open trading approaches. Be-
cause IPOs are not required to start trading when the market opens, it is
not clear that a longer preopening period helps in the price discovery pro-
cess. We expect that if the preopening period is lengthened, most of the
activity will still take place in the few minutes prior to the opening of trading.
REFERENCES
Aggarwal, Reena, 2000a, Stabilization activities by underwriters after new offerings, Journal of
Finance 55, 1075–1104.
Aggarwal, Reena, 2000b, Allocation of IPOs and flipping activity, Working paper, Georgetown
University.
Aggarwal, Reena, and Pietra Rivoli, 1990, Fads in the IPO market? Financial Management 19,
45–57.
Price Discovery in Initial Public Offerings 2921
Barry, Christopher B., and Robert H. Jennings, 1992, The opening price performance of initial
public offerings of common stock, Financial Management 22, 54–63.
Battalio, Robert, Robert Jennings, and Jamie Selway, 1999, Will payment for order flow sur-
vive decimalization? Working paper, Indiana University.
Benveniste, Lawrence M., Walid Busaba, and William J. Wilhelm, 1996, Price stabilization as
a bonding mechanism in new equity issues, Journal of Financial Economics 42, 223–255.
Biais, Bruno, Pierre Hillion, and Chester Spatt, 1999, Price discovery and learning during the
preopening period in the Paris Bourse, Journal of Political Economy 107, 1218–1248.
Cao, Charles, Eric Ghysels, and Frank Hatheway, 2000, Why is the bid greater than the ask
price? Price discovery during the Nasdaq pre-opening, Journal of Finance 55, 1339–1365.
Chowdhry, Bhagwan, and Vikram Nanda, 1996, Stabilization, syndication and pricing of IPOs,
Journal of Financial and Quantitative Analysis 31, 25–42.
Ellis, Katrina, Roni Michaely, and Maureen O’Hara, 2000, When the underwriter is the market
maker: An examination of trading in the IPO aftermarket, Journal of Finance 55, 1039–
1074.
Hanley, Kathleen W., Arun Kumar, and Paul Seguin, 1993, Price stabilization in the market for
new issues, Journal of Financial Economics 34, 177–197.
Logue, Dennis, Richard Rogalski, James Seward, and Lynn Foster-Johnson, 1999, Underwriter
book-building methods, investment bank reputation, and the return performance of firms
conducting initial public offerings, Journal of Business, forthcoming.
O’Reilly, Michael, 1999, Locked and crossed markets, Traders, May 25–27.
Prabhala, N.L., and Manju Puri, 1998, How does underwriter price support affect IPOs?, Work-
ing paper, Yale University.
Prial, Dunstan, Nasdaq rules aim to end chaos of early trading in Internet IPOs, Asian Wall
Street Journal, 3 February 1999, p. 17.
Ritter, Jay, 1991, The long-run performance of initial public offerings, Journal of Finance 46,
3–27.
Ruud, J.S., 1993, Underwriter support and the IPO underpricing puzzle, Journal of Financial
Economics 34, 135–151.
Schultz, Paul H., and Mir A. Zaman, 1994, Aftermarket support and underpricing of initial
public offerings, Journal of Financial Economics 35, 199–219.
Smith, Jeffrey W., James P. Selway, and Timothy McCormick, 1998, The Nasdaq Stock Market:
Historical background and current operation, Working paper, NASD.
2922 The Journal of Finance