cbot - a six-part study guide to market profile
Bạn đang xem bản rút gọn của tài liệu. Xem và tải ngay bản đầy đủ của tài liệu tại đây (12.63 MB, 346 trang )
::::::::::::::::
::::::::::::::::
_iiiiiiiiiiiiiiii
:::::::::::::::::
!iiiiiiiiiiiiiiii
::::::::::::::::3
-•
:::::::::::::::::
iiiiiiiiiiiiiiiii M A R K E T
:::::::::::::::::
:::::::::::::::::
:::::::::::::::::
iiiiiiiiiiiiiiiii PRo F_t E_'
:::::::::::::::::
:::::::::::::::::
:::::::::::::::::
:::::::::::::::::
:::::::::::::::::
::::::::::3::::::
:::::::::::::::::
:::::::::::::::::
::::::::::::::::
:::::::::::::::::
:::::::::::::::::
:::::::::::::::::
:::::::::::::::::
:::::::::::::::::
:::::::::::::::::
::::::::3:::::::3
:::::::::::::::::
:::::::::::::::::
:::::::::::::::::
:.:.:.:.:.:.:.:.:
:::::::::::::::::
:::::::::::::::::
:::::::::::::::::
:::::::::::::::::
:::::::::::::::::
:::::::::::::::::
:::::::::::::::::
:::::::::::::::::
:::::::::::::::::
_iiiiiiiiiiiiiiiiiA SIX-PART
iiiiiiiiiiiiiiiiiiSTUDY GUIDE TO FROMTHE
iiiiiiiiiiiiiiiii TPOCOUNTTO
:::::::::::::::::
:::::::::::::::::
iiiiiiiiiiiiiiiii
_ DISTRIBUTIONAND
MARKET LIQUIDITYDATABANKs
PROFILE® VOLUblEANALYSIS
iiiiiiiiiiiiiiiii
:iiiiiiiiiiiiiiii
iiiiiiiiiiiiiiiii
iiiiiiiiiiiiiiiii
iiiiiiiiiiiiiiiii
_iiiiiiiiiiiiiiii
!iiiiiiiiiiiiiiii
iiiiiiiiiiiiiiiii
_iiiiiiiiiiiiiiii
:::::::::::::::::
:iiiiiiiiiiiiiiii
iiiiiiiiiiiiiiiii
::::::::::::3:::
iiiiiiiiiiiiiiiii
::::::::::::::::
_iiiiiiiiiiiiiii_
_iiiiiiiiiiiiiiii
iiiiiiiiiiiiiiiii
iiiiiiiiiiiiiiii!
iiiiiiiiiiiiiiiil
iiiiiiiiiiiiiiii_
iiiiiiiiiiiiiiii
::::::::::::::::
iiiiiiiiiiiiiiii
iiiiiiiiiiiiiiii
iiiiiiiiiiiiiiii
C B 0 T®
MARKET
PROFILE ®
PART I
READINGTHEMARKETPROFILE®GRAPHIC
0 ChicagoBoardofTrade
InternetAddress
Care has been taken in the preparation of this material, but there is no warranty or representation expressed or
implied by the Chicago Board of Trade to the accuracy or completeness of the material herein.
Your legal counsel should be consulted concerning legal restrictions applicable to your particular situation which
might preclude or limit your use of the futures market described in this material.
Nothing herein should be construed as a trading recommendation of the Chicago Board of Trade.
©1996 Board of Trade of the City of Chicago,
ALL RIGHTS RESERVED. Printed in the USA.
PARTI: CONTENTS
READINGTHE
MARKETPROFILE®GRAPHIC INTRODUCTION 2
THEMARKET'SORGANIZATIONALSTRUCTURE 5
TheConceptualFramework 5
TheMarketProfile®Graphic 11
KindsOfRangeDevelopment 12
RangeDevelopmentAndBalanceAndImbalance 18
MonitoringActivityWithTheMarketProfile®Graphic 21
RelatingToTheBiggerPicture 34
WhoIsMostActiveInTheValueArea? 35
RangeExtension 36
InitiatingAndResponsiveActivity 45
INTRODUCTION
The material in this six-part Study Guide evolved from a seminar
program developed for Chicago Board of Trade members. The
emphasis is on understanding the Market Profile ®concept and not
on trading strategies because we found that when the CBOT
traders grasped the concept, they had no trouble developing
strategies consistent with their own style of trading.
• Part I discusses how to read the daily Market Profile ®graphic.
In Part II explains how longer-term trends can be monitored with
daily data.
[] Part III discusses why the fundamental perception of value is at
the heart of every market decision.
• Part IV shows how daily and long-term market activity distributes
over time.
II Part V tells you how to combine market activity and the
perception of value in order to analyze a developing trading
session.
[] Part VI analyzes Liquidity Data Bank ®volume in order to gauge
strength or weakness in the market.
We have added a glossary of Market Profile terms and an index to
the original text in order to make this updated version of the Home
Study Guide more useful. At the same time, we are retaining the
early steps in Peter Steidlmayer's breakthrough research discussed in
Parts I and II so that you can see the logical progression in the devel-
opment of Market Profile analysis from its beginning in a single
session to its use in global markets.
Although the terms "day time frame trader" and "other time frame
trader" may be dated, the way the two groups interact isn't. Traders
and investors are still basically either short- or long-term market par-
ticipants. And their behavior is still determined by their view of
value. And value is still at the heart of market activity. Therefore,
knowing how each group impacts activity in a single session makes it
much easier to understand how they distribute beans, bonds, or corn,
for instance, over longer periods of time.
Why? Because it is the interaction between short- and long-term
market participants that distributes trading volume in a bell-shaped
curve. The back-and-forth movement reflects the continual tug-of-
war between the "forward price influence" of long-term traders and
the "backward price influence" of short-term market participants.
We are also keeping the original examples because the vertical and
horizontal Market Profile organization is as relevant in 1995 as it was
in 1984 even though global markets have outgrown the single
session. The same organizing principles that made the Profile
graphic a realistic market model of a single session in the 1980s
provide a realistic model now of continuous, 24-hour activity. Since
the organization of Market Profile data is based on a natural
construct, the format simply expands to encompass global activity.
We show you how to relate the format to the distribution process in
global markets in Parts IV, V, and VI.
2
TheConnectionBetween According to the dictionary, distribution is "the position, arrange-
DistributionAnd ment or frequency of occurrence over an area or throughout a space
MarketProfile®Data or unit of time'.' The volume of everything distributes around a
mean over time. Why should trading volume be different?
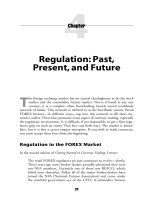
From the beginning, Peter Steidlmayer recognized that the basic
pattern of market behavior is a continuing point, counterpoint:
imbalance, balance, imbalance, balance, etc. Now, in his latest work,
he relates this continuum to the process of distribution. His recent
research shows that the market's ultimate common denominator is a
balanced distribution-in other words, the bell shaped curve.
When market activity forms a bell shaped profile, a segment of
market action is complete. Stated another way, a balanced distribu-
tion is the long-term framework to which you relate short-term
moves in individual sessions.
Market Profile ®data captures and continuously updates this
development.
1/4/90 1/4/90 1/5/90
DAY EVENING NEXTDAY
98-16 P
98-15 P
98-14 P
98-13 P
98-12 P
98-11 P
98-10 Qa P
98-09 QTa PQ
98-08 QRTWXab OPQ
98-07 QRTUVWXab OPQ
98-06 QRSTUVWXabc qr OPQR
98-05 PQRSTUVWXbc opqr OPQRSUV
98-04 PQRSVWbc nopq OPQRSTUV
98-03 OPSVWcd klmno OQRSTUV
98-02 OPVWcd klmn ORSTUVW
%01 OVcd kn RSTUVW
98 Od STVW
97-31 Od SW
97-30 0 W
97-29 W
97-28 WX
97-27 Xa
97-26 Xa
97-25 Xa
97-24 a
97-23 a
97-22 a
97-21 a
3
Trading24-hourMarkets Probably the most important change since Steidlmayer first intro-
With Market Profile® Data duced the Market Profile ®concept is that the day, as a definitive
market segment with a definite beginning and end, is outdated. In
24-hour markets, you're working with a timeless continuum. This
means that a new beginning can occur at any time.
Despite this change, however, the market's basic imbalance-balance
behavior pattern is still the same.
For this reason, our discussion of Market Profile* begins with
development in a single session and in a simple trend-so that you
can see how the pattern develops in relatively uncomplicated situa-
tions. We're using data from 1986 in Parts I and II because these
sessions are especially illustrative of the market's point, counter-
point behavior.
We believe that once you've seen how the market shifts from imbal-
ance to balance in simple situations, you'll be able to recognize the
shift in more complex global markets. We also believe that market
decisions are less difficult to make when they are based on a solid
foundation. That's why we're starting at the beginning and giving
you the entire knowledge base.
As you go through Parts I and II, however, keep in mind that you're
going to expand what happens in a single session to 24-hour
markets. This means that certain ideas-the initial balance and the
time/price opportunity (TPO) count, for example-are going to
become less important. These ideas will continue to contribute to
your overall understanding, but they're going to become part of
your background knowledge.
Steidlmayer's most recent work relating distribution to market activ-
ity is not a negation of his previous research. It simply explains the
basic concept more fully. His insight into the distribution process
pulls the various components together into a coherent whole.
AValuableSkill Perhaps the most important benefit of Market Profile* data is that
it vastly simplifies the trading process.
Over the past six years, Steidlmayer has stripped market activity to
its essential elements. His research shows that the market has only a
finite number of behavior patterns and that the finite number is
universal from market to market. This means that once you can
recognize the patterns with Market Profile* data, the knowledge
can be applied in all markets. Since the number of exchanges
around the world where you can use these skills is continually grow-
ing, your potential rewards can be significant.
Because Market Profile* is a tool rather than a buy/sell system,
reading Market Profile* data involves grasping principles-not just
memorizing rules. Those who make the effort, however, will have a
valuable skill. Buy/sell systems lose their effectiveness when markets
change. Market Profile ®data, on the other hand, captures and lets
you see the change so that you can adjust accordingly.
If you take the time to master each step in this Study Guide, you'll
have a solid knowledge base that can help you make futures trading
4 more conservative, more manageable and more rewarding.
THEMARKET'SORGANIZATIONALSTRUCTURE
TheConceptualFramework Asnoted in the introduction, Market Profile ®is a dec&ion-support
tool-not a trading system. In order to use the Market Profile ®
tools, you have to know what makes them work. That's why we're
going to start with the conceptual framework.
Don't worry if you don't grasp the organizing principles immedi-
ately. We'll be using them over and over again, so they will be old
friends by the time we're done. While you may not sense the impor-
tance of these principles initially, understanding how they relate to
market activity is critical.
Why? Because these organizing principles explain why market activ-
ity & not arbitrary or random.
Peter Steidlmayer recognized this organizational structure and
related it to an overall framework. The idea for the Market Profile ®
product was conceived by him and the CBOT product is based on
his original research.
Steidlmayer identified recurring behavior patterns in the trading pit
and then asked himself why they were occurring. Therefore, even
though the Market Profile ®vocabulary may seem unfamiliar at first,
it simply describes and explains what is happening in the marketplace.
As we work with the data, keep in mind that each piece of informa-
tion is not an indicator by itself. You'll see that we put several pieces
of information together in order to come to a conclusion.
It's also important to recognize that your market decisions are
always going to require judgment. Market Profile ®can't change
that. Unfortunately, it can't predict the future-but then nothing
can. What Market Profile ®can do is help you to understand the
present. And if you understand what's happening now, in the pre-
sent, you can make better decisions.
With that said, we can begin our discussion of the market's organ-
izational structure as outlined by Steidlmayer. You'll see for yourself
as we move forward that no matter how sophisticated your Market
Profile ®analysis becomes, it is always going to rest on these basic
principles.
• One:TheAuctionFramework
The purpose of the marketplace is to facilitate trade. What does
that mean? In the broadest sense, it simply means that as the price
moves up, it brings in more buying or, as the price moves down, it
brings in more selling.
The marketplace facilitates trade with the dual auction process.
Basically, the market auctions up until there are no more buyers.
Then it reverses and moves down until there are no more sellers.
The end of an up auction is the beginning of a down auction, etc.
All market activity occurs within this broad framework-with the
market moving up to shut off buying and down to shut off selling.
Getting a little more specific, we can say that the market begins,
moves directionally and advertises for an opposite response to shut
off the directional move. 5
That statement is at the heart of the market's organizational struc-
ture. What does it mean?
Say the market moves up directionally and the up move brings in
selling. The selling is an opposite response which one stops the up
move-in other words, shuts off the buying-and two causes the
market to reverse and move down. The result: the up auction ends
and a down auction begins.
Now let's say the market moves up and advertises for selling but
doesn't get any. Instead, it brings in more buying. Therefore, the
market has to move higher to bring in an opposite response. The
result: the up auction continues.
At bottom, that's what you're always looking for: continuation or
change.
[] Two:TheNegotiatingProcess
Now if we get even more specific, we can say that a directional
move establishes parameters that contain the auction's price range,
an unfair low at the low end and an unfair high at the high end.
THREERELATEDPRICES The unfair low and the unfair high are excesses.
Unfair high Once the market defines a range with excesses at each end, it
negotiates within that range to establish value. The market trades
between the established excesses until it either trades above the high
excess or below the low one.
Stop the market at any point in time and you'll see these three
reference points: unfair low, unfair high and value somewhere in
between. These three price areas define the negotiating process-the
method the marketplace uses to facilitate trade.
What does this mean in a real market situation?
Value To demonstrate, let's look at a bar chart of the Dow Jones from
April 1987 to the end of October 1989 see page 14.
The unfair high on this chart (point A) was established in August
1987, the unfair low (point B) in October 1987. You can see that
these parameters were containing the market's long-term range at
that time. (A new unfair high at the 2900 level was established in
June 1990.)
Once the parameters at A and B were established, the market
Unfair I()_'_r negotiated between the two excesses to develop value.
The negotiating process moved value up gradually from the unfair
low to the unfair high. Value reached the unfair high (point C) on
October 13, 1989.
Because of the perception of value at that time, the market couldn't
trade above the high parameter and it reversed.
The result: the excess established in 1987 continued to contain the
range on the upside until June 1990.
In other words, at the end of October 1989, the market attempted
to take out the unfair high. However, when the United Airlines deal
collapsed and seemed to indicate a possible end to leveraged buy-
outs, market participants lost confidence and the market reversed.
6
DISTRIBUTINGAROUNDAMEAN • Three:BalanceandImbalance
To facilitate trade in order to distribute goods and services, the
market moves from imbalance to balance to imbalance and back
again. It uses this behavior pattern in a single session and in longer-
term trends or auctions.
If the market is balanced, basically equal amounts of buying and
selling are present. The market has brought in an opposite response.
ling above The market is rotating because it has found a fair price around
which it can distribute.
If the market is imbalanced, either buying or selling is predominant.
The market is moving higher or lower in order to find an opposite
Mean (fair price) response. The market is moving directionally because it is seeking a
fair price around which it can distribute.
In brief, a balanced market has found a fair price. An imbalanced
market is seeking a fair price.
Buying below This is simply another way to state the familiar law of supply and
demand. Buyers demand and sellers supply. The market is either in
equilibrium between buyers and sellers or it is working toward that
equilibrium.
• Four:Steidlmayer'sTandemTimeFrameConcept
First let's define Steidlmayer's use of the term "time frame'.'
Time frames are forcing points-in other words, points in time that
force a decision. These points can be imposed by the market (i.e.,
the close) or by something in your personal situation (i.e., you have
the right to an option that expires in two months).
To explain, say the market has been trading for three hours and the
close is coming up in 45 minutes. If you don't want to carry the
position overnight, your time is running out. The close is forcing
you to make a decision within a relatively short-term time frame.
You're a short-term trader in this situation because the forcing point
is only 45 minutes away.
You're a longer-term trader in the second situation because your
option doesn't expire for two months. The forcing point is two
months off. Consequently, you have a longer-term time frame in
which you can operate without having to make a decision.
With this insight, Steidlmayer was able to divide all market activity
into two categories: short-term and longer-term.
He calls short-term activity day time frame activity.
He calls longer-term activity other time frame activity.
His tandem time frame concept visualizes short-term or day time
frame activity on one side of the tandem and all longer-term activi-
ty on the other side (hence the name "other time frame").
Since long- and short-term activity exist simultaneously in the
marketplace, you have to be able to separate one kind of activity
from the other.
We're going to separate one from the other with behavior.
7
LONG-TERMBUYERSAND • Five:Short-andLong-termActivityIs Definedby Behavior
LONG-TERMSELLERSDO NOT The short-term trader's behavior characteristic is his desire for a fair
TRADEWITHEACHOTHERAT
THESAMEPRICEATTHESAMETIME. price. The best he can do is a fair price because he has to trade
today. Since a fair price is acceptable to both buyers and sellers,
short-term buyers and sellers do trade with each other at the same
price at the same time.
The longer-term trader's behavior characteristic is his desire for an
Advantageous area advantageous price. He can wait for an advantageous price because
for long-term seller he doesn't have to trade today. Since longer-term buyers' and sellers'
objectives are different, they do not trade with each other at the
same price at the same time.
(In a strict technical sense, a longer-term buyer with a 10 to 15-day
time frame may trade with a longer-term seller with a two- to three-
day time frame. But these traders are a small part of the total
longer-term group.
Short-term buyers Steidlmayer treats longer-term traders as a single entity because he
and is concentrating on the active longer-term trader who drives the
short-term sellers market and affects range development.)
do trade with
each other here. Longer-term buyers want to buy low; longer-term sellers want to sell
high. Therefore, the same price can't be advantageous for both at
the same time. That's why you can know exactly who (buyer or
seller) is doing what at any time in the day's range.
To apply this unfamiliar concept to single sessions or to longer-term
trends, it's important to define what an advantageous price means
in relation to value. We'll discuss what an advantageous price means
in relation to longer-term value later on. Here, we're going to con-
sider what an advantageous price means in relation to today's value
Advantageous area area.
for hmg-term buyer The market develops a fair price area in the session for short-term
buyers and sellers-in other words, those who have to trade today.
Most of the day's volume occurs in this fair price area. The high
volume shows acceptance.
In contrast to the amount of time spent in the value area, the
market spends very little time at the advantageous prices above and
below value. These advantageous prices are low volume, rejected
excess areas. Prices above the value area are advantageous for the
longer-term seller; prices below it are advantageous for the longer-
term buyer.
How do we know it's the longer-term trader who is active at
advantageous prices?
Only traders with a longer-term time frame-in other words, those
who don't have to trade today-can take a chance on making their
trade in an area where the market doesn't spend much time. If you
have to trade today, you can't count on being able to enter your
trade in a low volume, basically unfair area. The high volume area
where the market spends most of its time provides the liquidity you
need.
• Six: Boththe Short-termTraderandthe Longer-termTraderHavea
Roleto Playin FacilitatingTrade
This role grows out of their behavior.
8
Since the short-term trader is seeking a fair price, his role is to find
a price area wheretwo-sidedtrade can occur. Steidlmayercallsthis
an initial balance area.
(Currently, it seems to take one hour in CBOT grain futures to find
an area where two sided trade can occur. Before CBOT financial
futures sessions were lengthened, it also seemed to take an hour in
those contracts to find an initial balance area. Now that the ses-
sions are longer, however, finding the initial balance in CBOT finan-
cials seems to take one hour and 40 minutes.)
As the financial contracts underscore, initial balance parameters can
change.
Therefore, the important thing is to understand the initial balance
concept-the amount of time it takes the shorter-term trader to find
an area where two-sided trade can occur. Then you can determine
these parameters in any market.
Earlier, we said the role of the short-term trader was to find an area
that market participants would consider fair. We also said that the
market opens and moves directionally in order to establish
parameters to contain the range.
If the unfair high and the unfair low established in the initial
balance period hold throughout the session, the shorter-term trader
is in control.
If, on the other hand, the longer-term trader enters the market with
enough volume, he can disturb the initial balance and extend the
range-establishing a new high or low parameter.
This takes us to the longer-term trader's role in facilitating trade: his
role is to move the market directionally-in other words, to extend
the range up or down.
• Seven:PriceCanOnlyBeAbove,Belowor WithinValue
We're going to monitor the activity level of the longer-term trader as
he responds to prices above, below or within value in order to antic-
ipate whether the market will move up, down or sideways.
Our focus is always on what the longer-term trader is doing
because, in pursuing his interests, he is responsible for the way the
day's range develops and for the length of time a longer-term trend
lasts.
We'll discuss the longer-term trader's influence on trend develop-
ment in Part II. In this section, we're going to consider his influence
on the way a single session develops.
We're going to examine the principles we've just discussed in rel-
atively uncomplicated sessions so that you can see how they work.
We believe that once you understand how these concepts work in a
single session, you'll be able to apply them to longer-term trends
and then to 24-hour markets.
Keep in mind, though, that certain ideas such as the initial balance,
the TPO count and the kinds of range development are going to
become less important. These ideas will continue to contribute to
your overall understanding, but they're going to become part of
your background knowledge.
9
StopAndTestYourself
Q. All activity occurs within what?
A. The auction framework.
Q. The market moves up to shut off what? It moves down to shut
off what?
A. Up to shut off buying. Down to shut off selling. The market
auctions up until the last buyer buys and then down until the last
seller sells.
Q. The market establishes parameters and then trades between
these parameters developing value until it takes out one side.
What is this process called?
A. The negotiating process. It is defined by three related price
areas-an unfair high, an unfair low and value somewhere in
between.
Q. The market moves from what to what and back again in order
to facilitate trade?
A. Imbalance to balance.
Q. There are two kinds of activity. What are they?
A. Day time frame and other time frame-in other words, short-
term and longer-term.
Q. Short-term and longer-term activity is defined by what?
A. Behavior. The short-term trader is seeking a fair price; the
longer-term trader is seeking an advantageous price.
Q. What determines a trader's role in the market?
A. Behavior. The short-term trader who is seeking a fair price
finds an area where two-sided trade can occur. The longer-term
trader who is seeking an advantageous price moves the market
directionally.
10
TheMarketProfile® Lookat the example on page 15. (This material is published in a
Graphic 3-ring binder so that you can take the examples out and hold them
next to the relevant text.) This example shows the Market Profile ®
graphic for Dec bonds on 9/5/86. The Market Profile ® format
organizes price and time into a visual of what happens in a single
session.
The price range for the session is on the left. The letters show the
half-hour time period in which each price traded. At that time,
A represented 8:00 to 8:30, B represented 8:30 to 9:00, etc.
Since then, the CBOT has changed the letters indicating time.
In January 1990-in order to accommodate 24-hour markets-the
CBOT assigned a character to each half-hour trading period on a
24-hour basis. Half-hour periods from midnight to noon are
represented by capital letters A through X. Half-hour periods from
noon to midnight are represented by small letters a through x.
The day session for U.S. Treasury bond futures now resumes at 7:20
a.m. in "O" period and ends at 2 p.m. in "d" period. See page 46
for more information.
Although the graphic may look different, only the characters are
different. The organizing principle is exactly the same. You're still
looking for price reoccurrence in order to see where the market is
developing value.
In this Home Study Guide, we use examples with the old letters as
well as the new ones so that you can see for yourself that the
behavior patterns are exactly the same. If you understand the basic
principles, you'll recognize the patterns and you won't be confused
by a change in characters.
No matter what the character, each symbol in the profile graphic
represents a time/price opportunity-TPO for short. A TPO is an
opportunity created by the market at a certain time at a certain
price.
These time/price opportunities are the basic unit for analysis of the
day's activity. They are either accepted or rejected.
On 9/5/86, the bond futures market offered participants a series of
TPOs from 97-14 to 96-04.
TPOs from 97-14 to 97-05 on the top and from 96-04 to 96-06 on
the bottom were rejected.
TPOs from 96-07 to 97-04 were accepted. The area in which the
market spent the most time-from 96-11 to 96-29-shows the most
acceptance.
The rejected areas established parameters-an unfair high and an
unfair low-which contained the range. Then the market negotiated
within this range to establish value.
The session on page 15 is the end result of the negotiating process
for Dec bond futures on 9/5/86-an unfair high area at 97-14 to
97-05, an unfair low area at 96-04 to 96-06 and value roughly in the
middle, a little closer to the unfair low.
11
We're going to look at this session time period by time period so
that you can see how the negotiating process works in detail. But
before we do that, let's discuss the different kinds of range
development.
KindsOfRangeDevelopment Asnoted earlier, the longer-term trader affects the way the range
develops. Now you'll see what that means.
If the longer-term trader is not very active, you have what
Steidlmayer calls a "normal" day.
The session we've been examining on page 15 is a normal day. Look
at the first column in the profile graphic. Steidlmayer calls this
column the pioneer range because it shows you the first time a price
is hit in a session.
Look at the graphic and you can see that the range for the day
was established in the first half hour of trading. In 1986, the short-
term trader found the initial balance in bond futures in the first
hour of trading-in A and B periods. On normal days, 85% or
more of the range isformed in the initial balance period. Any range
extension is usually slight and occurs late in the day.
In other words, the short-term trader basically establishes
parameters for the day's range. Then the market rotates between
those parameters for the entire session.
What is the characteristic of a normal day?
The short-term trader sets the parameters that contain the range.
In other words, the short-term trader is in control. The market has
found a fair price and is distributing around it.
If the longer-term trader is more active and extends the range past
the initial balance area, you have what Steidlmayer calls a "normal
variation" day.
Look at page 16. The market's initial balance is found in CBOT
grain futures in the first hour of trading. (In D and E periods at
that time; now in T and U periods.) Look at the pioneer range and
you can see that the initial balance area covers 621 ½ to 628.
In G period, the longer-term trader came into the market with
enough volume to tip the market's initial balance and extend the
range. The range extension started at 628 ¼ and continued up to
633.
What is the characteristic of a normal variation day?
The longer-term trader extends the range past the initial balance
area.
The short-term trader's initial parameters do not hold. There is
some directional movement which extends the range and sets a new
high or low parameter.
12
In this example, the range extension is approximately double the
initial balance area. Therefore, control is roughly divided between
the short- and the longer-term trader. If the range extension were
wider than the initial balance, the longer-term trader would be in
control. That's why maximum range extension on a normal variation
day is roughly double the initial balance area.
It's important to keep in mind, however, that this is the maximum.
The range extension on a normal variation day isn't always that
wide. It can be anywhere from a few ticks to about double the
initial balance. Naturally, the wider the range extension, the greater
the influence of the longer-term trader.
When the range extension is considerably more than double the
initial balance area, you have what Steidlmayer calls a "trend" day.
Look at the example on page 17. This is a grain future and the
market's initial balance is found in the first hour of trade-in D and
E periods here.
The initial balance area covers 502_A to 505 ¼. It is roughly 1/3of
the day's range and the range extension-from 505 _/2to 511-is
roughly 2,4of the range. You can also see that the market moved in
one direction all day. The longer-term trader kept extending the
range up-first in G, then in I, J and K periods.
What is the characteristic of a trend day?
The market moves in one direction and closes on the directional
extreme.
The longer-term trader is in control. The market is moving direc-
tionally in search of a fair price.
When there is range extension but no net influence from the longer-
term trader, you have what Steidlmayer calls a "neutral" day.
Look at page 18. The longer-term trader first extended the range
down in F period and then changed his mind and extended it up in
L period. Neutral days indicate uncertainty. Often the market uses
these days to change direction.
What is the characteristic of a neutral day?
There is range extension in both directions.
13
1'0 Sum Up It helps to think of control in terms of range extension.
When there is no range extension, the short-term trader is in
control.
When the longer-term trader sets a new higher or lower parameter
at one end of the range, he is exerting more influence. If the range
extension is roughly double the initial balance area, control is
roughly divided between the short- and longer-term trader.
If the range extension is considerably more than double the initial
balance area, the longer-term trader is in control.
When the longer-term trader extends the range in both directions,
one range extension generally cancels out the other. In that case, the
longer-term trader has no net influence on the session. Therefore,
the short-term trader is basically in control.
DowJonesIndustrialAverage:WeeklyBarChart
3000
C
A •
,'' r l jlilrl If "rl "t[lll
_l"lgl.tli) _.,,]_ttl,.,1¢,l,ri,,,_l[rr i _,00
, ,,I .,IFI.IJl_lll{hlql'lg'''jll_'l'l'H't 2000
i}Fltr,ll.rtr I.,.
B
1500
Apr Jul Oct Jan Apr Jul Oct Jan Apr Jul Oct
1988 1989
14
Normal
Du
MarketProfile*Graphic
-el'* MARKETPROFILE* CopyrightChicago Board of Trade 1986.
ABalancedSituation CBOTUSBONDS Dec(86) ALL RIGHTS RESERVED.86/09/05
TradePrice HalfHourBracketTimes
9714/32 A
9713/32 Pioneer A
9712/32 range A
9711/32 A
9710/32 A Rejected TPOs
97 9/32 A Unfair high area
97 8/32 A
97 7/32 A
97 6/32 A
97 5/32 A
97 4/32 AG
97 3/32 AG
97 2/32 AG
97 1/32 AG
97 AG
9631/32 AGHK
9630/32 AGHKL
9629/32 AFGHKL
9628/32 AFGHKL
9627/32 AFGHKL
9626/32 AEFHKL Accepted TPOs
9625/32 AEFHKL
9624/32 AEFHKL
9623/32 ABEFHKL
9622/32 ABEFHIKL
9621/32 ABCDEFHIJKLValue area
9620/32 ABCDEHIJL
9619/32 ABCDEHIJL
96 8/32 ABCDEIJL
96 7/32 ABCDEIJL
96 6/32 ABCDEiJL
96 5/32 ABCDEIJL
96 4/32 ABCDEIJL
96 3/32 ABCDIJL
96 2/32 ABCDIJ
96 1/32 ABCDIJ
96 0/32 ACIJ
96 9/32 ACIJ
96 8/32 AC
96 7/32 AC
96 6/3296 5/32 Rejected TPOs
96 4/32 A Unfair low area
15
NormalVariation
It
uay: Market Profile ®Graphic
CombinationOfBalance MARKETPROFILE® CopyrightChicagoBoard of Trade 1988.
AndImbalance SOYBEANS Mar (88) ALL RIGHTS RESERVED. 88/01/22
TradePrice HalfHourBracketTimes
633 J "
6323/4 J
6321/2 JK
6321/4 JK
632 JK
6313/4 JK
6311/2 JK
6311/4 JK
631 JK
6303/4 JK Range exlension tip
6301/2 JK
6301/4 JK
630 IJK
6293/4 IJK
6291/2 IJK
6291/4 IK
629 HIK
6283/4 GHIK ,
6281/2 GHIK
6281/4 GHIK
628 DFGHIK
6273/4 DFGHI
627i/2 DEFGHI
6271/4 DEFGH
627 DEFGH
6263/4 DEFG
6261/2 DEFG
626I/4 DEF
626 DEF
6253/4 DF
6251/2 D
6251/4 D
625 D
Inilial balance
624i/2 D
624 D
6233/4 D
6231/2 D
6231/4 D
623 D
6223/4 D
622I/2 D
6221/4 D
622 D
6213/4 D
6211/2 D j
16
Trend
Ilu
MarketProfile_Graphic
_al: MARKETPROFILE® CopyrightChicago Board of Trade1987.
AnImbalancedSituation SOYBEANS Nov (87) ALL RIGHTS RESERVED.87/08/19
TradePrice HalfHourBracketTimes
511 K
5103/4 K
510I/2 K
5101/4 K
510 JK
5093/4 JK
5091/2 IJK
5091/4 IJK
509 IJK
5083/4 IJK
5081/2 IJK
5081/4 IJ Range extension
508 GIJ
5073/4 GHIJ
5071/2 GHIJ
507I/4 GHI
507 GHI
5063/4 GHI
5061/2 GHI
5061/4 GH
506 G
5053/4 G
505I/2 G
5051/4 EG
505 EG
5043/4 DEG
5041/2 DEFG
504I/4 DEFG
504 DEF
5033/4 D Initial balance
5031/2 D
5031/4 D
503 D
5023/4 D
502i/2 D
5021/4 D
17
Neutral
By MarketProfile®Graphic
_a.: MARKETPROFILE* CopyrightChicago Board of Trade1988.
ABalancedSituation CBOTUS BONDS Mar (88) ALL RIGHTSRESERVED.88/01/07
TradePrice HalfHourBracketTimes
88 9/32 L
88 8/32 L
88 7/32 L Range
88 6/32 L extension tip
88 5/32 L
88 4/32 L
88 3/32 L
88 2/32 AL
88 1/32 AL
88 ADL
8731/32 ADKL
8730/32 ADKL
8729/32 ADHIKL
8728/32 ACDEHIJK
8727/32 ACDEHIJK
8726/32 ACDEHIJK
8725/32 ABCDEHIJK
8724/32 ABCEGHIJK
8723/32 ABCEGHIJK
8722/32 BCEFGHIJK
8721/32 BCEFGHJK
8720/32 BCEFGHJK
8719/32 8EFGHJK
87 18/32 BEFJK
87 17/32 BEFK
87 16/32 BEFK
87 15/32 F
87 14/32 F Range
87 13/32 F extension down
RangeDevelopmentAnd Astrategy that works when the market is balanced and rotating
BalanceAndImbalance (trading range market) is not going to be appropriate when the
market is imbalanced and moving directionally (trending market).
Thus an ability to recognize the difference can have a major impact
on your bottom line.
When the longer-term trader has the least influence, the market is
the most balanced.
What kind of range development is balanced?
• Normaldays:the entire range or roughly 85°70of the range is
formed in the initial balance period. Therefore, there is either no
range extension or very little range extension.
18
• Neutraldays:one range extension generally cancels out the other
so there is no net influence from the longer-term trader.
As the longer-term trader's influence increases, he creates an
imbalance.
What kind of range development do you have when the longer-term
trader introduces imbalance?
• Normalvariationdays:the longer-term trader extends the range
past the initial balance area. Specifically, you have balance,
imbalance and then adjusted balance. On the most imbalanced
normal variation day, the range extension roughly doubles the
initial balance area.
When the longer-term trader exerts maximum influence, the market
is the most imbalanced.
What kind of range development do you have?
• Trenddays: the market moves in one direction and closes on the
directional extreme. The range extension is generally more than
twice as long as the initial balance area.
KindsOfRangeDevelopment
• NORMAL
> Short-term in control.
> Balanced situation.
> 80%0of the volume is short-term; 20% is longer-term.
• NEUTRAL
> Short-term in control.
> Balanced situation.
> 70% of the volume is short-term; 30°70is
longer-term.
• NORMAL VARIATION
> Control is divided.
> Combination of balance and imbalance.
> If a little range extension, 80% of the volume is short-term;
20°7ois longer-term. If a lot of range extension, 60°7oof the
volume is short-term; 40% is longer-term.
• TREND
> Longer-term in control.
> Imbalanced situation.
> 40% of the volume is short-term; 60% is Longer-term.
19
StopAndTestYourself
Q. There are two kinds of prices. What are they?
A. Accepted and rejected. An accepted price area is simply a price
area where the market trades over time. Accepted prices show
value.
A rejected price area is simply a price area where the market spends
very little time. Rejected prices show excesses in the market-an
unfair high and an unfair low.
Q. There are two kinds of activity. What are they?
A. Day time frame which is short-term activity and other time
frame which is longer-term activity.
Q. Activity (short- or long-term) is defined by what?
A. Behavior. The short-term trader is seeking afair price. The
longer-term trader is seeking an advantageous price.
Q. What is the role of the short-term trader?
A. The short-term trader establishes an initial balance area so that
two-sided trade can occur.
Q. What is the role of the longer-term trader?
A. The longer-term trader moves the market directionally.
Q. Which trader is responsible for the way the range (normal, nor-
mal variation, trend, neutral) develops?
A. The longer-term trader.
In other words, the amount of activity executed by the longer-term
trader determines whether the market is balanced and rotating or
imbalanced and moving directionally.
The more influence the longer-term trader exerts, the greater the
range extension and the more imbalanced the market.
Q. The market moves from what to what and back again in order
to facilitate trade?
A. Imbalance to balance.
20
MonitoringActivityWith Now,we're going to look at range development in greater detail.
TheMarketProfile®Graphic* Basically, all activity in a session can be included in three
categories:
activity that produces single print extremes.
activity that produces range extension.
activity that produces a value area.
To get as much information on the longer-term trader as possible,
Steidlmayer divides the range into these three areas-extremes,
range extension and value area-and monitors the longer-term
trader's behavior in each area. Even when the longer-term trader is
least active (on normal days), he still can influence development on
the extremes and in the value area.
So we'll start by looking at the extremes and the value area on a
normal day.
Earlier, we said the market establishes parameters and then negoti-
ates between them, developing value. This is the negotiating process.
To help you see how the process establishes parameters (which are
extremes) and develops value, we're going to examine the session on
9/5/86, time period by time period.
Before we begin, though, some background.
Extremes are formed when the longer-term trader competes with
the short-term trader for opportunities at that price level. The more
eager he is to compete, the longer the single print extreme.
To show that the longer-term trader was interested enough to com-
pete, you need at least two single prints. One single print shows you
that the market offered an opportunity and no one wanted it.
The more single prints there are, the stronger the competition.
With that said, let's look at the session on pages 22 to 33. Keep in
mind that extremes are formed by competition; the value area is
formed by rotations.
*The Market Profile ®graphic is copyright by the Chicago Board of Trade 1991.
All Rights Reserved. 21
_;_For the _ake of ._,implicity,we're going to say {he market operas at
97 !4. I_ Part IIi, we'll discuss exactl.'.ewhere the market opens
and the implicaf.ioos.
@ Sell_ng moves the market out of the area down to 5}6-04.We
k.now it. was selling because C.'_erP arket moves down to sI'mt off"
s¢lliP g. As the market moves dcP,vn, i_ is advertisb_g for an
opposit.e response.
.,_@ <There is so much. compethion .from the longer-term. ,sally.,-<'" that "
the short-term trader has to move the market down more than a
poiBt,
22